https://www.drroyspencer.com/2021/07/uah-global-temperature-update-for-june-2021-0-01-deg-c/
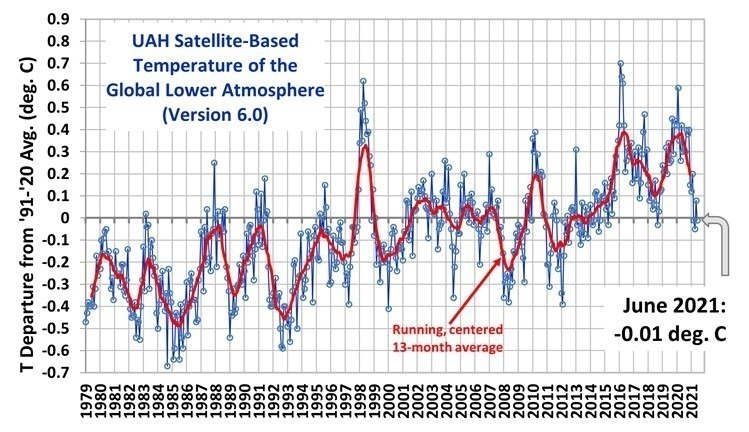
Dr. Spencer: The linear warming trend since January, 1979 remains at +0.14 C/decade (+0.12 C/decade over the global-averaged oceans, and +0.18 C/decade over global-averaged land).
Despite the near-normal global average temperatures, the USA Lower 48 temperature anomaly of +1.44 deg. C was the warmest in the 43 year satellite record, ahead of +1.15 deg. C in 1988. In contrast, the Antarctic region (poleward of 60 S latitude) experienced its 2nd coldest June (-1.25 deg. C), behind -1.34 deg. C in June, 2017.
The full UAH Global Temperature Report, along with the LT global gridpoint anomaly image for June, 2021 should be available within the next few days here.
Additional discussion/comments:
https://wattsupwiththat.com/2021/07/02/uah-global-temperature-update-for-june-2021-0-01-deg-c/
metmike: The data is confirming exactly what I've been saying for over a year now!
The drought out West that's now over a year old and the recent heat wave in the Northwest were caused by this current La Nina........cool water anomalies in the Tropical Pacific. This is also associated with the -PDO in the Pacific......which is the cool phase.
Global warming(climate change) causes more EL NINO's which, by definition are warm water anomolies in that location. We are having modest GLOBAL COOLING right now.
This naturally caused drought and heat waves, like the record setting one a week ago in the Northwest, are a product of this global cooling pattern and weather.
Global warming/climate change causes more El Nino's that cause MORE rain in the US.......indisputable fact. It protects the US from major, widespread droughts.
It's why climate change and its increase in El Nino's has resulted in the least belt wide drought in the cornbelt in recorded history.
The last 2 times were 2012-from a strong La Nina(our recent La Nina has been weak, fortunately) and in 1988-from another strong La Nina.
Again, La Nina's are COOL water in the tropical Pacific and they are a natural global cooling pattern. They(this one) causes the exact opposite weather that climate change from global warming causes.
It's easy to blame droughts and heat waves on global warming/climate change but its 100% junk, anti science with respect to the United States right now and at any point.
El Nino's can cause droughts at other places in the world though.
Re: Re: Re: Re: June 2021 historic heat W US
By metmike - June 25, 2021, 4:29 p.m.
https://www.marketforum.com/forum/topic/71468/#71587
https://www.marketforum.com/forum/topic/71468/#71588
La Nina conditions are predicted to strengthen again later this year, which is bad news for breaking the drought in the West this Winter:

https://wattsupwiththat.com/2021/07/03/el-nino-and-the-lengthening-new-pause-now-6-years-10-months/
The latest UAH temperature anomalies show that the New Pause has lengthened by another two months to 6 years 10 months. As usual, the Pause is defined as the longest period, up to the most recent month for which data are available, during which the linear-regression trend on the monthly global mean lower-troposphere temperature anomalies shows no increase.


Since IPCC predicted in 1990 that there would be warming over the following decades at a rate equivalent to 0.34 C°/century, there have been two risers in the staircase, caused by the unusually large el Niños in 1998 and 2016:

According to Wu et al. (2019), the anthropogenic contribution to global warming from 1990-2013 was 53%. Since the subsequent period was dominated by the naturally-occurring el Niño event of 2016, one may take it that the anthropogenic contribution to warming from 1990 to the present is unlikely to exceed 50%.
A forthcoming paper by some of my distinguished colleagues will shortly provide further evidence tending to confirm that the anthropogenic contribution to the warming of recent decades is no more than 50%. In that event, warming of only 0.7 C°/century equivalent since 1990 is attributable to our sins of emission. Yet IPCC had predicted a medium-term anthropogenic contribution equivalent to 2.8 C°/century at midrange (in one place) and 3.4 C°/century equivalent (in another). These midrange predictions were respectively four times and five times the 0.7 C°/century equivalent anthropogenic contribution to warming since 1990. But the BBC and the Economist will make quite sure that you never hear any such inconvenient truths.
This is more confirmation of what REALLY happened in the 1930's and also of the EPA rewriting climate heat wave history at their site in April 2021..... to wipe out the MUCH hotter 1930's as proven here:
https://www.marketforum.com/forum/topic/71468/#71521
https://wattsupwiththat.com/2021/07/03/el-nino-and-the-lengthening-new-pause-now-6-years-10-months/

Wikipedia also decided to get into the weather record data doctoring act to get the recent heat wave to appear to be even hotter.
They have replaced the long lived, well documented 119 deg. F temperature as the hottest in Oregon history with the 118 deg. F which was the peak earlier this week.
Scroll down some at this link:
https://www.marketforum.com/forum/topic/71468/#71827
Re: Re: Re: Re: Re: June 2021 historic heat W US
By metmike - June 30, 2021, 7:25 p.m.
There they go again, doctoring data to make it less hot in the past in order to present data that shows it much hotter in the present!
This time its Wikepedia.
They just changed the all time record high in Oregon to this:
| 118 °F (48 °C) | June 29, 2021 § | Hermiston |
https://en.wikipedia.org/wiki/U.S._state_and_territory_temperature_extremes
Busted em because this was the previous hottest ever in Oregon and had been listed on the same page by Wikepedia for the last 2 decades but was just replaced with the 118 Deg F above from this recent heat wave.
Last time that I checked, 119 deg. F is hotter than 118 deg. F.
In 1898 there was no air conditioning and it was also before atmospheric CO2 went up by over 100 parts per million.
Earlier, I discovered yet another recent data manipulation trick by the EPA to make it appear as if recent heat waves were worse than the 1930's which is off the charts laughable for anybody with the actual data:
My position(proven here with 10 times more data needed to prove something) is that the actual amount of warming measured in the REAL world is only half of that which the models predict because the models are flawed. We have measured the amount of radiation absorbed with real instruments and its only half the amount programmed into the models.
And the planet is massively greening up. Most life considers this a wonderful climate optimum, with the optimal level of CO2 for plants over double the current level. Cold still kills something like 200 times more life than heat on this planet.