
Producers and traders may remember the surprise we got 11 years ago during the corn crop harvest.
Yields across the central and especially the Southern Cornbelt came in as much as 20 bushels/acre less than expected/predicted in the warmest locations.
It was hot and wet during the Summer of 2010. Crop ratings stayed very high because of all the rains. The corn plants all looked great from the outside. The market was trading a near record crop. But the heat caused accelerated maturity..........heat fill.
When they actually got into the corn, instead of plump kernels, they found small kernels.
The hotter it is, the faster the corn plant matures(accumulates heat units or growing degree days). The faster it matures, the less time it has to fill the kernels. Less time filling, means less filling and smaller kernels.........period.
It's an irrefutable law of agronomy that can't be offset by any amount of rain or other factors.
The heat won't hurt the beans but it WILL reduce production for corn from wherever it would be in those areas that average temps well above normal (for more than just a few days) because kernels will be smaller.......kernel weight lower. The longer the heat lasts, the greater the effect.
Conversely, cool temperatures do the opposite and maximize yields.
https://www.pioneer.com/us/agronomy/high-night-temps-yield.html
2010 Growing Season
https://www.pioneer.com/us/agronomy/high-night-temps-yield.html

Figure 1. Daily minimum temperatures (7-day moving average) for Des Moines, IA, in 2009 and 2010, and 30-yr average minimum daily temperatures (1981-2010). Approximate dates of 10%, 50%, and 90% silking in Iowa in 2009 and 2010 based on USDA crop progress reports.


Figure 2. Average minimum temperatures experienced in July-August of 2009 (top) and 2010 (above) and average yields (bu/acre) in Iowa, Illinois, Missouri, Kansas and Nebraska. Data from NCEI NOAA, USDA NASS.
O
ICM News
by Roger Elmore, Department of Agronomy
"October corn yield forecast for Iowa dropped to 169 bushels per acre, a significant reduction from the August and September forecasts of 179 bushels per acre (see October USDA-NASS forecast). If realized, 2010 yields will rank sixth among the last seven years, higher only than the yields of 2006 (166 bushels per acre). Numerous published and anecdotal yield reports substantiate lower than expected yields this year.
In previous 2010 Integrated Crop Management News articles, we've addressed 2010 conditions and the possibility of reduced yields resulting from rapid crop development following silking (see September 28 article). Statewide Growing Degree Day accumulations were 116 percent of normal during most of the seed fill period — silk to dent — this year."
Table 2. Effect of temperature on grain fill duration, grain weight per plant and kernel number (Badu-Apraku et al., 1983).

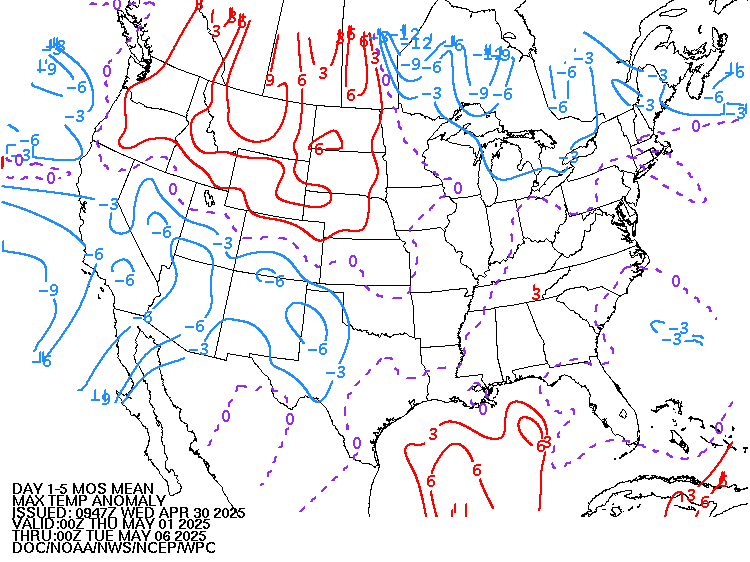
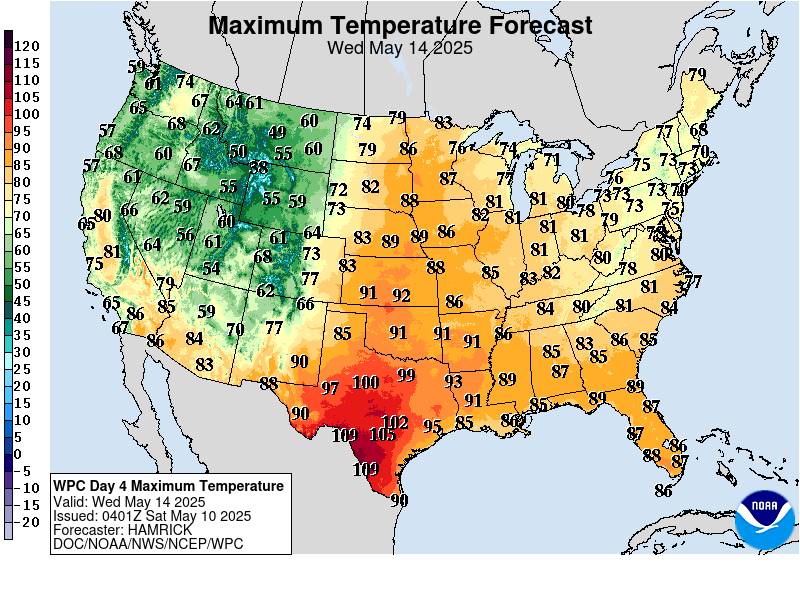
Highs for days 3-7:
https://www.wpc.ncep.noaa.gov/medr/medr_max.shtml



+++++++++++++++++++++++++++++++++
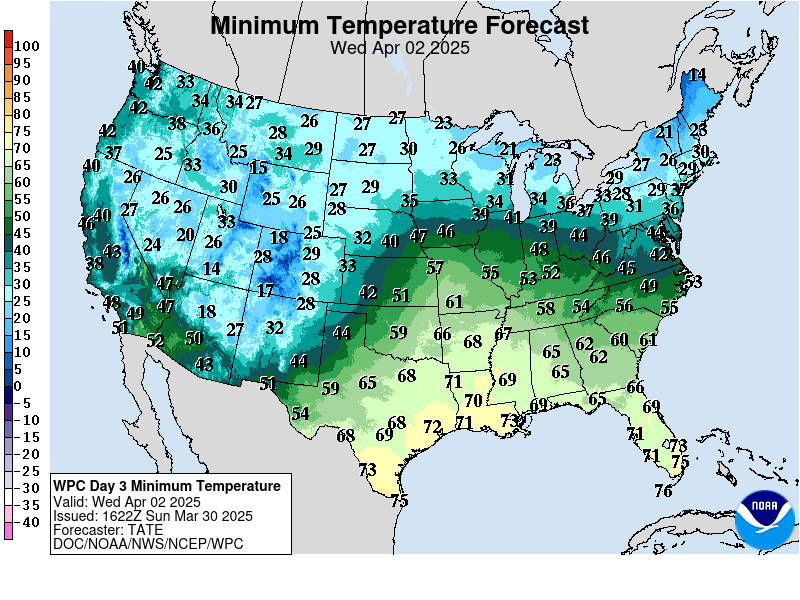
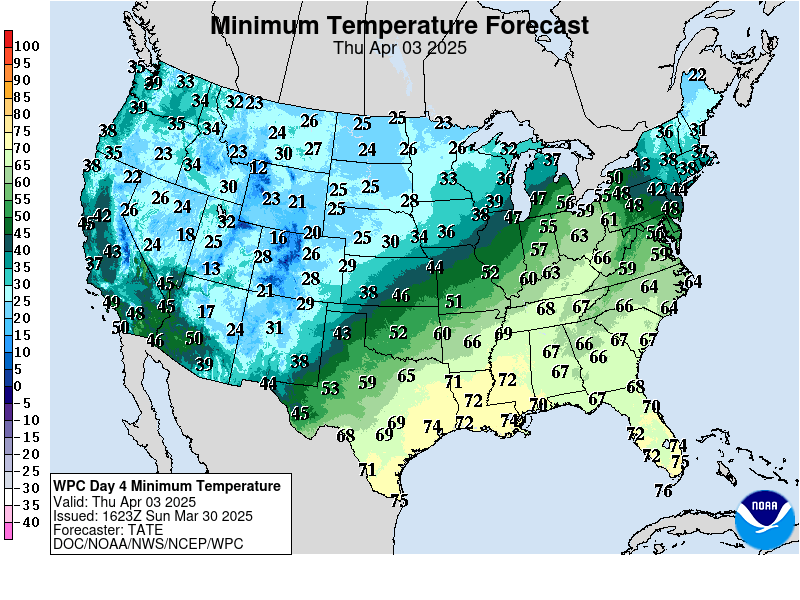
Lows days 3-7 below:
https://www.wpc.ncep.noaa.gov/medr/medr_min.shtml

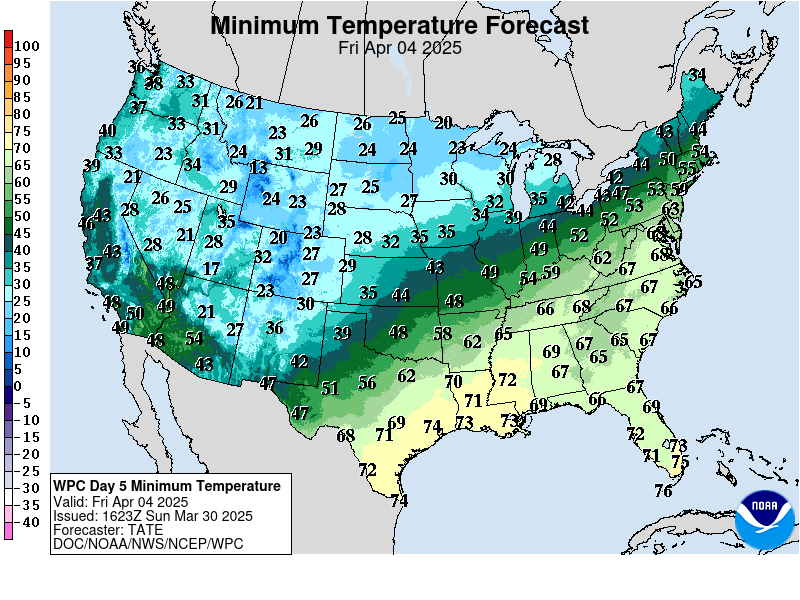
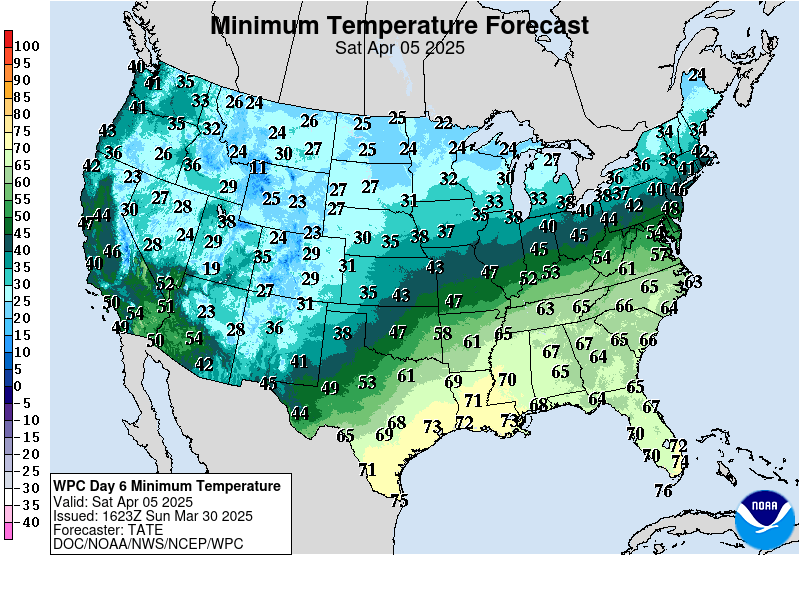
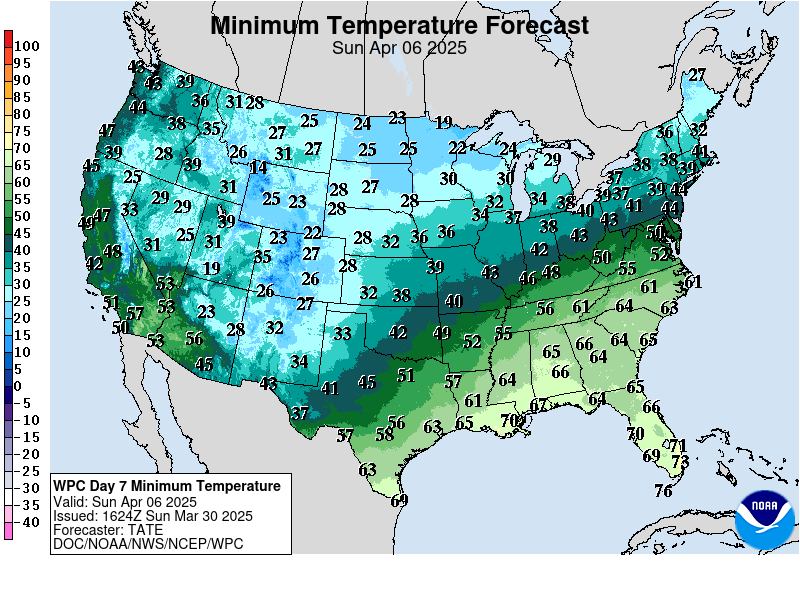
Extended weather.
https://www.cpc.ncep.noaa.gov/products/predictions/610day/ | |||||||||
| 6 to 10 day outlooks | |||||||||
| Click below for information about how to read 6-10 day outlook maps Temperature Precipitation | |||||||||
| Click below for archives of past outlooks (data & graphics), historical analogs to todays forecast, and other formats of the 6-10 day outlooks ArchivesAnalogsLines-Only FormatGIS Data | |||||||||
Temperature Probability | |||||||||
Precipitation Probability | |||||||||
This week features NO cool nights and 'limited' precip. As stated in another topic, most around here now worried.
I like to compare grain fields to local golf courses. I am easily 20-30 yards longer on my drives as irrigation of fairways can not replace evaporation and golf superintendents save the watering for the greens. Without much (any) rain and WARM/HOT nights, there is no dew to keep plant cool and hydrated. Pod fill will be inhibited, but may still have time. Probably too late for above average corn yields, contrary to my expectations ten -seven days ago.
Cycle wise corn and beans probably put in a weekly low Friday 20 weeks out from last weekly cycle low on March 30. I expect a 3-5 week rally!
Thanks tjc,
Your market views are greatly valued here!
Pretty bad heat fill for corn in the southern belt, continuing the next several days.
Cooling a bit next week but still very warm in many places. This has taken several bpa off the national corn yield.......FOR SURE.
I remember 09 well. Great yields.. Didn't start corn harvest until after my wedding anniversary (Nov 11) and didn't finish until Thanksgiving. Pretty late for western Ohio. And the moisture was still in the mid twenties. Used alot of propane that fall.
although we just missed another rain by just a few miles again today the heat has not been quite as bad as 2011....that year we had 23 straight 90 days and this year its only been about 6 or seven.....but this year we are in the midst of no rain since 7/16 so its not good
Thanks,
Yes, there was also concerns that the 09 crop would not be mature in time to avoid a freeze because the GDD's were wimpy all Summer.
We ended up having a late freeze which allowed the crop to finally mature but in October, drying rates are extremely low because of temperatures not as warm as September and like you said, all the corn was still wet, even after leaving it in the field for numerous weeks.
And huge crops are harder to dry down to begin with.
Sorry to hear you missed this rain mcfarm.
It really hurts when the counties just to your west have flash flood warnings and the storms broke up over you.