
The Reuters guess was 25 bcf.
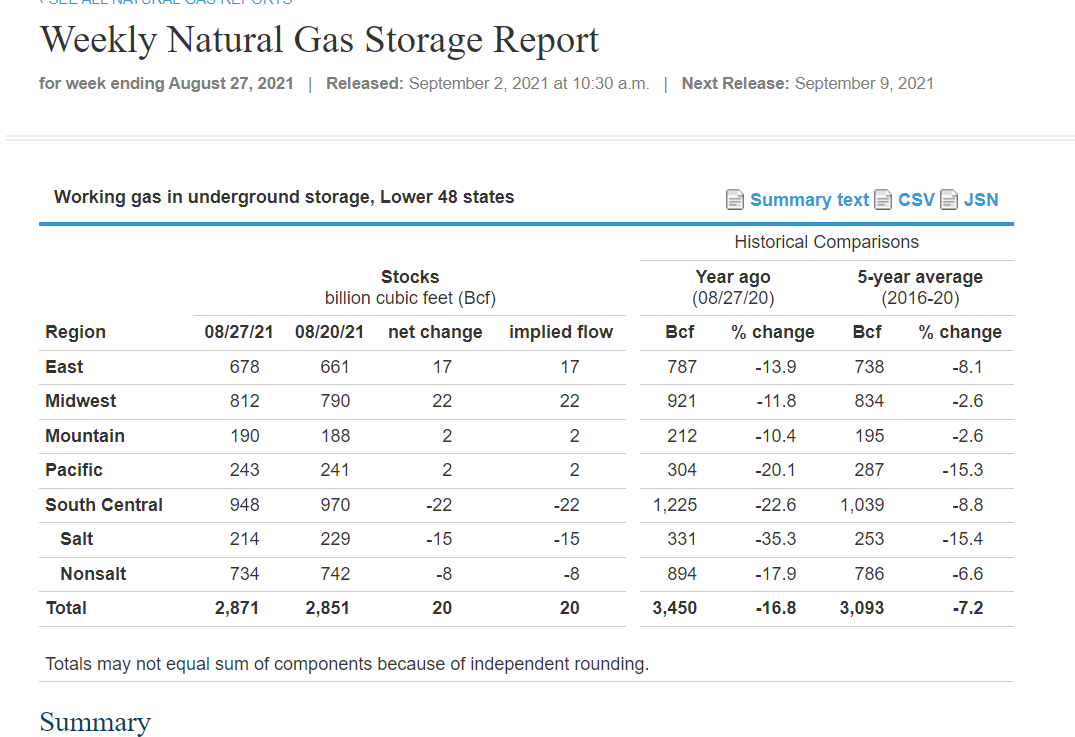
Natural gas prices continue to climb to fresh, nearly-three-year highs, rising 1.3% to $4.673/mmBtu after a weekly EIA storage report came in below both forecasts and averages. The US government agency says gas-in-storage rose by 20B cubic feet last week, versus forecasts in a WSJ survey for a 25-bcf injection and compared to the five-year average rise of 53 bcf. Total storage is now 2.871T cubic feet, a bullish 7% below the five-year average as winter withdrawal season starts to loom.
Previous natural gas thread:
NG Thread 8/26+
29 responses |
Started by MarkB - Aug. 26, 2021, 1:10 a.m.
https://www.marketforum.com/forum/topic/74223/
++++++++++++++++++++++++++++++++++++++++++++++++
Thanks Jim!
Definitively bullish.
https://www.investing.com/economic-calendar/natural-gas-storage-386
Latest Release Sep 02, 2021 Actual 20B Forecast 25B Previous 29B
| Release Date | Time | Actual | Forecast | Previous | |
|---|---|---|---|---|---|
| Sep 02, 2021 | 10:30 | 20B | 25B | 29B | |
| Aug 26, 2021 | 10:30 | 29B | 40B | 46B | |
| Aug 19, 2021 | 10:30 | 46B | 31B | 49B | |
| Aug 12, 2021 | 10:30 | 49B | 49B | 13B | |
| Aug 05, 2021 | 10:30 | 13B | 21B | 36B | |
| Jul 29, 2021 | 10:30 | 36B | 43B | 49B |
++++++++++++++++++++++++++++++
These were the temperatures for last week's EIA period, ending on Friday.
Temperatures were hot last week for much of the country except the Northwest.........so yes, the EIA report should be pretty bullish!

metmike: This is not a good time to be using CDD's to determine market prices with any confidence, since they are not extreme enough to overcome several other factors. September is usually not a great time to trade temperatures anyways in a normal year.
Joe Lund's comment from a short while ago. Joe is actually in the business of extracting natural gas with fracking on the Bakken, if I'm not mistaken.
This was his most recent comment in August:
https://www.marketforum.com/forum/topic/73381/#74138
Today's comment from Joe.
Re: US consumer better hope for a windy warm winter.
By joelund - Sept. 2, 2021, 10:44 a.m.
Couple of minutes before shift change.
Nat Gas Industry can't fill storage. 20 BCF build week ending 08/27.
Rigs available but labor a problem especially for frac crews.
This guy really needs an editor but does extensive research on all sources of energy.
https://twitter.com/CelsiusEnergyFM
+++++++++++++++++++++++++++
By MarkB - Sept. 2, 2021, 10:59 a.m.
joelund, thanks!!! Gonna have to keep up with this guy.
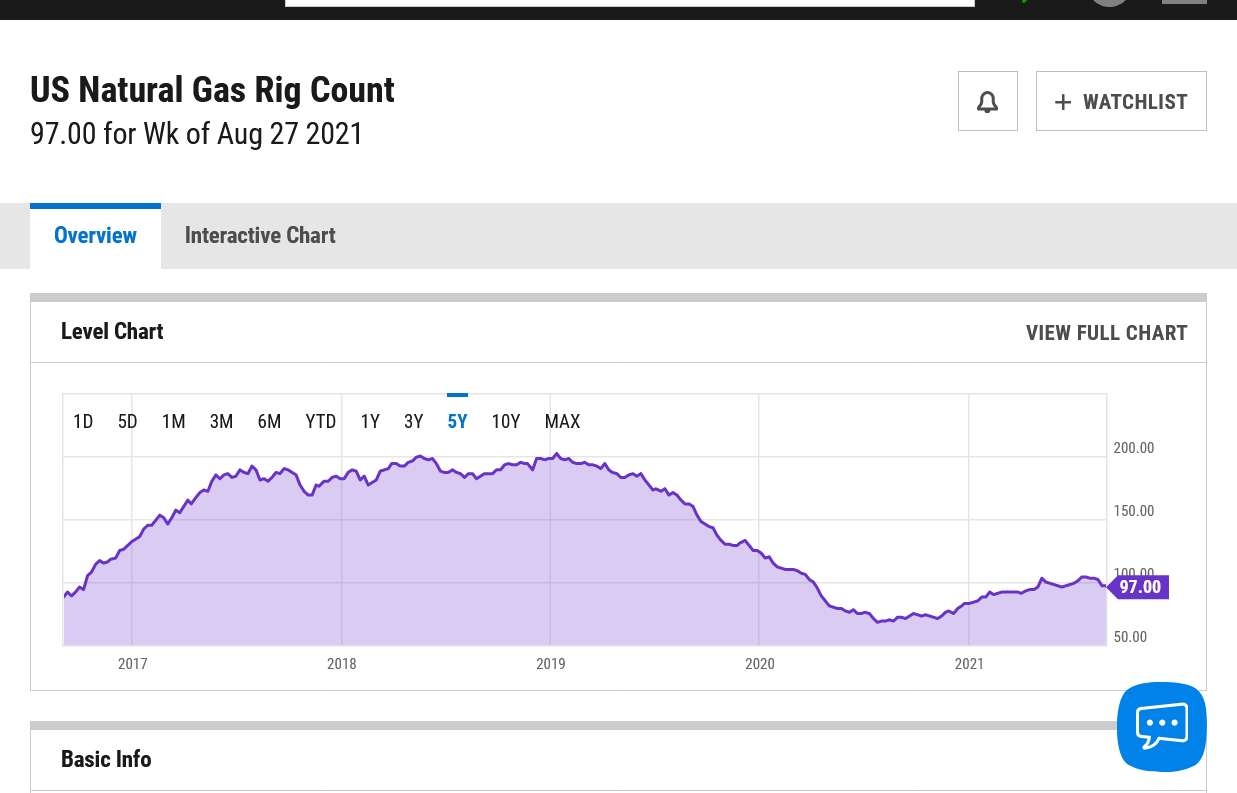
NG rig count has actually been dropping the last few weeks.
The low was 68 last July. However, the rig count is only half of what it was in 2018/19. It was already plunging BEFORE COVID hit.
https://ycharts.com/indicators/us_gas_rotary_rigs
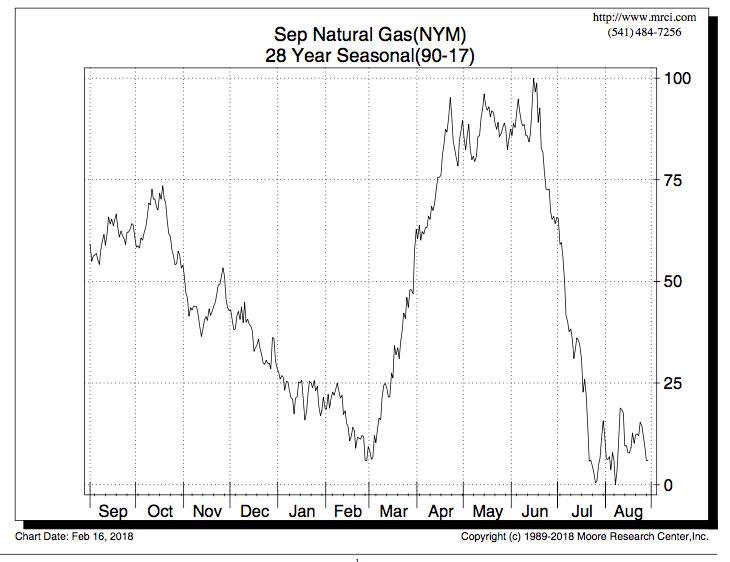
I'm not sure what all goes into a chart like this, certainly some things that don't add up in the real world to the price going from the highest of the year in mid June to the lowest price of the year a month later.............that almost never happens in the real market in any year.
However, a chart like this is useful because it shows the strong seasonal/historical tendencies.
July ng prices in 2021 were the complete opposite of the seasonal below.....because storage is getting tighter and tighter and most EIA reports have been BULLISH!
Instead of the weakest month of the year, like it often is historically, the very tight demand/supply balance and bullish EIA numbers(with storage below the 5 year average and NOT building fast enough) caused prices to spike much higher this Summer.
There is often a high in ng during the fall, around mid/late October. In past years, with very tight storage, I think we had some notable spikes higher around the November contract expiration.
If its cold early this Winter.......don't be short natural gas, regardless of the price......until the weather models show milder temps.
Today’s EIA report was solidly bullish. When I get time, I’m going to compare this to the two weeks this year with injections only in the teens to see if this one beats those on a CDD adjusted basis.
Thanks much Larry,
When you do your storage comparisons like this, it's always one that I save.
As a reminder for WxFollower storage data/stats fans, this was Larry's previous post on this:
https://www.marketforum.com/forum/topic/73381/#73476
This has been clearly telling us that ng prices up here are justified. A very cold first half of Winter and you won't be able to put a price tag on ng prices $10??
You’re welcome, Mike. I just looked and the +20 of the report released yesterday was not quite as bullish as those reports this year in the teens, which I have about 6 bcf more bullish. The +20 is tied with the prior week as well as a couple of others as 3rd most bullish of the late spring and summer.
If it has the strength to go to $10 it will be extremely volatile and we might see $1 swings getting there.
Thanks Larry and Jim!
From Thursday
September 2, 2021
Though long gone from the Gulf Coast, Hurricane Ida’s devastation continued across the eastern United States ahead of the Labor Day weekend, wiping out significant production and causing widespread power outages along the way. Supply’s slow expected recovery fueled bullish momentum across natural gas forward curves for the trading period ending Sept. 1, resulting in…
Friday Story of the Day from NGI:
Story of the day

In a market at the forefront of the energy transition, natural gas price signals in the western United States instead are incentivizing the construction of newbuild pipeline capacity, according to RBN Energy LLC. Markets west of the Permian Basin have struggled to consistently maintain adequate natural gas supplies for some time now, RBN analyst Jason…
metmike: The GFS was warmer and the Euro was slightly cooler overnight. Both have CDD's remaining above average the next 2 weeks.
Friday after the close:
Natural gas futures rallied for a fourth consecutive day, reaching a new 2021 high on Friday as the vast majority of Gulf of Mexico (GOM) production remained offline in the wake of Hurricane Ida and traders continued to mull supply/demand imbalance concerns. At A Glance: The prompt rallies four straight days GOM production weak in
metmike: Temperatures are usually not that important to ng prices in September. We have some heat coming up but not extreme in the high population areas.
If this were 15 years ago, the amount of production being lost from Ida in the GOM would have been much greater. Much of it has been replaced by fracking/land operations since then. However, with this being a bull market and storage deficits increasing and chances of reaching ample storage before Winter being near 0............. the impact of some minor changes will be amplified greatly.
Highlights
1.7 million b/d of oil output still offline: BSEE
2 Bcf/d of natural gas output also shut-in
Titan US Gulf platform appears 'intact': Equinor
Four days after Hurricane Ida slammed the Louisiana coast, output in the US Gulf of Mexico is inching up even though damaged road and transport infrastructure has delayed producers' ability to get out and inspect their platforms.
It's been quite the week in energy markets, as Hurricane Ida hit the Louisiana coast, causing damage, power outages and destruction to the regular supply of oil and other projects in and around the region.
The US Gulf Coast is built to deal with hurricanes like this, but each storm is unique, and what is impacted and for how long factors into how the oil industry reacts.
S&P Global Platts editors discuss storm damage, power outages and disruptions and how oil prices have reacted in the days following the storm.
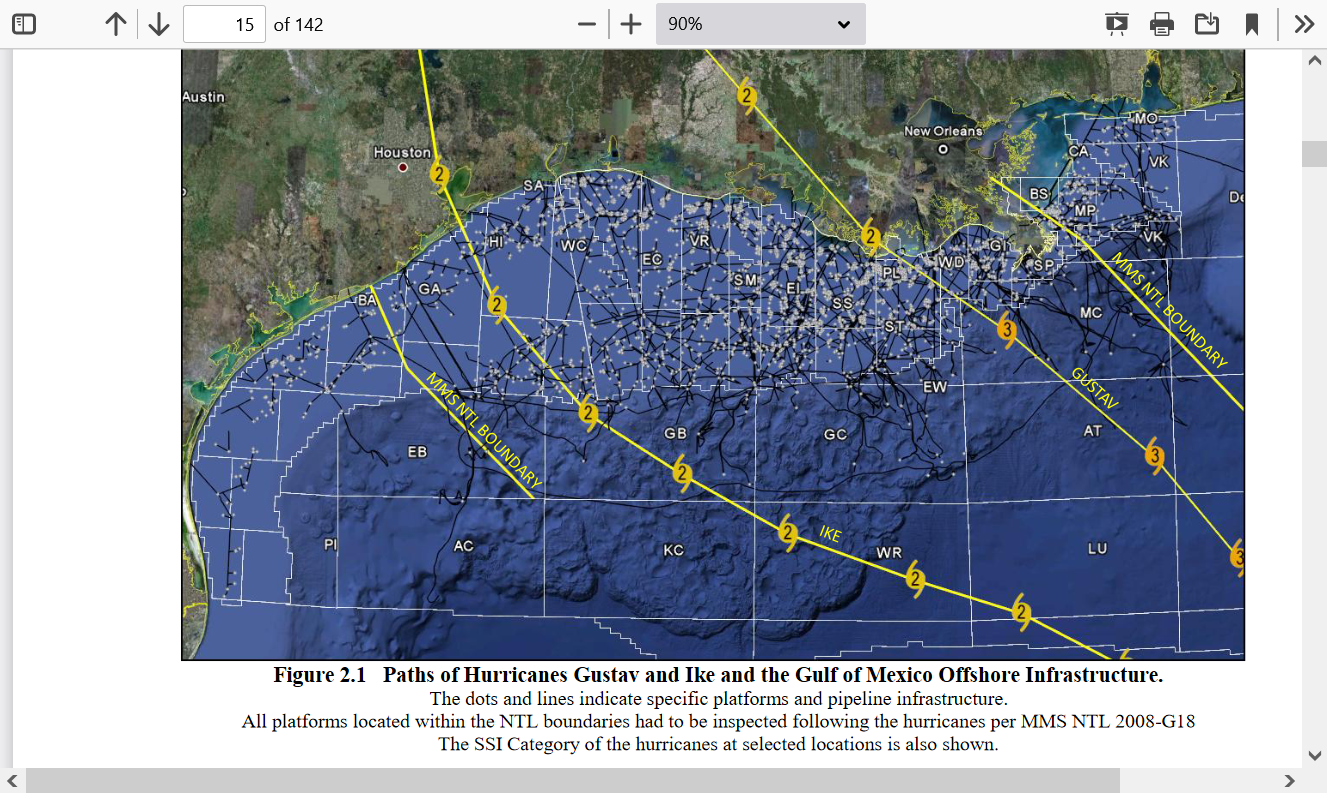
Who remembers the impact of Hurricane Ike in the GOM and the ng prices 13 years ago?
September 8, 2008
https://www.naturalgasintel.com/ike-the-spike-keeps-futures-bears-at-bay/
*16.6 million barrels of crude oil
*81.8 billion cubic feet of natural gas
*20.9 million barrels of refining (counting only plants completely shut)
*97.5 pct Gulf of Mexico oil output
*94.4 pct Gulf of Mexico gas output
*14 refineries shut, 21.6 pct of US capacity
*3 refineries representing 5.1 pct of US capacity at reduced rates
*Most Gulf Coast pipelines, ports and waterways shut
Comparing the Impacts of the 2005 and 2008 Hurricanes on U.S. Energy Infrastructure
Infrastructure Security and Energy Restoration
Office of Electricity Delivery and Energy Reliability
U.S. Department of Energy
February 2009
Hurricane risk to Offshore Oil and Gas Field Installations
https://www.infield.com/gom_hurricane_ike_gustav_risk_tracking.html
Hurricane Ike's predicted path through Offshore installations in the Gulf of Mexico

low res Gis map of the path of Hurricane Ike as predicted on 12/09/2008
Yellow 10 miles, Blue 20 Miles, Green 30 Miles
Hurricane Ike's predicted wind speed through Offshore installations in the Gulf of Mexico
Infield Systems Limited
ASSESSMENT OF DAMAGE AND FAILURE
MECHANISMS FOR OFFSHORE STRUCTURES AND
PIPELINES IN HURRICANES GUSTAV AND IKE FINAL REPORT February 2010
https://www.bsee.gov/sites/bsee.gov/files/tap-technical-assessment-program//642aa.pdf
After surging higher last week, natural gas futures pulled back in early trading Tuesday as analysts continued to mull ongoing impacts to both demand and supply from Hurricane Ida. The October Nymex contract was down 6.7 cents to $4.645/MMBtu as of 8:45 a.m. ET. Looking at the latest supply and demand data points early Tuesday,…
metmike: Extreme volatility, not based on weather at the moment(that I can tell)
Wednesday addition:
metmike: The extreme volatility continues, focusing on news related to production NOT demand from weather.
Ohhhh....I'm having a great day! I'm trading like it's going to $10.
Tomorrow's EIA report could set a direction for prices for weeks to come.
For sure it could make Thursday a very wild trading day!
These were the 7 day temperatures from last week that will go into the EIA report tomorrow:
Hot in the S.Plains but COOL in the East. Not really a bullish temperature configuration(actually, more bearish) but there is way more going on right now than that.

metmike: For sure we have above CDD's still in the forecast but we had that yesterday too when the market spiked lower.
Forecast is for +40, for the week after Ida. I'm kinda doubting that.
Thanks Mark,
Where are you getting the week before Ida?
The EIA reporting period is from Aug 27 thru Sep. 3rd.
Ida hit LA on Aug 29 and platforms were already evacuated several days before that, so the entire period would have had much of the GOM production shut down from Ida.
https://en.wikipedia.org/wiki/Hurricane_Ida
Hurricane Ida southeast of the Louisiana coast on August 29
Sorry about that. Miscalculated.
I don't know a thing about trading NG. Do the funds have large positions in NG? TIA
Yes cutworm, they often have a huge position but I have no idea what it is or what the total open interest is.
I've not seen stats on that in a long time...........
But I will find out for you right now since its such a great question.
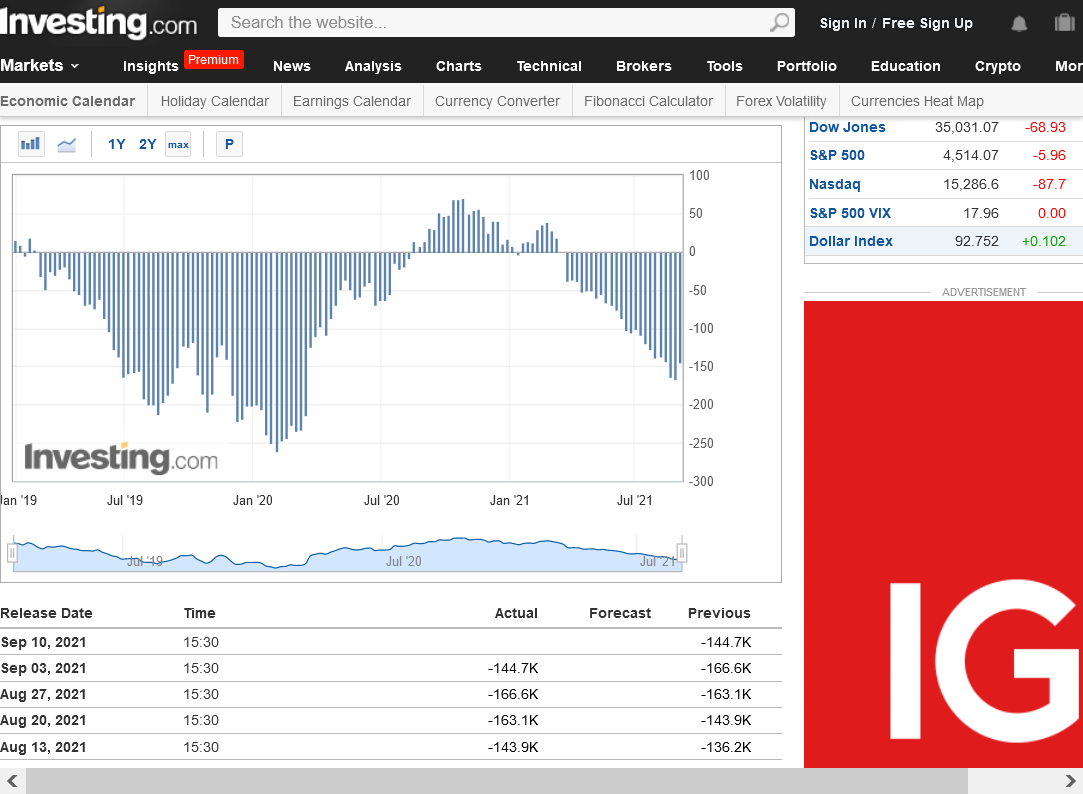
Funds have a pretty big short position on right now...........and are taking it on the chin!!!
They've been adding to the position all year, after starting from a net long position.
CFTC Natural Gas speculative net positions
https://www.investing.com/economic-calendar/cftc-natural-gas-speculative-positions-1820
Thursday early morning:
Still couldn't overcome the low storage and lack of production in the GOM.
for week ending September 3, 2021 | Released: September 9, 2021 at 10:30 a.m. | Next Release: September 16, 2021
Bigger than the estimate!
| Working gas in underground storage, Lower 48 states Summary text CSV JSN | |||||||||||||||||||||||||
|---|---|---|---|---|---|---|---|---|---|---|---|---|---|---|---|---|---|---|---|---|---|---|---|---|---|
| Historical Comparisons | |||||||||||||||||||||||||
| Stocks billion cubic feet (Bcf) | Year ago (09/03/20) | 5-year average (2016-20) | |||||||||||||||||||||||
| Region | 09/03/21 | 08/27/21 | net change | implied flow | Bcf | % change | Bcf | % change | |||||||||||||||||
| East | 703 | 678 | 25 | 25 | 803 | -12.5 | 760 | -7.5 | |||||||||||||||||
| Midwest | 842 | 812 | 30 | 30 | 949 | -11.3 | 865 | -2.7 | |||||||||||||||||
| Mountain | 191 | 190 | 1 | 1 | 215 | -11.2 | 198 | -3.5 | |||||||||||||||||
| Pacific | 243 | 243 | 0 | 0 | 307 | -20.8 | 288 | -15.6 | |||||||||||||||||
| South Central | 943 | 948 | -5 | -5 | 1,240 | -24.0 | 1,046 | -9.8 | |||||||||||||||||
| Salt | 208 | 214 | -6 | -6 | 334 | -37.7 | 253 | -17.8 | |||||||||||||||||
| Nonsalt | 735 | 734 | 1 | 1 | 906 | -18.9 | 792 | -7.2 | |||||||||||||||||
| Total | 2,923 | 2,871 | 52 | 52 | 3,515 | -16.8 | 3,158 | -7.4 | |||||||||||||||||
Totals may not equal sum of components because of independent rounding. | |||||||||||||||||||||||||
Working gas in storage was 2,923 Bcf as of Friday, September 3, 2021, according to EIA estimates. This represents a net increase of 52 Bcf from the previous week. Stocks were 592 Bcf less than last year at this time and 235 Bcf below the five-year average of 3,158 Bcf. At 2,923 Bcf, total working gas is within the five-year historical range.
For information on sampling error in this report, see Estimated Measures of Sampling Variability table below.

Note: The shaded area indicates the range between the historical minimum and maximum values for the weekly series from 2016 through 2020. The dashed vertical lines indicate current and year-ago weekly periods.
https://www.investing.com/economic-calendar/natural-gas-storage-386
Latest Release Sep 09, 2021 Actual 52B Forecast 40B Previous 20B
| Release Date | Time | Actual | Forecast | Previous | |
|---|---|---|---|---|---|
| Sep 16, 2021 | 10:30 | 52B | |||
| Sep 09, 2021 | 10:30 | 52B | 40B | 20B | |
| Sep 02, 2021 | 10:30 | 20B | 25B | 29B | |
| Aug 26, 2021 | 10:30 | 29B | 40B | 46B | |
| Aug 19, 2021 | 10:30 | 46B | 31B | 49B | |
| Aug 12, 2021 | 10:30 | 49B | 49B | 13B |
September 9, 2021
metmike: You can say that again!!