
Happy 96th Birthday Dad!
Most maps below are constantly updated
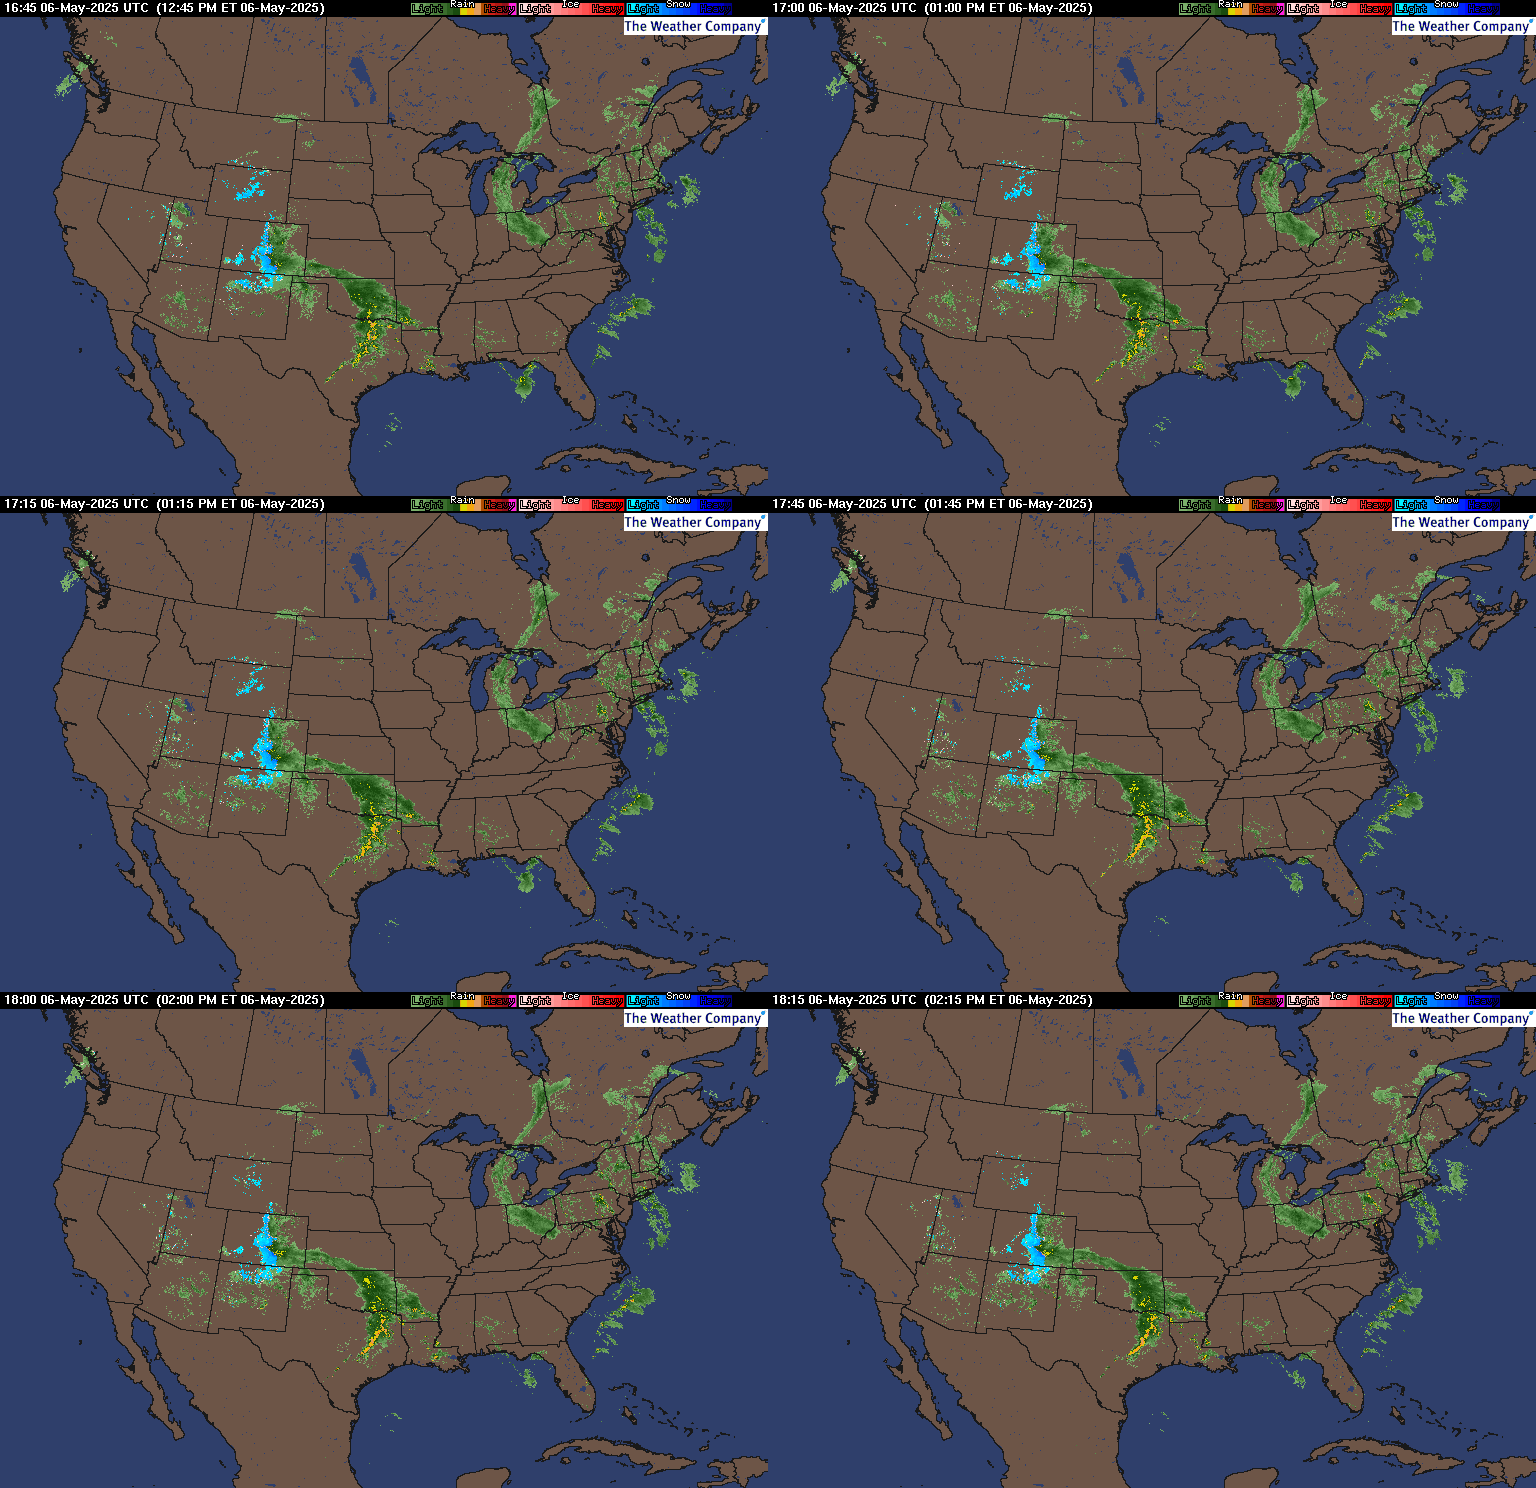
Latest National radar images
https://www.wunderground.com/maps/radar/current
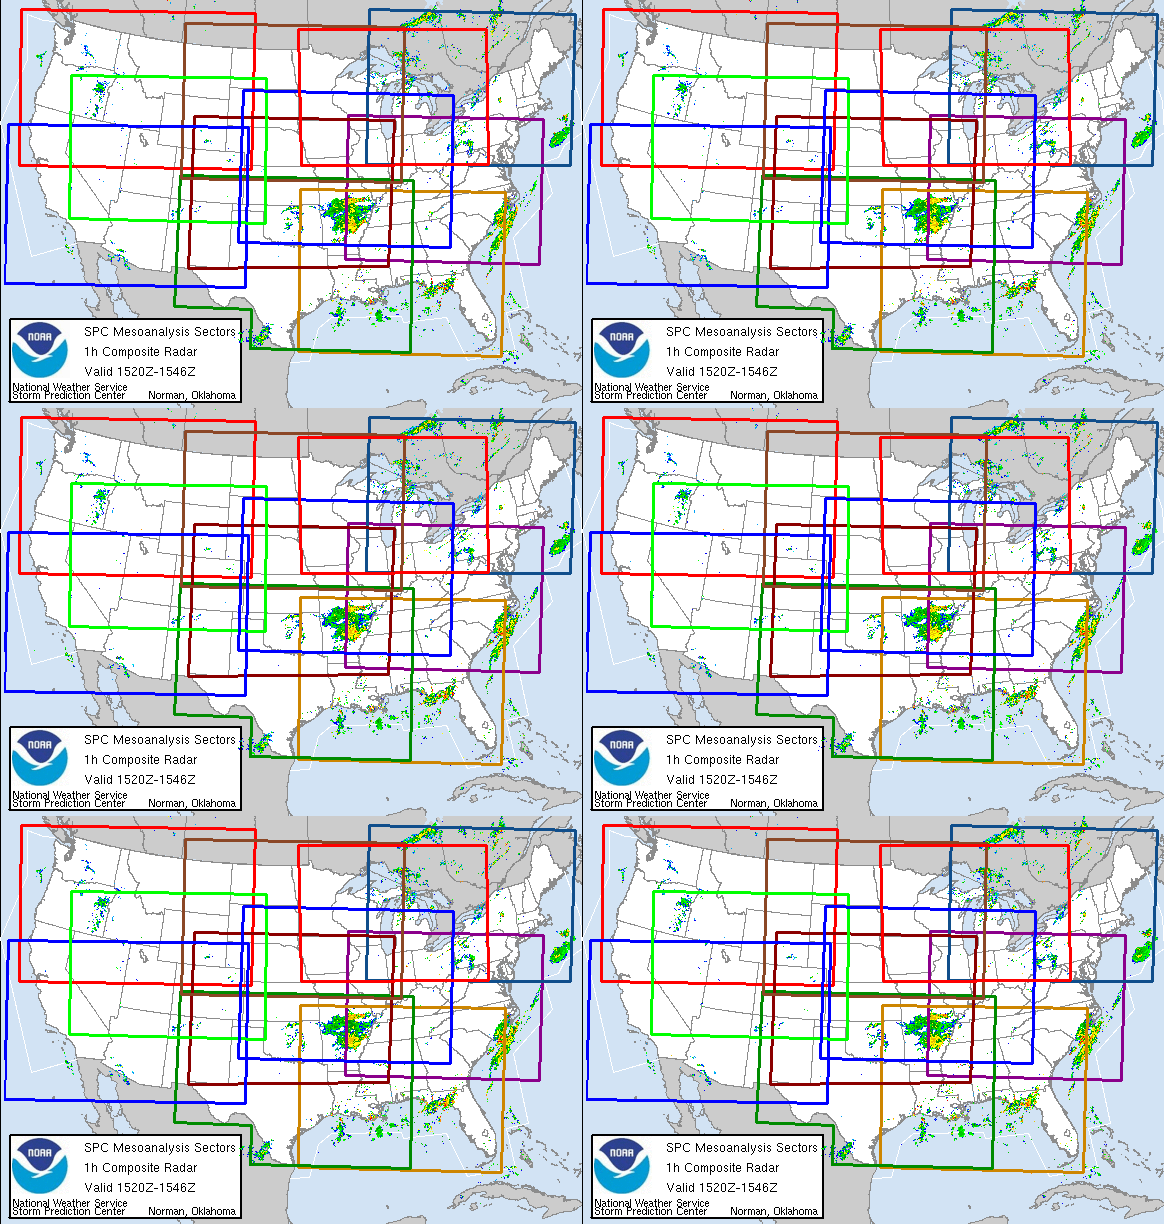
This link below provides some great data. Hit the center of the box below for the area that you want, then go to observation on the far left, then surface observations to get constantly updated surface observations.
 |
Current Conditions below updated every few minutes.
https://www.spc.noaa.gov/exper/mesoanalysis/new/viewsector.php?sector=13#


https://www.spc.noaa.gov/exper/mesoanalysis/new/viewsector.php?sector=20


Surface moisture in the air:

The latest precip forecasts are below.
Day 1 below:
http://www.wpc.ncep.noaa.gov/qpf/fill_94qwbg.gif?1526306199054

Day 2 below:
http://www.wpc.ncep.noaa.gov/qpf/fill_98qwbg.gif?1528293750112

Day 3 below:
http://www.wpc.ncep.noaa.gov/qpf/fill_99qwbg.gif?1528293842764

Days 4-5 below:
http://www.wpc.ncep.noaa.gov/qpf/95ep48iwbg_fill.gif?1526306162

Days 6-7 below:
http://www.wpc.ncep.noaa.gov/qpf/97ep48iwbg_fill.gif?1526306162

7 Day Total precipitation below:
http://www.wpc.ncep.noaa.govcdx /qpf/p168i.gif?1530796126

Excessive rain threat.
https://www.wpc.ncep.noaa.gov/qpf/excess_rain.shtml
Day 1 Threat Area in Text Format
Current Day 2 Forecast |
Severe Storm Risk.
https://www.spc.noaa.gov/products/outlook/
Current Day 1 Outlook | |
Current Day 2 Outlook | |
Current Day 3 Outlook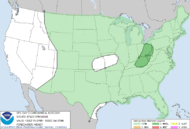 | |
Current Day 4-8 Outlook |
Extended weather.
https://www.cpc.ncep.noaa.gov/products/predictions/610day/ | |||||||||
| 6 to 10 day outlooks | |||||||||
| Click below for information about how to read 6-10 day outlook maps Temperature Precipitation | |||||||||
| Click below for archives of past outlooks (data & graphics), historical analogs to todays forecast, and other formats of the 6-10 day outlooks ArchivesAnalogsLines-Only FormatGIS Data | |||||||||
Temperature Probability | |||||||||
Precipitation Probability | |||||||||
Soilmoisture anomaly:
These maps sometimes take a day to catch up to incorporate the latest data(the bottom map is only updated once a week).
https://www.cpc.ncep.noaa.gov/products/Soilmst_Monitoring/US/Soilmst/Soilmst.shtml#


U.S. Drought Monitor
https://droughtmonitor.unl.edu/Maps/CompareTwoWeeks.aspx
Updated November 16, 2021

Just updated 30 day outlook for October.
Warm in much of the country!
https://www.cpc.ncep.noaa.gov/products/predictions/30day/


Just updated early Winter/cold season Forecast.
Mild in much of the country, possibly cold along the northern tier.


Mike - a note about the election - I'm still trying to force my mind to work on it (G). It is a struggle.
I am enjoying your wx posts again. First - I am not trained at all in this, so what I write is just observations and guesses.
I've watched the earth wind map for quite some time now.
https://earth.nullschool.net/#current/wind/isobaric/1000hPa/orthographic
The controls when you click on "earth" in the bottom left corner are fascinating. My impression, after studying this for some time, is that we seem to have entered a period where the systems lack the "order" they previously had - often highs and lows alternating with the jet stream setting up waves around the northern hemisphere in an orderly fashion. It seems to me - and i'm interested in your comments - that what is lacking currently is that order and the tendency for that orderly pattern to move west to east. That movement normally makes for the alternating wet/dry cycle in ag areas like the corn belt. From what i know about chaotic systems, this is not unexpected - I've seen it in markets a lot. Do the conditions we see now suggest to you that this must have been what were seen in the 30s?
On a very different subject - are we seeing something like this in our country - or, more correctly, in the western countries?
For a very long time after studying markets for decades now, I have said that everything is born with the seeds of its own destruction. Are we seeing this unfolding right in front of our eyes in not only weather, but in other areas too? Speculation, I know, but could the chaotic behavior of the weather combine with that of the politics to make for some extremely difficult times ahead?
This started out as a wx comment - now I wonder if it belongs more in the NTR section . . .
96 years old. That’s awesome. Happy Birthday Mike’s Dad!
cfdr,
I think that almost all the extreme, unusual, unprecedented and historical weather that we've had recently is just the same extreme, unusual, NOT so unprecedented, historical weather that has always defined our weather patterns.
The biggest reason for it to be otherwise is............perception.
That was a wonderful map that you showed me. What did it look like 20 years ago?
Nobody knows because it didn't exist then. I can tell you from watching the weather almost all day long for much of the last 39 years, that it wouldn't look much different.
The average person that knows nothing about weather(you know quite a bit, so I don't mean you) can get 100 times more weather stuff on the internet than I could as a professional meterologist, with a satellite dish on my roof getting all the weather back 25 years ago.
And we have the media. OMG. Everything is reported just minutes after it happens but they exaggerate so much of it.
I watch ABC Nightly News on many nights(the tv station that I was chief meteorologist at for 11 years 1982-1993).
They often lead with weather that is not all that extreme and frequently have a story on the current weather, going to their meteorologist, when it's just a bunch of strong thunderstorms and not an outbreak, or a bunch of 2 inch rains, or a few inches of snow that they will claim "is threatening 63 million Americans".
The exact same weather before the fake climate crisis would NEVER justify making one of their top stories.
It appears to be much worse because that exact type of weather was happening since humans have been measuring it but never got reported out the wazoo like it has since the fake climate crisis has brought it out.
As a weather nut, I love seeing stories about the weather but the way they describe it makes me cringe.
SENSATIONALIZATION SELLS!
I may have started my career 39 years ago, but I have access to all the weather records going back to...........when we started recording the weather. I refer back to them for various extreme or similar events or to look for analogs/similarities hundreds of times every year.
Those reporting and exaggerating extreme weather in todays world just do not do this.
Would this make an eye catching headline "Today's heavy rain event has happened X times before in the last 150 years"
Is this one better:
"Heaviest rain in the last century!" (for that location). or even "Heaviest this century" And maybe the same type of rain event has happened a dozen times in the last 25 years but in other places in the US or even 100+ times in the world.........but the headlines use "unprecedented" and "historic" in a way to mislead you to think that it's NEVER happened before........just because it didn't happen before just like that in that one location.
And our accurate weather records don't go back that far anyway. Something may not have happened before in the last 130 years but it likely happened several times before in the last 1,300 years and maybe numerous times the last 13,000 years.
People think that the weather over the past 130 years of measured weather is supposed to define the extreme range of weather that ever happened.
The weather is NOT more extreme and in fact, because the temperatures have warmed the most in the coldest places during the coldest times of year, the weather is notably LESS extreme in some realms. Definately less extreme cold and less violent tornadoes but MORE extreme heavy rains(the atmosphere can hold 7% more rain) and a slight uptick in heat.
Thanks for the birthday wish to Dad, Jim.
Dad is closer to 100 than to 90!
Those still living in his generation have seen the most advancements in the world, just during his lifetime than all the advancements combined in human history before him.
Reasonstobethankful here in 2021!(and 2022, 23, 24+)
https://www.marketforum.com/forum/topic/45623/
He still plays skillful chess and we can do it via a video screen, where I see him and his board at his assisted living facility and tell him what moves to make for me on his chess board.
His house didn't even have a telephone growing up in the inner city of Detroit(until his sister, 6 years older than him got one in high school).
He never met his dad.........but became a gifted industrial engineer for Ford Motor Company for 39 years after serving in WW2, then graduating from the University of Detroit.
Then he vowed to be the best Dad the world has ever known to his 6 children because he never had one.
He accomplished that too and is still showing us how to live life, not just as our Dad but the oldest person that most of us have ever known personally!
Most of the maps above are constantly updated to the latest!
The PNA index is pretty low(-2). Mainly just a spike lower than back close to 0:
https://www.cpc.ncep.noaa.gov/products/precip/CWlink/pna/pna.shtml

Nothing like the historic jump to the highest ever almost 2 month ago but still very impressive for September!
New record PNA of 4.00 obliterates old record on 8/6/21! (records back to 1950) 22 responses |
Started by WxFollower - Aug. 1, 2021, 1:25 p.m.
https://www.marketforum.com/forum/topic/72981/
Remaining mild...........turning wetter.
Just updated weeks 3-4 forecast that goes out just past the first HALF of November.......still very mild northern half(where most of the HDD's occur at this time of year).
https://www.cpc.ncep.noaa.gov/products/predictions/WK34/


Cold temps in the West will shift east during week 2 but moderate to around average.
Warmer forecast in week 2 today and turning dry then.
Rains the next 24 hours in KS will be appreciated by the WW crop.
12z week 2 models GFS Ensemble below, came in +4 HDD's/colder and gave natural gas a lift higher.
18z also kept that colder solution but the reality is its LESS MILD, not cold.

The last 12z GFS was a whopping -8 HDD's cooler!

The models are having huge shifts in HDD's from run to run because of the handling of a big upper level low in Southeast Canada associated with a strongly negative --NAO.

In addition, a strongly positive +PNA

This encourages air masses in the West and in Southern Canada to move from north to south into the US. How much cold there will be from the source region(that could be fairly mild) and how amplified the pattern will be has been changing drastically each run.
Looks like the Euro is going to come in around -7 HDD's too.
It finished and the 12z run was actually -8 HDD's vs the previous 0z run!
The changes never represented a pattern change to colder but, instead just how much cold was going to surge south in week 2 with a temporary break in the mild pattern............that will resume right after it.
Little cold snap, especially in the northern tier of states later this week, shifting to the Northeastern states early next week........then departing, with a resumption of very mild temperatures. Most of the maps above are constantly updated.
The worded description below was made on Nov. 14th but the charts are updated daily!
For the first time this month, the week 2 pattern is evolving more strongly in a way that suggests a potential pattern change that is capable of unloading more serious cold in sustained fashion.
The AO is really plunging to solidly negative at the end of the period. The NAO stays negative!
https://www.cpc.ncep.noaa.gov/products/precip/CWlink/daily_ao_index/ao.shtml

https://www.cpc.ncep.noaa.gov/products/precip/CWlink/pna/nao.shtml

++++++++++++++++++++++++++++++++++++++++++++
https://www.psl.noaa.gov/map/images/ens/t850anom_nh_alltimes.html
This is the 500mb anomaly below at the end of the period from the GFS ensemble mean. The center of the positive height anomaly in Northern Canada is the foundation for the potential new pattern turning colder. If it grows and heights drop in the US..........viola.......we will have an efficient north to south air mass delivery mechanism!
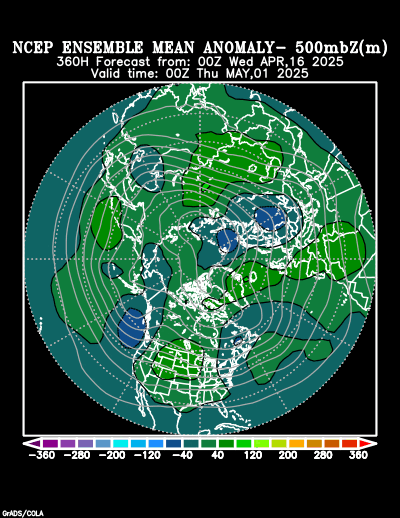
This will not show up in Tuesdays 8-14 day outlook! Too early for that.
Stilll seeing increasing potential for a turn to a colder weather regime in early November with the key reasoning anchoring the forecast philosophy stated on the precious page above this one.
No precip for the Southern Plains the next 2 weeks with soil moisture deficits increasing and less favorable for the HRW crop in that location that needs good moisture for robust development (to better withstand Winter kill threats) before going dormant ahead of Winter.
Soil moisture metrics:
https://www.marketforum.com/forum/topic/75004/#75014
Precip forecasts week 1:
https://www.marketforum.com/forum/topic/75004/#75007
Precip forecasts week 2:
https://www.marketforum.com/forum/topic/75004/#75013
Just updated November forecast:
https://www.cpc.ncep.noaa.gov/products/predictions/30day/


Just updated week 3-4 NWS outlook. Very mild eastern 1/2! This product has very low skill.
https://www.cpc.ncep.noaa.gov/products/predictions/WK34/


Decent rain event on the doorstep of eastern parts of HRW belt.....much of the Plains.
Happy Halloween!
Chilly and mostly dry this week.
Moderating in week 2 (especially mild northcentral) and staying dry.
Some big help with the drought in the Northwest coming up!
https://www.marketforum.com/forum/topic/75004/#75007
https://www.marketforum.com/forum/topic/75004/#75013
Total rains for 2 weeks from the GFS ensemble
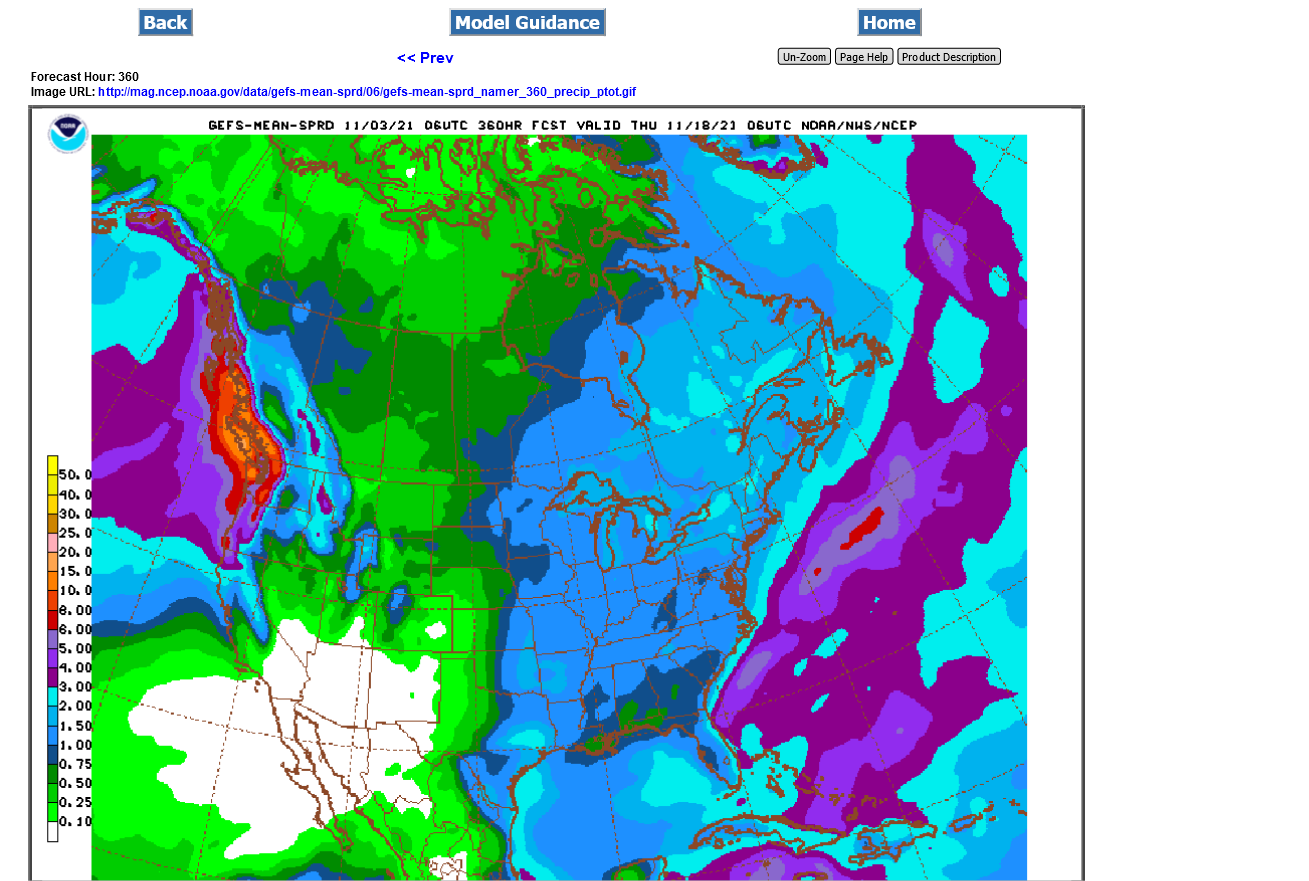
6-10/8-14 day was chilly in the Midwest/East:
https://www.marketforum.com/forum/topic/75004/#75013
Weeks 3-4 are very mild....except far NorthCentral.
With a -AO and -NAO, the cold could push farther south than this.


The analysis here was made on Nov. 12.
The actual indices below that .....get updated every day and whatever day it is that you read this, is a later date than the analysis.
Nov 12: There is enormous spread with some actually a bit positive and others, especially AO near the lowest possible. But the -NAO and especially the -AO suggest the latest colder late in week 2 European model has the best solution.
Nov 19: AO and NAO back near 0 at the end of 2 weeks......reduced threat for extreme cold in December.
https://www.cpc.ncep.noaa.gov/products/precip/CWlink/daily_ao_index/ao.shtml

https://www.cpc.ncep.noaa.gov/products/precip/CWlink/pna/nao.shtml

https://www.cpc.ncep.noaa.gov/products/precip/CWlink/pna/pna.shtml

The Euro is cold in week 2, the GFS pretty mild.
This is the GFS 500 mb anomaly map at 15 days. Chilly along the East Coast. Mild elsewhere. The EE has a MUCH deeper trough in the Eastern 1/3rd of the US.

Lastest weather comments on ng page:
Week 2 pattern and indices continue the moderation in temperatures!
Lower HDD's along with that.
https://www.marketforum.com/forum/topic/75004/#76425