
Chew 'em up boys!! I think some others missed out on the report coming out early. Waiting for a short opportunity.
Thanks Mark,
When posters start a new thread, after the previous one needs miles of scrolling to get to the last post.......I know they're keeping up! Wonderful.
Previous thread:
NG up today due to a deadcat bounce. It almost had to do that after the recent days of drops. I don't care what news sites say. They'll guess and say this and that and not be consistent. Wx is mainly flat with some warmer and some colder. We already know the market doesn't care about small changes and needs the Siberian Express late in November to really go up (sarcasm).
Models were a bit colder to me overnight Larry.
Also the NAO and AO are more negative/potentially colder but I agrtee, after crashing $10,000/contract, in just a week it was way overdue for a bounce.
https://www.investing.com/economic-calendar/natural-gas-storage-386
a bit BULLISH!
U.S. Natural Gas Storage
Latest Release Nov 10, 2021 Actual 7B Forecast 10B Previous 63B
| Release Date | Time | Actual | Forecast | Previous | |
|---|---|---|---|---|---|
| Nov 10, 2021 | 12:00 | 7B | 10B | 63B | |
| Nov 04, 2021 | 09:30 | 63B | 63B | 87B | |
| Oct 28, 2021 | 09:30 | 87B | 86B | 92B | |
| Oct 21, 2021 | 09:30 | 92B | 90B | 81B | |
| Oct 14, 2021 | 09:30 | 81B | 94B | 118B | |
| Oct 07, 2021 | 09:30 | 118B | 105B | 88B |
for week ending November 5, 2021 | Released: November 10, 2021 at 12:00 p.m. | Next Release: November 18, 2021
https://ir.eia.gov/ngs/ngs.html
| Working gas in underground storage, Lower 48 states Summary text CSV JSN | |||||||||||||||||||||||||
|---|---|---|---|---|---|---|---|---|---|---|---|---|---|---|---|---|---|---|---|---|---|---|---|---|---|
| Historical Comparisons | |||||||||||||||||||||||||
| Stocks billion cubic feet (Bcf) | Year ago (11/05/20) | 5-year average (2016-20) | |||||||||||||||||||||||
| Region | 11/05/21 | 10/29/21 | net change | implied flow | Bcf | % change | Bcf | % change | |||||||||||||||||
| East | 897 | 899 | -2 | -2 | 943 | -4.9 | 915 | -2.0 | |||||||||||||||||
| Midwest | 1,075 | 1,071 | 4 | 4 | 1,126 | -4.5 | 1,096 | -1.9 | |||||||||||||||||
| Mountain | 213 | 213 | 0 | 0 | 243 | -12.3 | 222 | -4.1 | |||||||||||||||||
| Pacific | 258 | 256 | 2 | 2 | 322 | -19.9 | 304 | -15.1 | |||||||||||||||||
| South Central | 1,175 | 1,172 | 3 | 3 | 1,293 | -9.1 | 1,201 | -2.2 | |||||||||||||||||
| Salt | 324 | 320 | 4 | 4 | 345 | -6.1 | 328 | -1.2 | |||||||||||||||||
| Nonsalt | 850 | 852 | -2 | -2 | 948 | -10.3 | 873 | -2.6 | |||||||||||||||||
| Total | 3,618 | 3,611 | 7 | 7 | 3,926 | -7.8 | 3,737 | -3.2 | |||||||||||||||||
Totals may not equal sum of components because of independent rounding. | |||||||||||||||||||||||||
Working gas in storage was 3,618 Bcf as of Friday, November 5, 2021, according to EIA estimates. This represents a net increase of 7 Bcf from the previous week. Stocks were 308 Bcf less than last year at this time and 119 Bcf below the five-year average of 3,737 Bcf. At 3,618 Bcf, total working gas is within the five-year historical range.
For information on sampling error in this report, see Estimated Measures of Sampling Variability table below.

Note: The shaded area indicates the range between the historical minimum and maximum values for the weekly series from 2016 through 2020. The dashed vertical lines indicate current and year-ago weekly periods.
I agree that the 0Z EE and 6z GEFS were slightly colder vs prior runs. But remember what's in the prior thread: the market doesn't care about little changes/a few HDDs here and there. They haven't really cared much. They have to see extreme cold being modeled/forecasted in order for prices to rise (sarcasm). Well, that's what the so called news said, right?
Pet peeve: inconsistent "news". One day it is one made up thing. The next day it is a totally different made up thing.
And we can guess that it may be this model today or that model yesterday. But let's be honest: the market has been very inconsistent with regard to how it does or doesn't react to models/forecasts.
the chart resembles a crooked H&S top.
Maybe, a pull-back to the neckline, or quite possibly above that line
(last week's bounce was a bit more than a Fibonacci retracement)
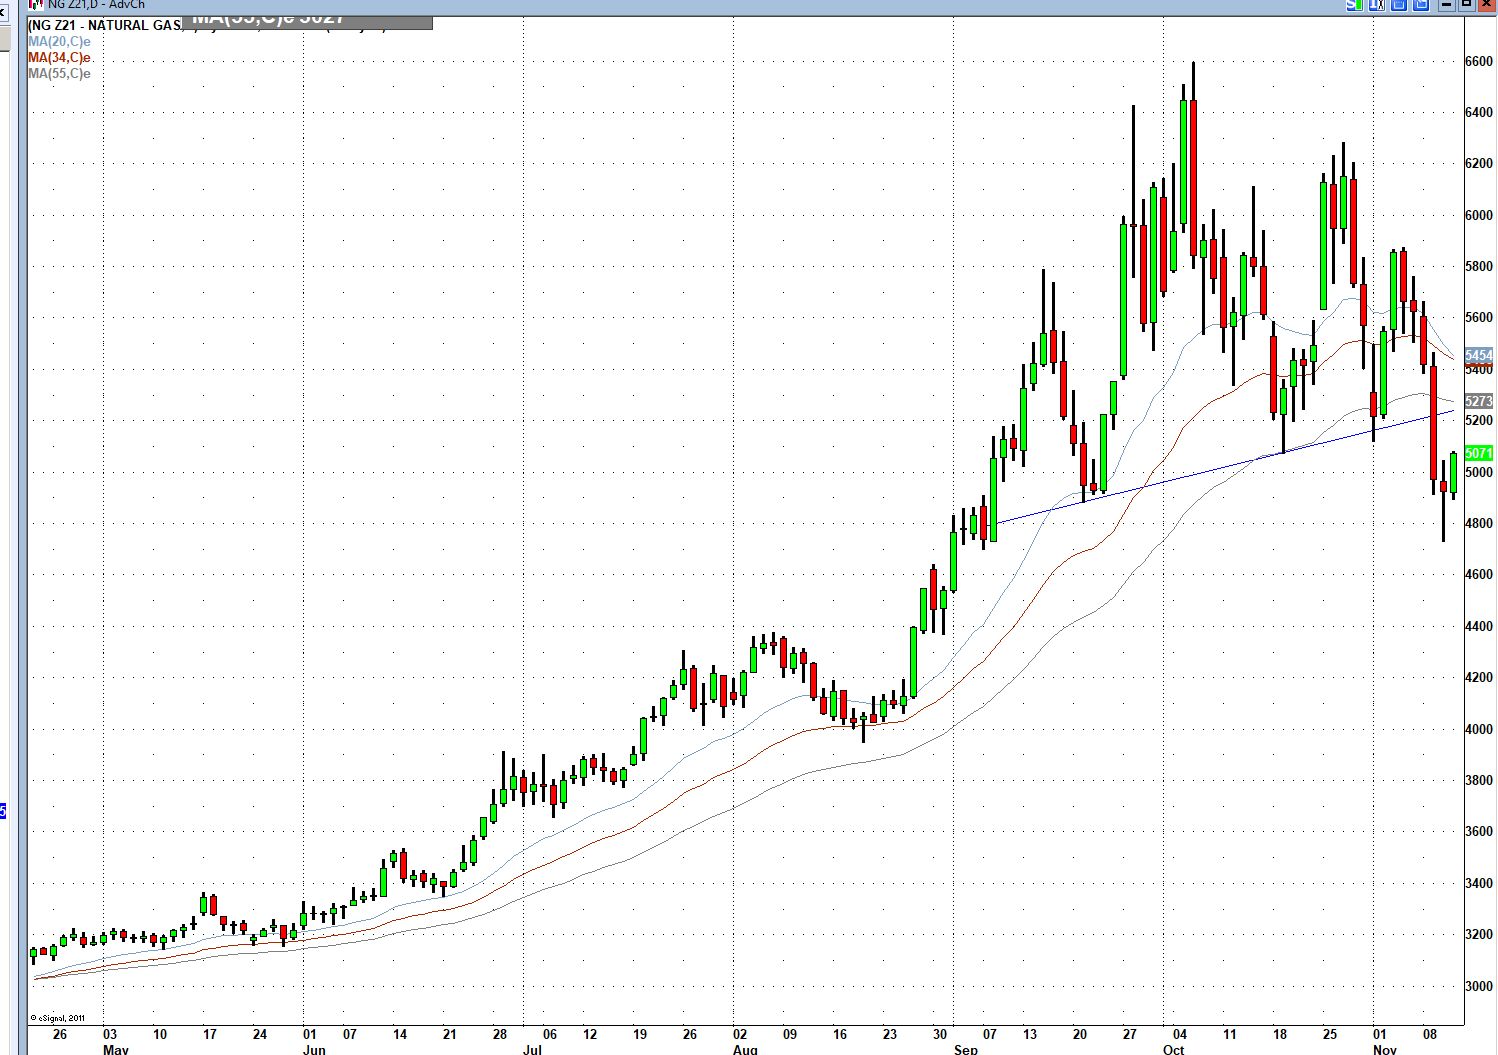
Exactly Larry but you will note that the AO and NAO are more negative and colder today and that is exactly what plays into the NON HDD element and POTENTIAL pattern change(speculative) that will make a bigger difference than the spikey, very brief responses to HDD changes on individual models that last for an hour or so.
Do you agree that these indices are more negative/colder today, especially the AO?

The NAO yesterday was closer to 0 but today, has shifted to a definite negative bias in tandem with the pattern change.

I agree the market was NOT trading weather on Tuesday but showed you ng prices crashing some 12% in Europe that day.
For sure, the only reason that we're up this high in the US is because of record high ng prices in Europe.
We were soaring higher in October and previously because of that fact, so on days when those prices crash lower, its inevitable for our prices to follow.
Do you agree with this Larry?
https://www.marketforum.com/forum/topic/76792/#77471
This last run of the 12z GFS ENS has come out even colder than the previous 6z run that was a whopping +7 HDD vs the previous one.
Do you agree?
edit: the run finished +4 HDDs vs the previous and +11 HDD's vs the one before that.
What seems to be happening is not an amplification of a ridge west/trough east couplet/pattern that we usually see with a pattern change to colder but instead, more of the main jet stream, still maintaining a west to east, zonal look but shifting farther and farther south and the colder air seeping in more and more that way(even greater than the normal seasonal shift south of the jet stream).
What do you think?
I'm not saying we're in a new uptrend or that the bottom is in..........just reporting the data, maps and pattern as objectively as possible.
In analyzing further, I just noticed something new also (for me to notice).
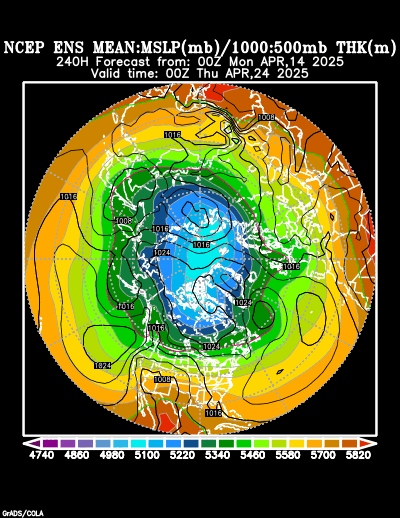
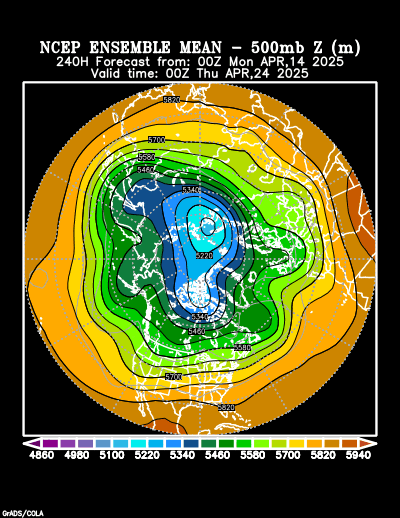
The flow is a cross polar flow that is transporting frigid air from Siberian across Canada down to the US border.
Any cold fronts that make it into the US, will come from a potentially very cold source region(which will be mostly felt in the NorthCentral states.
Look at the blues below, coming from Siberia and being dumped into all of Canada.
Despite this, the jet stream and more zonal flow in the US will be trying to blow mild air from the west to the east which will only allow very shallow penetration of this cold..........but it's right there on our doorstep, ready to dump in.
Surface level below.
Steering currents below.......18,000+ feet/3.5 miles up.
Mike, this is great wx tradingdiscussion!
I agree that the 12Z GEFS is a good bit colder than the already colder 6Z and that the AO/NAO are a bit more negative today. But they're still only slightly negative in the means with no big dips yet. And there are still no major cold plunges on the ensembles that the market needs to see per the news.
The market is inconsistent. There are many other factors also involved. We can hindsight it all we want and say this model was colder thus causing a rise or this one was warmer thus causing a drop, which would make sense to occur. But to profit, we need good foresight to know when the market will do these things and that has been tough to do in an inconsistent market recently.
I agree completely, especially on this being a great discussion compared to some in the NTR section right now.
All the data above, except the just out 12z run came out awhile ago. All the maps came out from the runs of 12 hours ago.
However, to agree with your points.
After the market behaved the way that it did earlier this week, nosediving lower by massive amounts on Tuesday, WITHOUT much of a strong weather signal(much warmer) one would have to be taking a heck of a chance that this increasing cold signal would be powerful enough to get a good reaction.
I'm glad that we didn't have the same colder signal on Tuesday and used it to buy because all it would have done was resulted in less of a crash lower because the maket needed historical cold to stop that plunge.
What if Europe's ng prices were crashing again today?
The European model operational was milder and we just dropped lower in tandem with that.............so we appear to be trading weather again.
Btu now the 12Z EE has clearly gotten the market's attention with colder late in the run (though earlier was a wash)!
It sure did Larry!
+5 HDD's, all in week 2!
Mike et al,
For the period 11/21-26, today's 12Z EPS and 12Z GEFS means are by a good margin the coldest yet of any run for the Midwest, the Plains, and the E US, including the SE US!
Is this a fluke? Or is this the start of the model realization that the last part of November will actually be quite cold in the E half of the country and not just cooled by Pacific airmasses? Nobody knows for sure. Stay tuned!
Thanks Larry!
With so much cold plunging north to south in Canada and being within striking distance of the US, small changes in the handling of waves in the fairly zonal flow will make a difference in how much of that cold gets tugged down behind each wave.
But the 12z EE does something else bullish.
It amplifies the upper level trough in the east and the -NAO pattern with this last 12z run in week 2.........which is a potential pattern change type dynamic that would affect future solutions, vs just run to run variations in HDD's from the timing or strength of individual perturbations within the main pattern.
This potentially has more longer term traction but it will take additional solutions going in this same direction/trend.
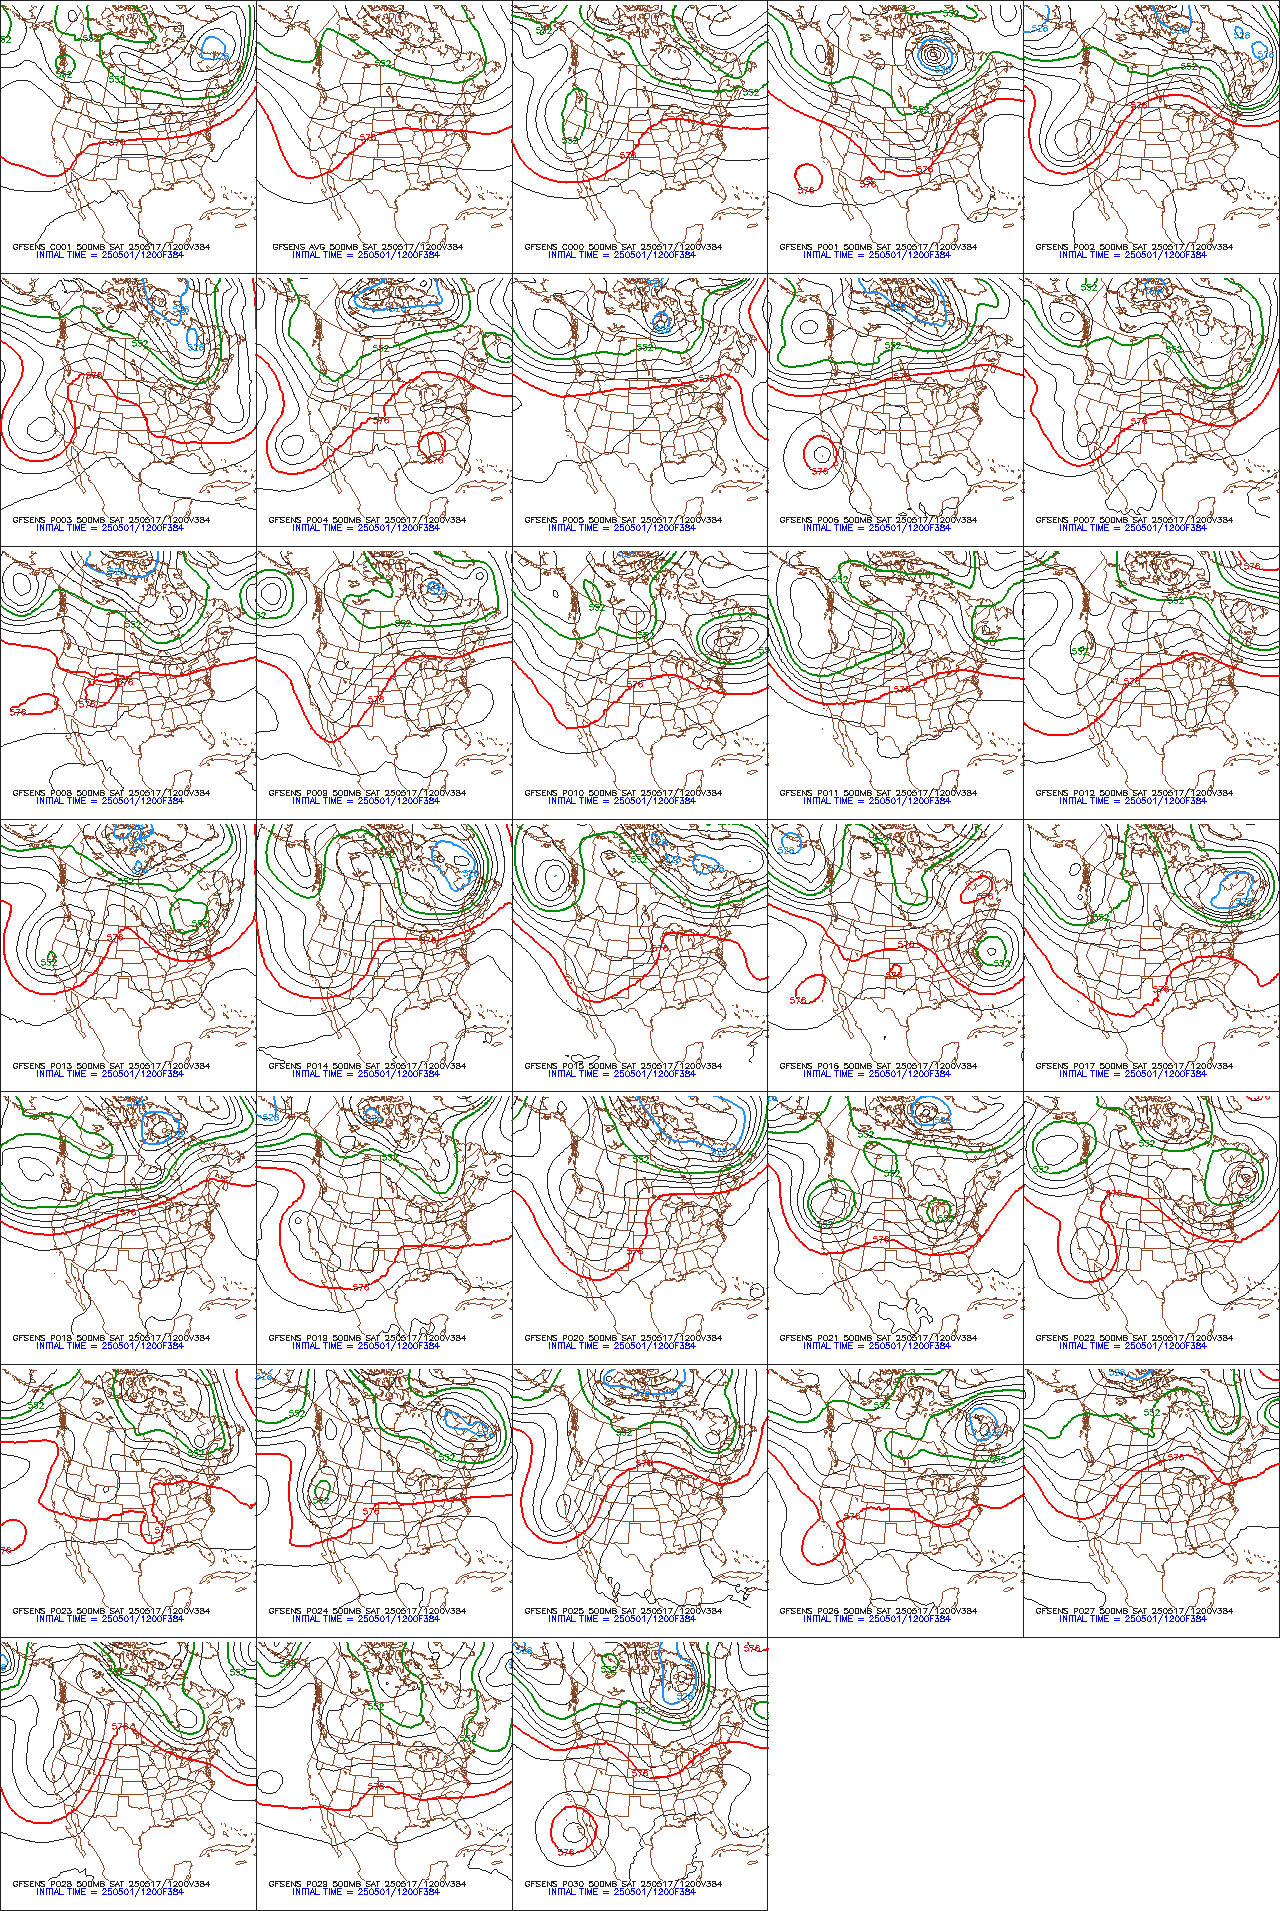
This is a look at the individual solutions from the last 12z GFS ensemble solution at the very end of the period(when skill is low).
However, since this period has the least known about it and farthest out, this results in the market actually trading it the most.
The farther out you go in the 2 week forecast, the more likely that we will see changes as forecast skill erodes with time. The more the change, the more powerful it is for trading HDD's. The last day actually gives you an added kick because its our best clue for the pattern that follows that last day and the following several days.
For instance. We don't use the map at day 10 to speculate about days 11-12-13 because we have maps from days 11-12-13 to tell us the predicted pattern.
If day 15 is the very last day in the model run(360 hours) even though the skill of the forecast has dropped that far out, there are no maps for days 16-17-18. So the market will extrapolate the potential for those days based on day 15, or the last day.
Additionally, because it has the least skill, it changes the most. That, by itself leads to an independent reason for their to be more potential power in the last map.
On the maps below. There a several really cold solutions(more than yesterday), especially in the Midwest also several mild ones. When there is so much disagreement like this..........it means low confidence for that forecast period.
Since yesterday, ALL the models are colder, some by a decent amount. If the models latch on to more Pacific flow and less northern stream........we may go back below $5. If they continue colder......the lows may be in for awhile.....or at least until the forecast stops being more bullish/colder.
What do you guys think?

Mike,
NG actually started going up on the colder 12Z EE at 1:05 PM CST, which was still late in week 1. Some of that of course was a rebound from the warmer 12Z Euro operational, which had made for a buying opportunity since it was pretty flat vs its prior run days 6-10 instead of warmer like the operational. So, the period of the Euro/EE for anyone wanting to try wx trading today was very tough and one had to be mighty careful/lucky to do well.
Looking at time and sales, the strongest EE related buying was from 1:05 PM-1:22 PM (during EE days 7-11) when it rose from 5.015 to 5.167 for a 3% gain! I think what happened is that it would have gone up strongly to the end but it had risen so much so fast before that that it became choppy with long profit taking as well as some some new shorts due to the significantly higher prices just before the "pit" close. It later made a new high of 5.176, but with a lot of choppiness.
Great analysis Larry!
I strongly agree that often, when you have several consecutive days of colder or warmer solutions, the market will OVER react, so that it sort of dials in the next few days of the same and you will actually see it retracing instead of going higher/lower still.
Also agree with the market initially recovering from an over reaction down from the milder E operational model that only goes out 10 days.
Considering the updates, the market had to be anticipating these colder changes before they popped up by a day or 2 which brings to mind a question you can help with.
Are there not firms that get the EE data quicker than others?
In a market like this, just a few seconds sooner can actually make you alot of extra money.
I have frequently seen the market react a few seconds quicker than when I get the HDD/CDD data and assume others must have seen it before me.
If this is privileged information that you would prefer not to share on an open forum, this is ok. You can email it too because I really like your thoughts on this.
I agree Gunter. Technically, today's move brought natty back up to the lower trendline, thus giving weight to the trend possibly changing. If Euroean prices continue to fall, this becomes a real possibility, with wx only having an affect with extreme changes.

Thanks Mark and especially Gunter. I missed your earlier post because the fast and furious posting earlier buried it up near the top quickly. Great charts.
Extreme daily price movements in Europe will have a huge, unpredictable very short term impact on prices like never before(as they did in October and 2 days ago but weather is usually king at this time of year.
I always say that the weather predicts the chart patterns, not the other way around for weather markets.
Agree that just normal temperatures will likely not be enough to inspire fresh buying and maybe not even modest cold.
Natural gas futures on Thursday snapped a four-day losing streak, pushed higher by hints of colder weather, solid demand for U.S. exports and gains in European prices. The December Nymex contract settled at $5.149/MMBtu, up 26.9 cents day/day. January jumped 27.1 cents to $5.245. NGI’s Spot Gas National Avg. snapped a five-day slump, gaining 18.0
metmike: This is another weekend where I wouldn't want to have a position(that's me). With half the solutions looking pretty cold now and us selling off so much and now putting in a possible short term bottom, the chance of a gap higher open on Sunday Night with the colder solutions winning is higher than a week ago. With ng, those gaps higher and lower on Sunday Night are more frequent than most markets and often are an over reaction. It seems there is quite a bit of emotion on the open from traders that guessed wrong on Friday's close and want out at the market on the next open.
Regardless, now maybe we can have some big fun! This is bound to be the most volatile ng trading cold season in well over a decade. Good luck and please be careful!
Man, this topic is hot today!
metmike: Doesn't take much to crash us lower. Like Larry said yesterday, it was a dead cat bounce.
The AO and NAO are still negative though with a massively wide spread..........though the ensemble mean(that averages out the extremes) is pretty zonal and mild at the end of 2 weeks.
Week 1 GFS came out chillier but week 2 guidance, which was the least known and most traded has come out MUCH milder.....and has been the last couple of runs.
EE was milder until the end which was colder.
The actual maps have a pretty dang cold look to them late in week 2 but ng obviously doesn't care.
I actually lean in this direction because of the -AO and -NAO and the EE is usually the best model.
Weather update:
https://www.marketforum.com/forum/topic/75004/#77681
Bottom line is that the GFS is very mild during and especially at the end of week 2.
The European model is cold in week 2, especially at the end.
The less followed Canadian model is mild, like the GFS and the CMC model is also closer to the mild models but the -AO and -NAO favor the colder European model.
What do you think Larry!
The low from just 2 days ago is 4.725 and we got to 4.752 today and are not far from that now at 4.792.
If the milder models are correct, there will likely be a bearish downside, breakaway gap lower on Sunday and the move could accelerate lower pretty fast.
Mild weather in November is the recipe for a crash lower.
However, it the EE and -AO/-NAO are correct, this will serve as a double bottom.
The momentum is obviously down. Only some extreme cold is going to save the day.
Also in the news today:
https://www.reuters.com/world/europe/european-gas-prices-ease-kremlin-soothes-fears-2021-11-12/
MOSCOW/LONDON, Nov 12 (Reuters) - European spot gas prices eased on Friday after the Kremlin said that Belarus had not consulted Moscow before threatening to reduce flows of natural gas to Europe, adding that Gazprom remained a reliable gas exporter.
metmike: I'm not saying this was all of it but like with Tuesday's crash(when ng in Europe fell 12%), the news out of Europe was falling prices and US ng prices have been tracking the prices in Europe this Fall for the first time ever.
Mike said:
“What do you think Larry!”
Mike, Did you see my message?
Thanks, I just noticed this and looked/saw it. Will respond in a minute.
Models going back and forth the last coieeuple of days. The last 0z runs are similar to fri afternoon.
Most of the models are close to average but the almighty European model is pretty cold in the Midwest and east.
If the models don't turn very cold, expect a gap down opening.
I think that we open higher Mark!
Week 2 looking a bit colder than before, especially in the SE. And if it opens up, that won't hurt my feelings any. I closed my trade at 1pm friday. Looking for another short opportunity.
We got the higher open from the colder weather models. More in a minute.
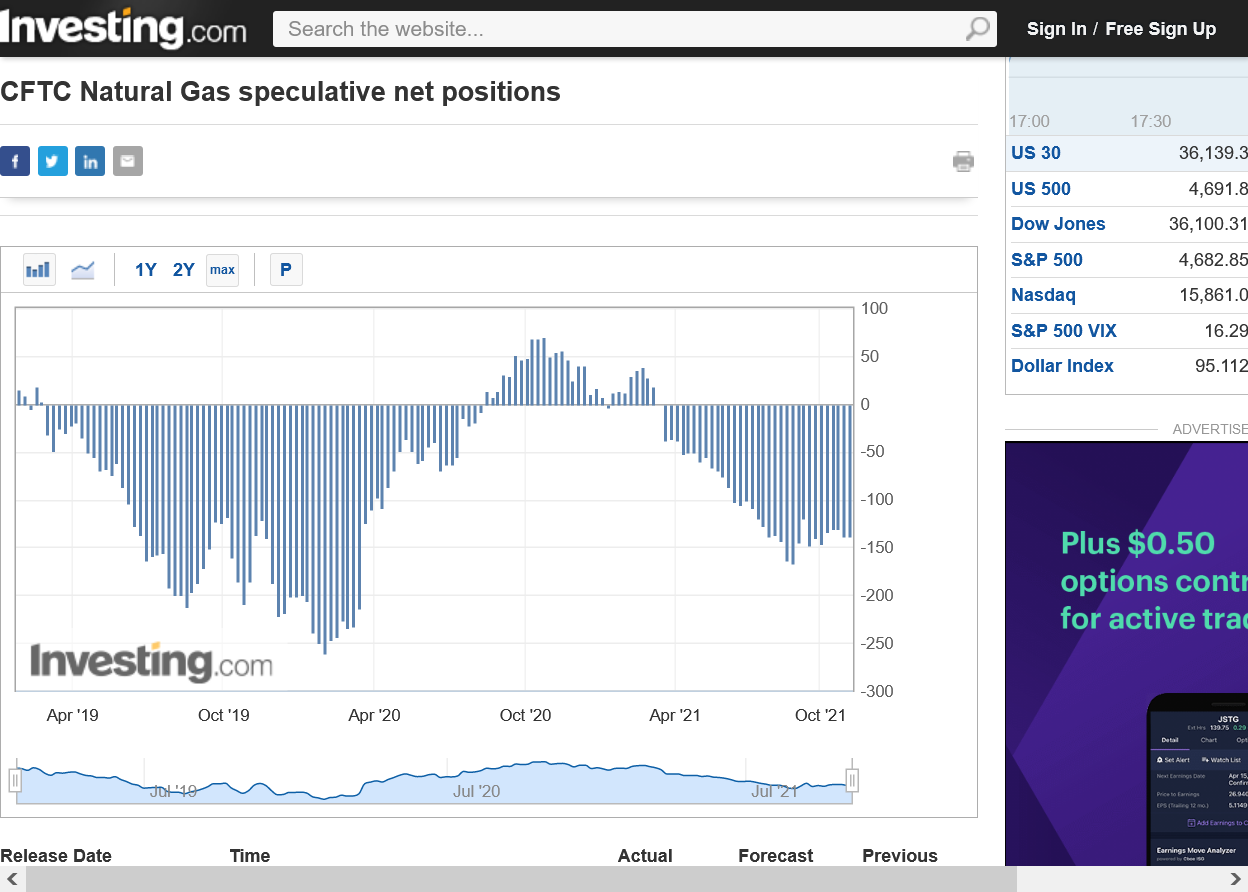
| Release Date | Time | Actual | Forecast | Previous | |
|---|---|---|---|---|---|
| Nov 12, 2021 | 14:30 | -137.7K | |||
| Nov 05, 2021 | 14:30 | -137.7K | -138.2K | ||
| Oct 29, 2021 | 14:30 | -138.2K | -131.1K | ||
| Oct 22, 2021 | 14:30 | -131.1K | -130.9K | ||
| Oct 15, 2021 | 14:30 | -130.9K | -133.7K | ||
| Oct 08, 2021 | 14:30 | -133.7K | -146.7K |
The EIA report this Thursday should be pretty bearish for November with a late season injection. 7 day temps are below.

This was the previous weeks temps

This was the slightly bullish EIA report from this past Wednesday.(released a day earlier because of V-Day)
As you noted, the 6-10 and 8-14 day forecasts are pretty chilly and bullish.
https://www.marketforum.com/forum/topic/75004/#75013
You can get all the weather here:
https://www.marketforum.com/forum/topic/75004/#75013
This is why ng is higher right now. Weather Maps are COLDER than they were on Friday.
The European model was the only cold in week 2 on Friday and the market ignored it. The GFS was pretty mild then. It's still the coldest on Sunday but the GFS has shifted colder.
This is the last map on the GFS Ensemble. It's what we call a Greenland type block with the positive anomaly near Greenland and a weakness/negative anomaly in the Eastern US. This causes a -NAO and sometimes -AO which usually leads to colder air in higher latitudes being flushed south to the mid latitudes.
In this case, we also have some cross polar flow prior to this period which transport frigid air from Siberia and dumps it into Canada. So the source region for Canadian cold fronts pushing into the US should be pretty dang cold.
https://www.psl.noaa.gov/map/images/ens/t850anom_f360_nhbg.gif
The weather pattern can change quickly and most of the non European models like the idea of more zonal flow but zonal Pacific flow is often a noted feature for El Nino Winters.
La Nina Winters have more amplified, merional type flow........from north to south and a Greenland Block is more likely during a La Nina, like we have currently. I thought this discussion for a forecast for LAST Winter had some relevant/good points for the current time frame/situation.
The patterns/maps below are NOT THIS PATTERN. They are much stronger versions of this pattern........ what this pattern can turn into IF it amplifies!
https://www.hometownforecastservice.com/2020-2021-winter-outlook/


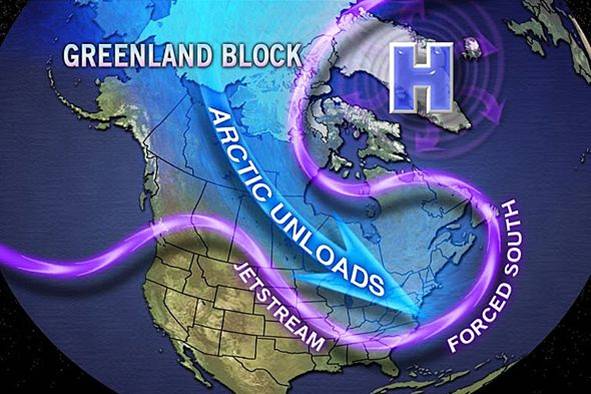
A blocking high pressure area across Greenland can lead to winter storms for the East Coast. About 50% of La Nina’s produce blocking and cold weather for New England so this is something to keep an eye on and something that could have more of an impact for the winter than we are currently forecasting.
Here are the AO, NAO and PNA. -AO and -NAO still potentially pretty cold but with enormous spread. Some are actually a bit positive. PNA near 0.
https://www.marketforum.com/forum/topic/75004/#77682
I should also add that the market is not acting that bullish for this much cold in the forecast. We are below the open and closer to the lows at the moment with an even colder 18z GFS.
This can change in the morning if the forecast is even colder and the big traders all want to buy. We could even get back above $5 pretty easy.
However, if we turn milder, taking out last weeks lows seems likely.
EU storage is at the lowest in 7 years. Partially hampered by Putin's reduction of delivery late last month. But that has been promised to be resumed soon, if not already. I don't keep a close eye on their politics. Chart below. Nonetheless, the Dutch NG market (TTF) has been forming a penant, and looks to break downward on resuming deliveries from Russia and imports from the US.
Exports for the US are finally back up to near maximum capacity at all ports, except Freeport, which has been doing maintainance.
Looking for a positive injection thursday dues to warming conditions last week. But looking forward to an even higher injection next week, due to warming this week. But winter withdrawels are about to kick in.
JMHO
Thanks Mark!
Europeans model was a whopping -11 HDDs milder and it crashed ng.
The 6z gfs was +4 HDDs so we had a bounce from the spike lower.
Many of The weather models and the pattern still look pretty cold in week 2,,,,not all of them though.
I’m still in the cold camp for now.
After heavy selling last week, natural gas futures gained back some ground in early trading Monday, though analysts saw potential for an imminent test of a key nearby support target. Coming off a 35.8-cent sell-off in Friday’s session, the December Nymex contract was up 5.7 cents to $4.848/MMBtu at around 8:45 a.m. ET. The December…
metmike: 0z EE was much milder and we crashed,, than the 6z GFS came out colder and we recovered. Overall Pattern is looking COLD! And in fact, even more bullish today.
Fundamentals, time of year and chart pattern and prices in Europe look negative though.
These factors at the 2nd link are even a bit colder than Sunday and especially..............in much more agreement:
The 12z GFS was slightly milder than the colder 6z but the same as the 0z. The EE was colder, a whopping +8 HDD's colder and basically, completely reversed the much milder solution very early morning that resulted in very weak trading for the following several hours and capitulated with a spike below last weeks low around 6am.
The colder 6z GFS and realization of the actual pattern.......which is quite cold, regardless of run to run changes in HDD's took over when the big money started trading.
The 6-10/8-14 day outlooks came in as expected. Pretty chilly but those forecasts are using data the market already traded.
Anything else is just a review of yesterday:
metmike: As always, ng over reacts on any one day. Probably the over reaction was to the downside late last week, with weather models looking this cold. Today actually made more sense to put back some cold weather premium based on the upcoming cold pattern. Of course prices in Europe can spike us lower on some days too, which might have been most of it last week.
Increased heating demand expectations in the latest forecasts helped extend natural gas futures gains in early trading Tuesday. After rallying 22.6 cents in the previous session, the December Nymex contract was up another 15.8 cents to $5.175/MMBtu at around 8:45 a.m. ET. Recent run-to-run volatility from the major weather models continued overnight, this time with…
metmike: Milder week 2 6Z GFS gave us a little spike down around 6am, otherwise the pattern is looking even COLDER for all the reasons mentioned above.
This is a potentially very bullish wild card!
The move up got pretty extreme this morning, maybe overextended.
This is also not always all about US weather like the good old days.
The not closely followed 12z Canadian(I always look at it) and CMC model look pretty mild and zonal for most members at the end of 2 weeks.
The 12z GFS after a milder run was colder again(but still a zonal look late in week 2) but then the 12z EE lowered the boom in an already falling market with -9 HDD's all in week 2, so the coldest model turned out alot less cold during the period that market expects the cold to increase the most in.
That's just my take. How about you Larry?
Larry has been long since Friday BTW, I didn't think he would mind me stating that since he nailed the call based on this change to much colder in the pattern that showed up last week. Mentioned it to give him a congrats on the forum.
He's like me though. It can mess up the mindset of my trading if I start discussing my position and I'm in and out of positions with every model run(which keeps me from capitalizing on thee bigger moves, unfortunately).
The biggest thing is what I DON'T want is people deciding to go long or short because I'm long or short. I know some commentators want exactly that. However, if you ever want to do well in this business you need to make your own decisions based on everything other than just having the same position of somebody that you trust or that has success.
You learn nothing by copying somebody else that did all the homework/research/analysis. You can agree with it but if them going long or short is the reason for you to do it..............then they are making the absolute most critical decision that a trader can make for you.........whether to risk YOUR money or not.
Yeah, it makes it easier if you see other people you trust doing it and follow them but that's like never taking the training wheels off of your bike the rest of your life.
You certainly don't have to do it or ever trade 1 contract in your life. Or you can give all your money to a trading manager and let them make 100% of the decisions.
I'm just here to give you as much reliable/comprehensive information as possible to do whatever you want with and share a love of tracking the natural gas market and what makes it tick.
An I love it when other guys, like Jim and Mark and TJC share their trades or thoughts on where the market is headed. That's what its all about.
Greenman didnt trade ng but he used to tell me that sharing his trades on MarketForum caused him to have more discipline(for his style of trading)
Natural gas futures on Tuesday rallied with vigor amid continued strength in U.S. exports of liquefied natural gas (LNG) and renewed concerns about European supplies that sent global gas prices higher. The December Nymex contract jumped 16.0 cents day/day and settled at $5.177/MMBtu. A day earlier, the prompt month posted a 22.6-cent gain. January advanced…
metmike: Already made my fundamental comments. After hitting 5.392, the settlement over 2,000/contract lower than that and in the lower end of the range took alot of wind out of the bulls sails. But the weather pattern is still potentially very bullish. If the pattern would evolve into a polar vortex type low shifting very far south, we could spike to $6 again. Or if the more zonal look to some of the last model runs ends up happening.........the highs today may be the highs for this spike higher. I've been strongly in the colder camp for the last week but am shifting to slightly less bullish(mainly because the market has already dialed in A TON OF COLD) and thinking we could go strongly either direction.
In other words, all the extended outlooks will need is temperatures slightly below average for it be to bearish weather because SOME POTENTIAL much below average temp risk premium is dialed in.
The reality of MUCH BELOW.........that ends up being more sustained or even colder still has tremendous upside potential.
Another element too is that on the way up, after we hit the low and start triggering a momentum shift for technical traders....... initially there are alot of buy stops and weak shorts bailing that dumps extra fuel on the fire. As well as fresh longs.
That probably happened today.
Recovering that last 2,500 drop since late morning may not be as easy with the same weather that got us up there pretty easy very early today.
Any longer lived shorts that bailed between here and there are mostly out(though there were new shorts obviously since then). Fresh longs buying during the initial furious rally period will have to be motivated to buy again or add and need extra fuel. Probably less buy stops now. Just my speculation.
Thanks, Mike. I actually got out of the original trade yesterday though I did others later.
YW Larry.
Models showing some moderation/less cold but still a bit cold at the end of the period are bearish.
We need more cold for bullish.
metmike: All the indicators are LESS COLD to even MILD compared to yesterday for late week 2 today.
Instead of a strongly negative -AO and -NAO, today these indices bounce back towards 0/neutral.
https://www.marketforum.com/forum/topic/75004/#77682