Been a long time since that was a topic.
Actually, we discussed it numerous times in recent months with model updates in the crop condition, weather or other threads, Jim.
Sorry Mike, didn’t mean to stir you up. I should have said a long time since it was in the subject line. If it’s been in the subject line, I missed it.
No problem JIm. I'm totally not stirred up. I enjoy your contributions here a great deal and it was more of a reminder.
You didn't know that the Noon maps is/are the 12z model(which actually are not completed until well after noon).
And since I don't show what they look like here for hours later.......I totally get that.
https://www.marketforum.com/forum/topic/87675/#87742
If you posted this because natural gas shot up +6,000 right around noon in 40 minutes time, thinking it was the weather forecast update..........great guess but this is why Larry stopped trading natural gas earlier this year.
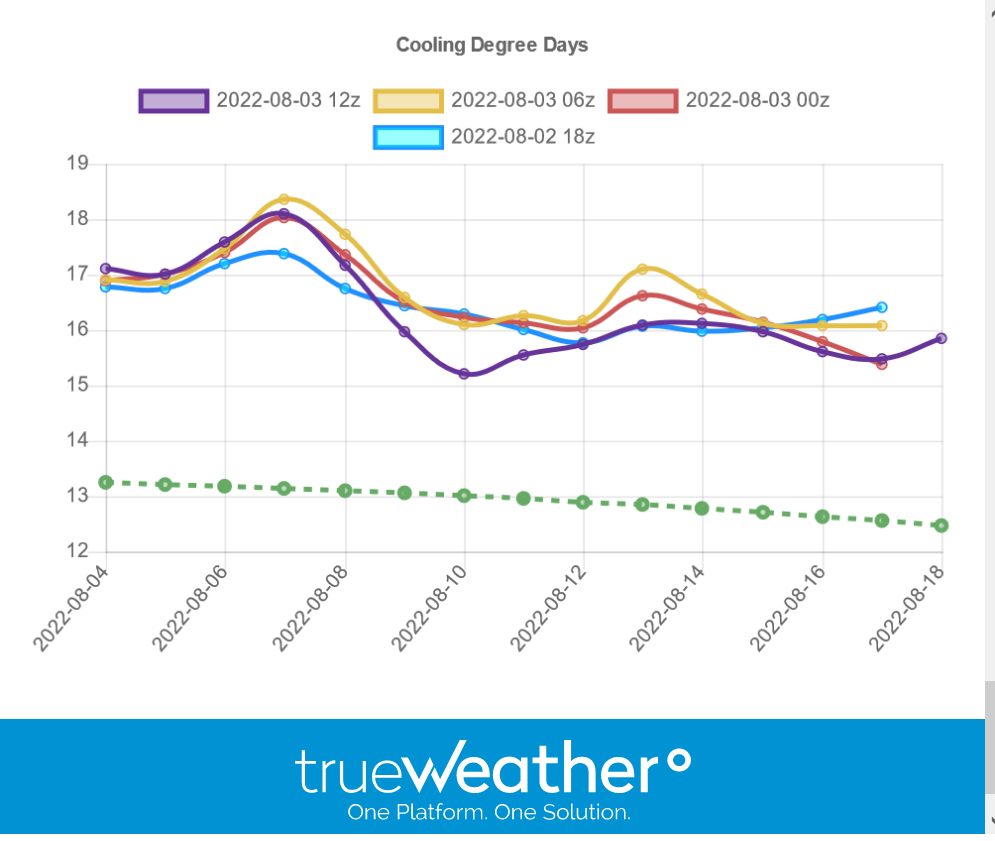
The mid day 12z GFS ensemble model was actually -6 CDDs COLDER(less hot) and bearish compared to the previous model and -4 CDDs than the one before that.and -2 CDDs compared to the one from 24 hours earlier.
The 4 lines below are the CDDs graph going out 2 weeks for the last 4 runs. The purple line is this last 12z run.

This was the early afternoon 12z GFS solution for 2 week rains.
Much of this is week 1 rain.

Just out 12z GFS ensemble (noon maps) rain for 2 weeks
