
I'll be on Relevant Radio again, today at 4:30 pm discussing this topic on the Drew Mariani Show.
https://relevantradio.com/listen/our-shows/the-drew-mariani-show/
https://relevantradio.com/listen/
Here's a thread to help focus thoughts and relevant elements pertaining to the discussion, in preparation for it.
This was the statement earlier this Summer from the UN:
The head of the United Nations has warned the world faces “catastrophe” because of the growing shortage of food around the globe.
|
June 24, 2022
BERLIN (AP) — The head of the United Nations warned Friday that the world faces “catastrophe” because of the growing shortage of food around the globe.
U.N. Secretary-General Antonio Guterres said the war in Ukraine has added to the disruptions caused by climate change, the coronavirus pandemic and inequality to produce an “unprecedented global hunger crisis” already affecting hundreds of millions of people.
“There is a real risk that multiple famines will be declared in 2022,” he said in a video message to officials from dozens of rich and developing countries gathered in Berlin. “And 2023 could be even worse.”
Guterres noted that harvests across Asia, Africa and the Americas will take a hit as farmers around the world struggle to cope with rising fertilizer and energy prices.
“This year’s food access issues could become next year’s global food shortage,” he said. “No country will be immune to the social and economic repercussions of such a catastrophe.
Russia exported as much wheat in May and June this year as in the same months of 2021, Baerbock said.
She echoed Guterres' comments that several factors underlie the growing hunger crisis around the world.
“But it was Russia's war of attack against Ukraine that turned a wave into a tsunami,” Baerbock said.”
Here is a very recent update:
https://www.worldbank.org/en/topic/agriculture/brief/food-security-update
Overview
Domestic food price inflation remains high around the world. Information from between April and July 2022 shows high inflation in almost all low- and middle-income countries; 92.9% of low-income countries, 92.7% of lower-middle-income countries, and 89% of upper-middle-income countries have seen inflation levels above 5%, with many experiencing double-digit inflation. The share of high-income countries with high inflation has also increased sharply, with about 83.3% experiencing high food price inflation.
As of August 11, 2022, the Agricultural Price Index was 1% higher than two weeks ago. Both maize and wheat prices are 2% higher compared to January 2022, while rice prices are about 6% higher. Compared to the January 2021 average, maize and wheat price indices are 20% higher, while the rice price index is 16% lower (See “pink sheet” data for agricultural commodity and food commodity prices indices, updated monthly.)
According to the World Bank’s April 2022 Commodity Markets Outlook, the war in Ukraine has altered global patterns of trade, production, and consumption of commodities in ways that will keep prices at historically high levels through the end of 2024 exacerbating food insecurity and inflation.
Following the start of the war in Ukraine, trade-related policies imposed by countries have surged. The global food crisis has been partially made worse by the growing number of food trade restrictions put in place by countries with a goal of increasing domestic supply and reducing prices. As of August 11, at least 23 countries have implemented 33 food export bans, and at least seven have implemented 11 export-limiting measures.
By June 2022 the number of acute food insecure people – whose access to food in the short term has been restricted to the point that their lives and livelihoods are at risk – increased to 345 million in 82 countries according to WFP. In addition, WFP and FAO warned that acute food insecurity could worsen in 20 countries or areas during June to September 2022.
Rapid phone surveys done by the World Bank in 85 countries show a significant number of people running out of food or reducing their consumption in the first two years of the COVID-19 pandemic. Reduced calorie intake and compromised nutrition threaten gains in poverty reduction and health and could have lasting impacts on the cognitive development of young children."
How much has this affected exports from Ukraine?
This article discusses an agreement that should BOOST exports from Ukraine.
USDA: August 2022
https://apps.fas.usda.gov/psdonline/circulars/grain.pdf
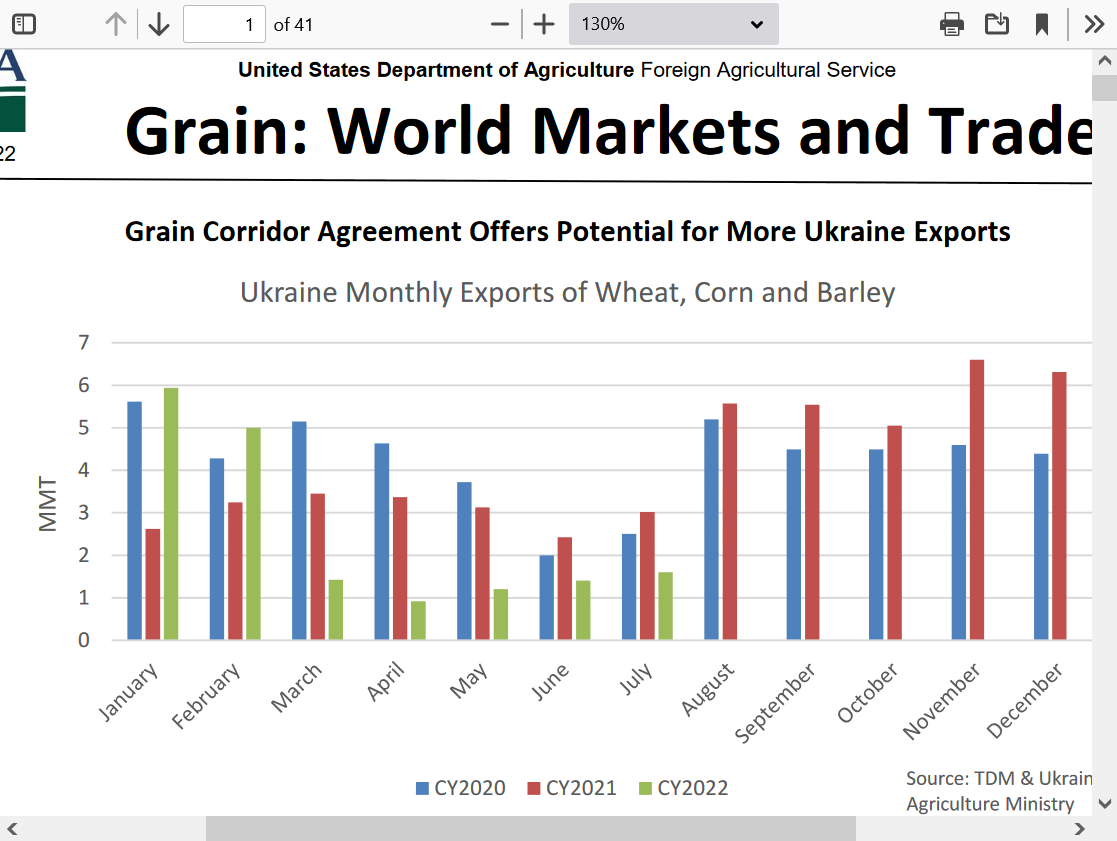
Their projections into 2023 are actually favorable with other countries more than picking up the slack from lost Ukrainian production/exports, especially the increases from Russia.
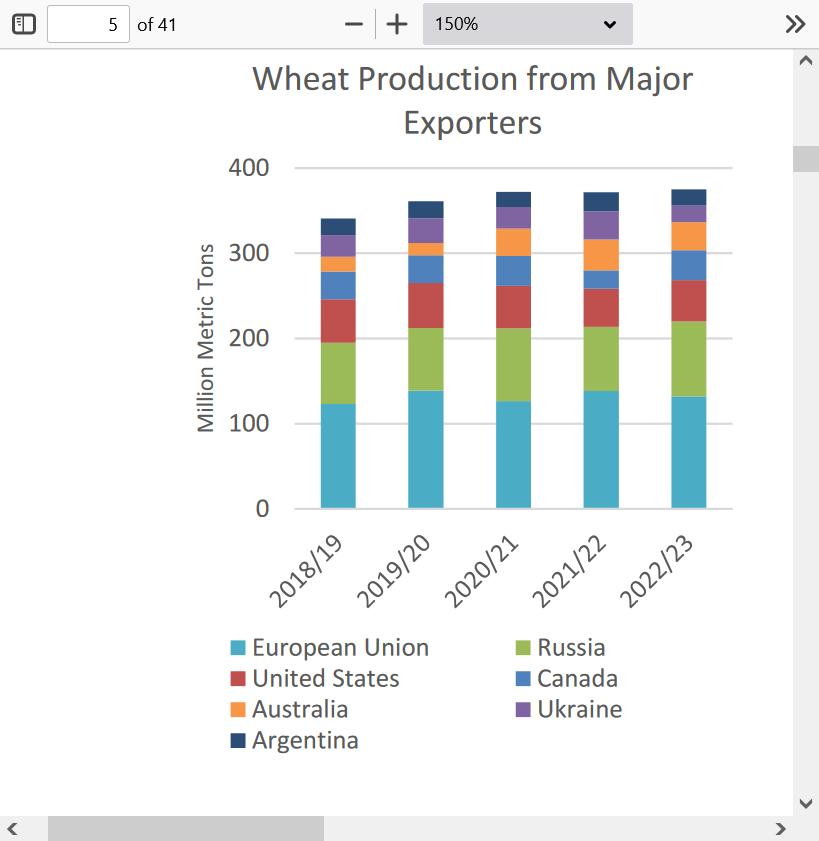
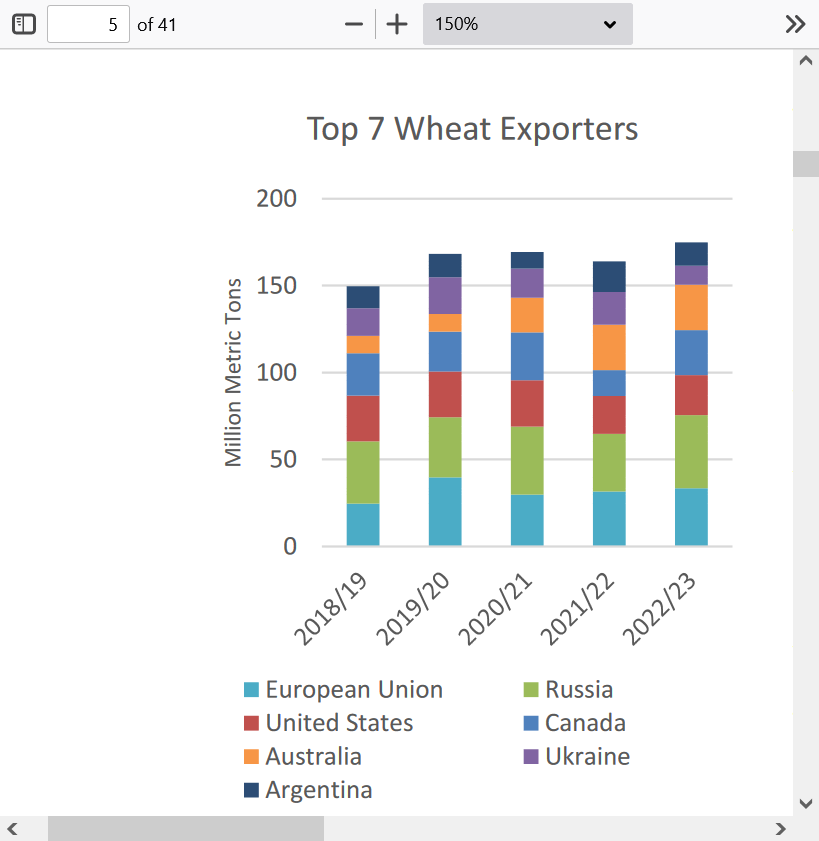
Here's the most recent United Nations demand/supply report based on the actual reality numbers. This is BIG!
It doesn't line up with their dire verbal warnings of a global food catastrophe. It is MUCH more optimistic compared to just the previous month. Slightly lower than 2021's record but no disaster as originally projected. This is the latest!
Cereal production often includes wheat, rice, oats, barley, maize, rye, millet, corn, and sorghum.
https://www.fao.org/worldfoodsituation/csdb/en/
Release date: 08/07/2022
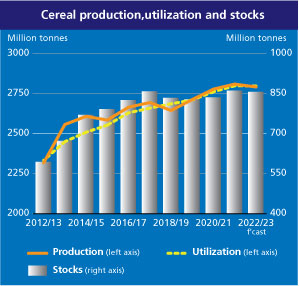 FAO’s forecast for global cereal production in 2022 has been raised by 7 million tonnes in July from the previous month and is now pegged at 2 792 million tonnes, however, still 0.6 percent short of the world output in 2021.
The month-on-month increase predominantly rests on a 6.4-million-tonne upward revision made to the coarse grain production forecast, with the world output seen reaching 1 501 million tonnes in 2022, only 0.5 percent below the 2021 outturn. Prospects were bolstered this month by reports indicating large maize plantings in China (mainland) and India. Furthermore, although still pointing to a likely 30-percent decline from the past five-year average, Ukraine’s maize production prospects were also lifted with official data indicating larger-than-previously anticipated maize sowings. These increases more than outweigh moderate cutbacks to maize production forecasts for Mexico and several Far East Asian countries, as well as a more sizeable cut to the forecast for the European Union, where plantings are lower than originally predicted and drier-than-normal weather has dampened yield prospects. The forecast for world wheat production in 2022 has been lowered only fractionally in July to 770.3 million tonnes, remaining 1.0 percent lower year-on-year. The marginally diminished outlook results from cuts to production forecasts for the European Union, where persisting dryness has impaired yield prospects, and to a lesser degree for Argentina and Iraq. These downgrades more than outweigh improved harvest expectations in Canada and Australia, where conducive weather at planting time and remunerative prices are encouraging area expansions. Additionally, continued beneficial weather in the Russian Federation has lifted yield prospects of the winter crop and further reinforced the country’s good production prospects in 2022. As for rice, FAO has raised its 2022 production forecast for India based on a higher officially reported outcome of the 2021 Kharif harvest in the country. This revision more than compensates for a yield-based reduction made for Viet Nam, alongside some other more minor downgrades. As a result, world rice production in 2022 is now seen in the order of 520.5 million tonnes (milled basis), down just 0.4 percent from the 2021 record harvest.
One of the biggest challenges for global food production as we move forward is the political objective to eliminate fossil fuels and synthetic fertilizers based on junk science connecting them with slight, mostly beneficial warming.
Many reliable sources estimate that half/50% of the world is being fed by synthetic fertilizers.
We actually got to use the country of Sri Lanka as a real world laboratory to observe what happens when you eliminate many of the synthetic derived inputs to agriculture, like fertilizers, herbicides and pesticides.
"The agrochemical ban caused rice production to drop 20 percent in the six months after it was implemented, causing a country that had been self-sufficient in rice production to spend $450 million on rice imports — much more than the $400 million that would’ve been saved by banning fertilizer imports.
The production of tea, Sri Lanka’s literal cash crop — it’s the country’s biggest export — fell by 18 percent. The government has had to spend hundreds of millions on subsidies and compensation to farmers in an effort to make up for the loss of productivity."
metmike: Organics are great in certain niches but they will obliterate crop yields and global food production because of the irrefutable law of photosynthesis. This is agronomy/plant science 101.
We discussed this at length, earlier this Summer. Going organic will have no impact on the climate. What it will do is to lower the amount of pollution in the water/soils LOCALLY but the reason to ban them is based on the atmosphere which is absurd.
Dutch farmers and nitrogen :
https://www.marketforum.com/forum/topic/86882/
If you want to lower world food production by the most possible in the quickest amount of time..........cut synthetic fertilizers.
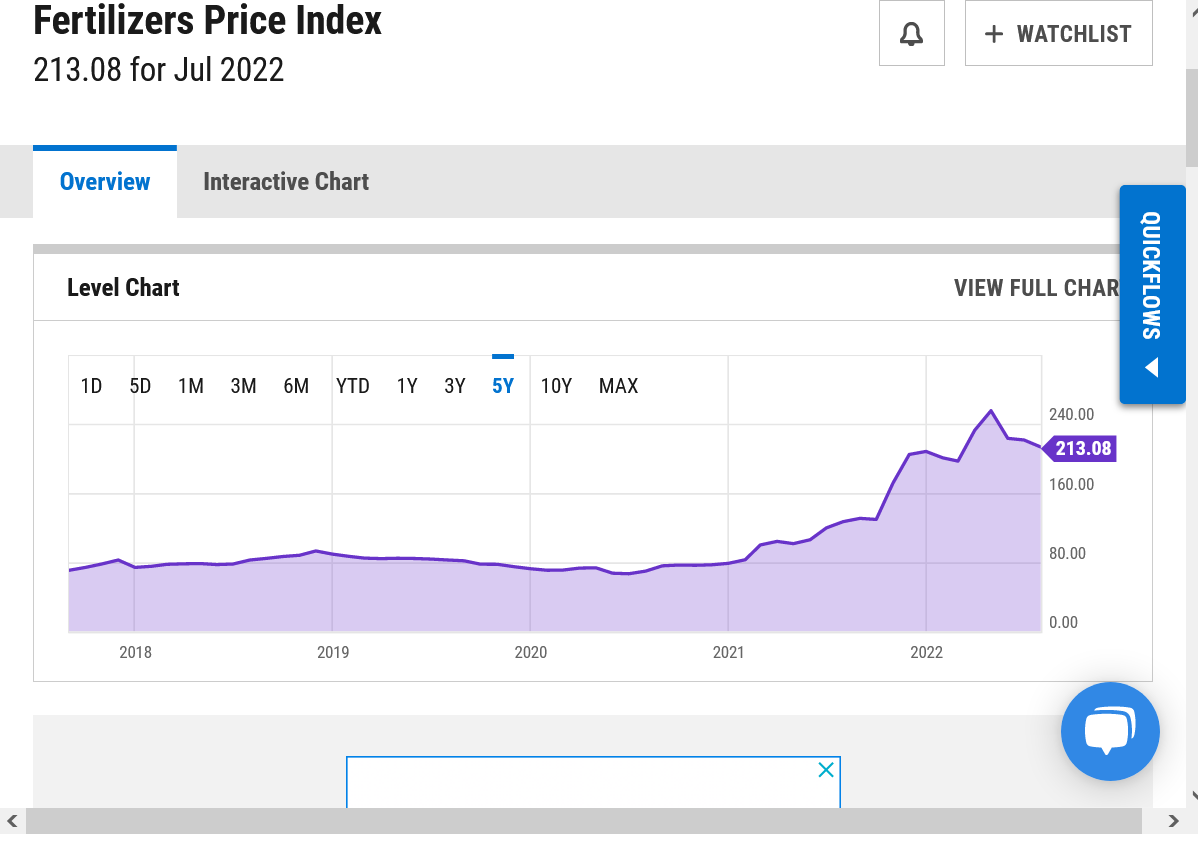
There is the issue of the drastic increase in the cost of fertilizers.
Much of this is tied to the increase in the price of fossil fuels and also, the pressure to reduce production of synthetic fertilizers because they are supposedly bad for the climate.
Less supply +increase cost to produce and to transport = much higher cost = potentially cutting demand/use = potentially lowering yields from less fertilizer
We saw what happened in Sri Lanka when this was FORCED on farmers. If the price gets too excessive, it could stifle SOME demand from that fact alone.
Fertilizer prices tripled in the 18 months after January 2021 to mid 2022, in tandem with natural gas prices spiking high. They have backed off, in tandem with the price of the liquid energies dropping.
However, the price of natural gas is MOST important to fertilizer production and that is NOT going to back down during the next several months because ng in storage in Europe is dangerously low and near the lows of the 5 year average in the USA.
You can blame the war on fossil fuels for lack of a quicker production increase in natural gas by large investors who are being rewarded handsomely by throwing their money at fake environmental investments, like wind energy plays.
+++++++++++++++++++++++++++++++++++
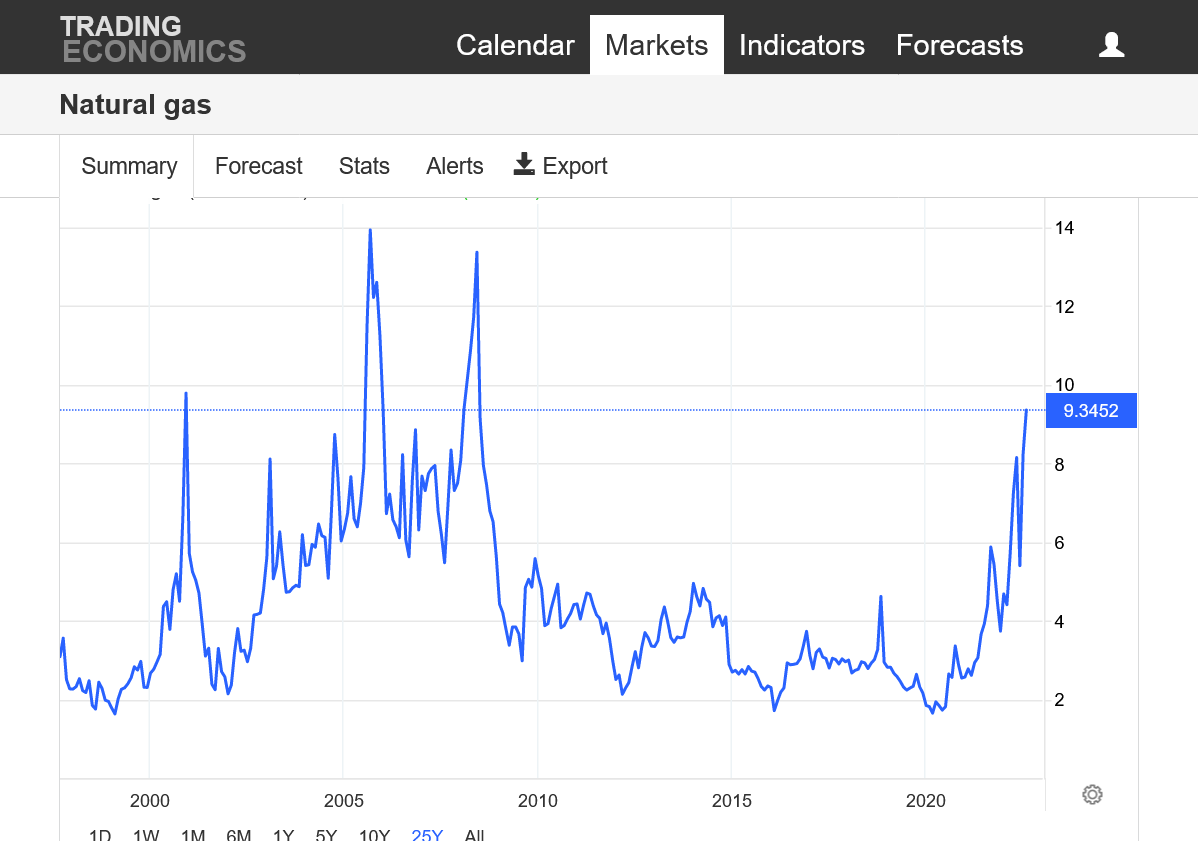
The price of natural gas has more than tripled and is the highest by far in the last 14 years.
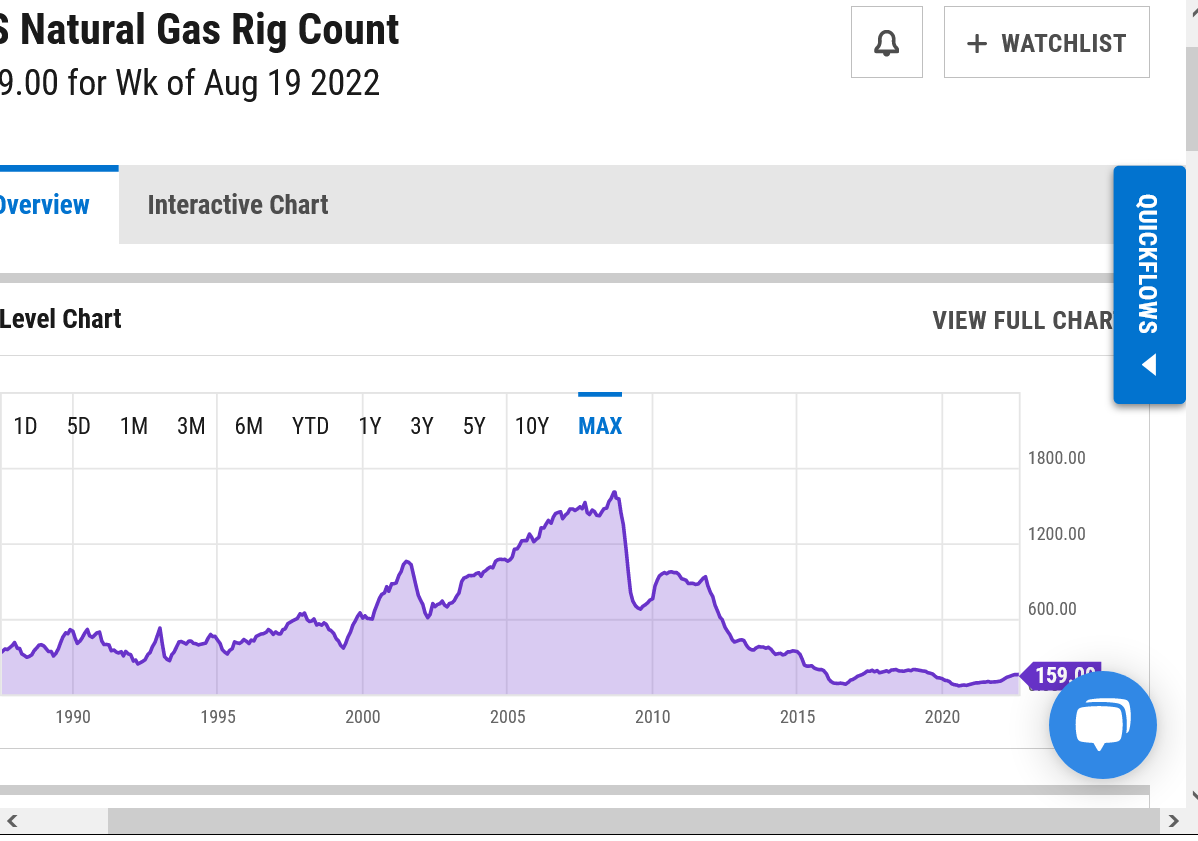
In the past, this would have caused the rigs searching for new gas to spike MUCH, MUCH higher. But the politics makes investment money in natural gas LESS profitable, even at these sky high prices compared to all the financial incentives the government is offering to the fake environmental plays.
https://www.macrotrends.net/2478/natural-gas-prices-historical-chart
https://ycharts.com/indicators/us_gas_rotary_rigs
As long as the price of natural gas stays high, the cost of fertilizers will be high.
As long as the amount of natural gas in storage is low(supplies are not large enough to increase storage) natural gas prices will stay high.
As long as fertilizer prices stay extremely high, there will be upward pressure on food prices because fertlizers and other synthetic ag products are a major input cost to growing crops that get dialed into the price.
The blue line below shows storage near the 5 year minimum for US natural gas supplies for AUGUST 2022.
for week ending August 12, 2022 | Released: August 18, 2022 at 10:30 a.m. | Next Release: August 25, 2022 +18 BCF VERY BULLISH!
| Working gas in underground storage, Lower 48 states Summary textCSVJSN | |||||||||||||||||||||||||
|---|---|---|---|---|---|---|---|---|---|---|---|---|---|---|---|---|---|---|---|---|---|---|---|---|---|
| Historical Comparisons | |||||||||||||||||||||||||
| Stocks billion cubic feet (Bcf) | Year ago (08/12/21) | 5-year average (2017-21) | |||||||||||||||||||||||
| Region | 08/12/22 | 08/05/22 | net change | implied flow | Bcf | % change | Bcf | % change | |||||||||||||||||
| East | 571 | 564 | 7 | 7 | 643 | -11.2 | 667 | -14.4 | |||||||||||||||||
| Midwest | 684 | 663 | 21 | 21 | 762 | -10.2 | 758 | -9.8 | |||||||||||||||||
| Mountain | 151 | 148 | 3 | 3 | 188 | -19.7 | 183 | -17.5 | |||||||||||||||||
| Pacific | 248 | 252 | -4 | -4 | 240 | 3.3 | 272 | -8.8 | |||||||||||||||||
| South Central | 866 | 874 | -8 | -8 | 983 | -11.9 | 1,006 | -13.9 | |||||||||||||||||
| Salt | 185 | 193 | -8 | -8 | 244 | -24.2 | 253 | -26.9 | |||||||||||||||||
| Nonsalt | 681 | 681 | 0 | 0 | 740 | -8.0 | 753 | -9.6 | |||||||||||||||||
| Total | 2,519 | 2,501 | 18 | 18 | 2,815 | -10.5 | 2,886 | -12.7 | |||||||||||||||||
Totals may not equal sum of components because of independent rounding. | |||||||||||||||||||||||||
Working gas in storage was 2,519 Bcf as of Friday, August 12, 2022, according to EIA estimates. This represents a net increase of 18 Bcf from the previous week. Stocks were 296 Bcf less than last year at this time and 367 Bcf below the five-year average of 2,886 Bcf. At 2,519 Bcf, total working gas is within the five-year historical range.

Scroll down to the next page for the actual data from authentic science studies
With regards to the junk science of CO2 and the political fake climate crisis vs the authentic climate optimum, featuring the best weather and climate in the last 1,000 years on this greening planet(since the Medieval Warm Period that was this warm).
I've covered this 100 times here.
The law of photosynthesis has NOT been repealed by political degrees which falsely label beneficial CO2 as pollution.
Fake beer crisis/Death by GREENING!
https://www.marketforum.com/forum/topic/69258/
+++++++++++++++++++++++++++
This is what the science being covered up by the gatekeepers of the fake climate crisis information actually shows:
Here are most of the studies(hundreds on the map below), that by a wide margin, show that the Medieval Warm Period was this warm or warmer than now(Current Warm Period=CWP). Most of them done before climate science was hijacked.
Over 100 studies from the Medieval Warm Period, most of which show the planet was this warm or warmer 1,000 years ago. It was also this warm 2,000 years ago during the Roman Warm Period and also just over 3,000 years ago, during the Minoan Warm period.
Medieval Warm Period Project:
http://www.co2science.org/data/mwp/mwpp.php
| MWP-CWP Qualitative Temperature Differentials - CO2 Science Figure Description: The distribution of Level 2 Studies that allow one to determine whether peak Medieval Warm Period temperatures were warmer than (red), equivalent ... |
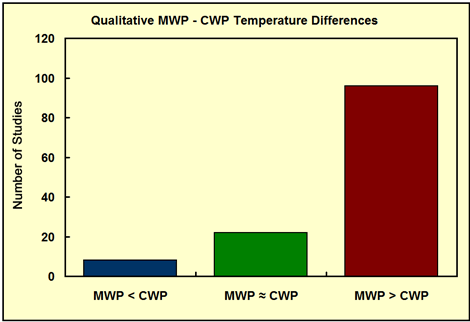
Where did the data from the bar graphs above come from so that we know that this is the authentic science vs the one that the MSM and dems describe with the fake climate crisis?
List of Scientists Whose Work We Cite:
http://www.co2science.org/data/mwp/scientists.php
List of Research Institutions Associated With the Work We Cite
http://www.co2science.org/data/mwp/institutions.php
+++++++++++++++++++++++++++++++++++++++++++++++++++++++++++++++++
For the Medieval Warm Period compared to today below:
Red balloons showed it was warmer.
Blue was colder than today(in that study)
Green was wetter/more precip
Yellow was drier
https://wattsupwiththat.com/2017/01/03/documenting-the-global-extent-of-the-medieval-warm-period/
If you go to the link below, you can hit those individual balloons and get each individual study:
Holocene Climate OPTIMUM....even WARMER than today in the higher latitudes of North America.
https://en.wikipedia.org/wiki/Holocene_climatic_optimum
Of 140 sites across the western Arctic, there is clear evidence for conditions that were warmer than now at 120 sites. At 16 sites for which quantitative estimates have been obtained, local temperatures were on average 1.6±0.8 °C higher during the optimum than now. Northwestern North America reached peak warmth first, from 11,000 to 9,000 years ago, but the Laurentide Ice Sheet still chilled eastern Canada. Northeastern North America experienced peak warming 4,000 years later. Along the Arctic Coastal Plain in Alaska, there are indications of summer temperatures 2–3 °C warmer than now.[9]Research indicates that the Arctic had less sea ice than now
The Positive Externalities of Carbon Dioxide: Estimating the Monetary Benefits of Rising Atmospheric CO2 Concentrations on Global Food Production
Future Monetary Benefit Calculations and Results
http://www.co2science.org/education/reports/co2benefits/futurebenefits.php
Table 4. The total monetary benefit of Earth's rising atmospheric CO2 concentration on each of the forty-five crops listed in Table 1 for the period 2012-2050. Values are in constant 2004-2006 U.S. dollars.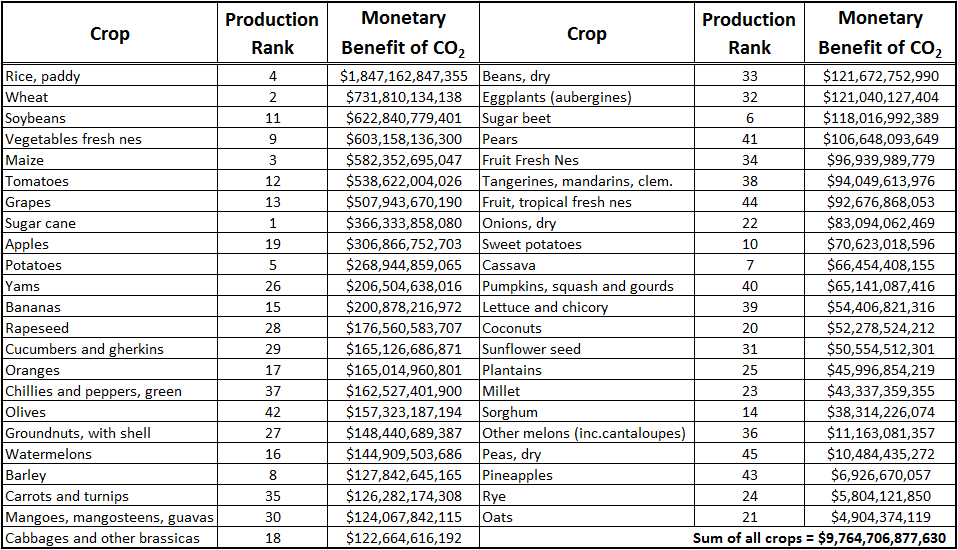
The results of the above set of calculations once again reveal a tremendous financial benefit of Earth's rising atmospheric CO2 concentration on global food production. Over the period 2012 through 2050, the projected benefit amounts to $9.8 trillion, which is much larger than the $3.2 trillion that was observed in the longer 50-year historic period of 1961-2011.
Back to the original topic.
One thing that nobody can know is how the war in Ukraine will evolve, which could cause a big change to
the world food dynamic.
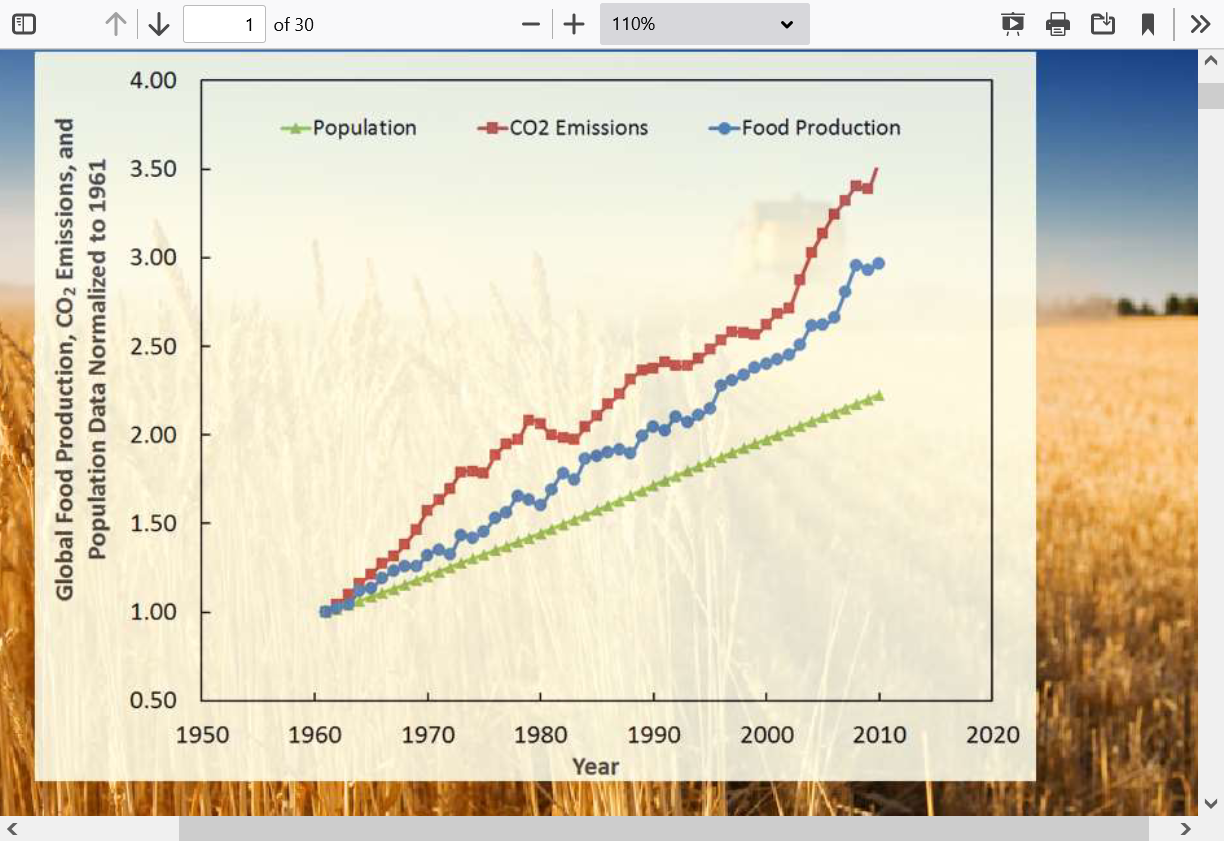
However, the latest data suggests its not looking as bad as what the UN and others have been forecasting because of an increase in crops in Canada, Australia, India, Russia and China partly because of the positives of climate change and the continued benefits of higher CO2.
Partly from their response to higher prices.
We say in commodity trading "the cure for high prices...........is high prices" because it provides more incentive to increase production.....which increases supply.........which puts downward pressure on prices.