KEY EVENTS TO WATCH FOR:
Tuesday, October 11, 2022
6:00 AM ET. September NFIB Index of Small Business Optimism
Small Business Idx (previous 91.8)
8:55 AM ET. Johnson Redbook Retail Sales Index
Ret Sales Mo-to-Date, M/M%
Ret Sales Mo-to-Date, Y/Y% (previous +11.2%)
Latest Wk, Y/Y% (previous +12.3%)
9:00 AM ET. IMF World Economic Outlook
10:00 AM ET. IBD/TIPP Economic Optimism Index
Economic Optimism Idx (previous 44.7)
6-Mo Economic Outlook (previous 39.5)
Wednesday, October 12, 2022
7:00 AM ET. MBA Weekly Mortgage Applications Survey
Composite Idx (previous 218.7)
Composite Idx, W/W% (previous -14.2%)
Purchase Idx-SA (previous 174.1)
Purchase Idx-SA, W/W% (previous -12.6%)
Refinance Idx (previous 430.9)
Refinance Idx, W/W% (previous -17.8%)
8:00 AM ET. IMF Fiscal Monitor published
8:30 AM ET. September PPI
PPI, M/M% (previous -0.1%)
Ex-Food & Energy PPI, M/M% (previous +0.4%)
Personal Consumption (previous -0.1%)
10:00 AM ET. September Online Help Wanted Index
12:00 PM ET. World Agricultural Supply & Demand Estimates (WASDE)
Corn, End Stocks (Bushels)
Soybeans, End Stocks (Bushels)
Wheat, End Stocks (Bushels)
Cotton, End Stocks (Bales)
2:00 PMET. Federal Open Market Committee meeting minutes and economic forecast
4:30 PM ET. API Weekly Statistical Bulletin
Crude Stocks, Net Chg (Bbls) (previous -1.8M)
Gasoline Stocks, Net Chg (Bbls) (previous -3.5M)
Distillate Stocks, Net Chg (Bbls) (previous -4.0M)
Thursday, October 13, 2022
8:00 AM ET. IMF Global Policy Agenda published
8:30 AM ET. Unemployment Insurance Weekly Claims Report - Initial Claims
Jobless Claims (previous 219K)
Jobless Claims, Net Chg (previous +29K)
Continuing Claims (previous 1361000)
Continuing Claims, Net Chg (previous +15K)
8:30 AM ET. September Real Earnings
8:30 AM ET. September CPI
CPI, M/M% (previous +0.1%)
Core CPI, M/M% (previous +0.6%)
Energy Idx, M/M% (previous -5.0%)
Food Idx, M/M% (previous +0.8%)
Real Avg Wkly Pay-Infla Adj, M/M% (previous -0.1%)
CPI, Y/Y% (previous +8.3%)
Core Annual, Y/Y% (previous +6.3%)
10:30 AM ET. EIA Weekly Natural Gas Storage Report
Working Gas In Storage (Cbf) (previous 3106B)
Working Gas In Storage, Net Chg (Cbf) (previous +129B)
11:00 AM ET. EIA Weekly Petroleum Status Report
Crude Oil Stocks (Bbl) (previous 429.203M)
Crude Oil Stocks, Net Chg (Bbl) (previous -1.356M)
Gasoline Stocks (Bbl) (previous 207.46M)
Gasoline Stocks, Net Chg (Bbl) (previous -4.728M)
Distillate Stocks (Bbl) (previous 110.916M)
Distillate Stocks, Net Chg (Bbl) (previous -3.443M)
Refinery Usage (previous 91.3%)
Total Prod Supplied (Bbl/day) (previous 20.831M)
Total Prod Supplied, Net Chg (Bbl/day) (previous +0.061M)
2:00 PM ET. IMF Debate on the Global Economy
4:30 PM ET. Federal Discount Window Borrowings
4:30 PM ET. Foreign Central Bank Holdings
Friday, October 14, 2022
8:30 AM ET. September Advance Monthly Sales for Retail & Food Services
Overall Sales-SA, M/M% (previous +0.3%)
Sales, Ex-Auto, M/M% (previous -0.3%)
Sales, Ex-Auto & Gas, M/M% (previous +0.3%)
8:30 AM ET. September Import & Export Price Indexes
Import Prices (previous -1%)
Non-Petroleum Prices (previous -0.2%)
Petroleum Prices (previous -7.1%)
8:30 AM ET. U.S. Weekly Export Sales
10:00 AM ET. August Manufacturing & Trade: Inventories & Sales
Total Inventories (previous +0.6%)
10:00 AM ET. October University of Michigan Survey of Consumers - preliminary
Mid-Mo Sentiment (previous 59.5)
Mid-Mo Expectations (previous 59.9)
Mid-Mo Current Idx (previous 58.9)
The STOCK INDEXES? http://quotes.ino.com/ex?changes/?c=indexes
The STOCK INDEXES: The December NASDAQ 100 was lower overnight as it extends this year's decline. Overnight weakness sets the stage for a lower opening when the day session begins trading.Stochastics and the RSI are oversold but remain neutral to bearish signaling that sideways to lower prices are possible near-term. If December renews the decline off August's high, monthly support crossing at 10,027.00 is the next downside target. Closes above last-Thursday's high crossing at 11,729.75 would signal that a short-term low has been posted. First resistance is last-Thursday's high crossing at 11,729.75. Second resistance is the September 21st high crossing at 12,140.50. First support is the overnight low crossing at 10,853.25. Second support is monthly support crossing at 10,027.00.
The December S&P 500 was lower overnight as it extends the decline off last-Wednesday's high. Overnight trading sets the stage for a steady to lower opening when the day session begins trading. Stochastics and the RSI are becoming oversold but remain neutral to bearish signaling that sideways to lower prices are possible near-term. If December renews the decline off August's high, the 50% retracement level of the 2020-2022 rally on the monthly continuation chart crossing at 3491.65 is the next downside target. Closes above last-Wednesday's high crossing at 3820.00 would signal that a short-term low has been posted. First resistance is last-Wednesday's high crossing at 3820.00. Second resistance is the September 20th high crossing at 3936.25. First support is last-Monday's low crossing at 3571.75. Second support is the 50% retracement level of the 2020-2022 rally on the monthly continuation chart crossing at 3491.65.
INTEREST RATES http://quotes.ino.com/ex changes/?c=interest"
INTEREST RATES: December T-bonds were higher overnight as it consolidates some of the decline off last-Tuesday's high. The high-range overnight trade sets the stage for a steady to higher opening when the day session begins trading. Stochastics and the RSI are oversold but remain neutral to bearish signaling that sideways to lower prices are possible near-term. If December extends the decline off August's high, monthly support crossing at 118-21 is the next downside target. Closes above the 20-day moving average crossing at 127-31 would confirm that a short-term low has been posted. First resistance is last-Tuesday's high crossing at 129-12. Second resistance is the 50-day moving average crossing at 134-18. First support is Monday's low crossing at 123-21. Second support is monthly support crossing at 118-21.
December T-notes was slightly higher overnight as it consolidates some of the decline off last-Tuesday's high. Overnight trading sets the stage for a steady to higher opening when the day session begins trading. Stochastics and the RSI are oversold but remain neutral to bearish signaling that sideways to lower prices are possible near-term. If December extends the decline off August's high, the 75% retracement level of the 2000-2020 rally on the monthly continuation chart crossing at 105.157 is the next downside target. Closes above the 20-day moving average crossing at 112.263 would signal that a short-term low has been posted. First resistance is last-Tuesday's high crossing at 113.300. Second resistance is the 50-day moving average crossing at 115.298. First support is last-Wednesday's low crossing at 110.190. Second support is the 75% retracement level of the 2000-2020 rally on the monthly continuation chart crossing at 105.157.
ENERGY MARKETS? http://quotes.ino.com/ex?changes/?c=energy ""
ENERGIES:November crude oil was lower overnight as it consolidates some of the rally off September's low and is retesting the broken June-August downtrend line. Overnight trading sets the stage for a lower opening when the day session begins trading. Stochastics and the RSI are overbought and are poised to turn neutral to bearish with additional weakness that would signal a short-term top has been posted. Closes below the 20-day moving average crossing at $84.46 would signal that a short-term top has been posted. If November extends the rally off September's low, August's high crossing at $96.82 is the next upside target. First resistance is Monday's high crossing at $93.64. Second resistance is August's high crossing at $96.82. First support is the 50-day moving average crossing at $87.22. Second support is the 20-day moving average crossing at $84.46.
November heating oil was lower overnight as it consolidates some of the rally off September's low. Overnight trading sets the stage for a lower opening when the day session begins trading. Stochastics and the RSI are overbought but remain neutral to bullish signaling that sideways to higher prices are possible near-term. If November extends the rally off September's low, June's high crossing at 4.1671 is the next upside target. Closes below the 20-day moving average crossing at $3.4072 would signal that a short-term top has been posted. First resistance is Monday's high crossing at $4.0859. Second resistance is June's high crossing at $4.1671. First support is the 20-day moving average crossing at $3.4068. Second support is the 38% retracement level of the 2020-2022 rally crossing at $3.0693.
November unleaded gas was lower overnight as it consolidates some of the rally off September's low. Overnight trading sets the stage for a lower opening when the day session begins trading. Stochastics and the RSI are turning neutral to bearish signaling that sideways to lower prices are possible near-term. Closes below the 20-day moving average crossing at $2.4794 would signal that a short-term top has been posted. If November extends the rally off September's low, the July 29th high crossing at $2.8440 is the next upside target. First resistance is Monday's high crossing at $2.7685. Second resistance is the July 29th high crossing at $2.8440. First support is the 10-day moving average crossing at $2.5726. Second support is the 20-day moving average crossing at $2.4792.
November Henry natural gas was higher overnight. Overnight trading sets the stage for a higher opening when the day session begins trading. Stochastics and the RSI are oversold but remain neutral to bearish signaling that sideways to lower prices are possible near-term. If November renews the decline off August's high, the 87% retracement level of the June-August rally crossing at 6.048 is the next downside target. Closes above the 20-day moving average crossing at 7.210 would signal that a short-term low has been posted. First resistance is the 20-day moving average crossing at 7.210. Second resistance is the 50-day moving average crossing at 8.119. First support is the 87% retracement level of the June-August rally crossing at 6.048. Second support is July's low crossing at 5.465.
CURRENCIEShttp://quotes.ino.com/ex changes/?c=currencies"
CURRENCIES:The December Dollar was steady to slightly lower overnight. Overnight trading sets the stage for a steady to lower opening when the day session begins trading. Stochastics and the RSI are neutral to bullish signaling that a sideways to higher prices are possible near-term. If December renews the rally off August's low, September's high crossing at $114.745 is the next upside target.If December renews the decline off September's high, the 50-day moving average crossing at $109.161 is the next downside target. First resistance is September's high crossing at $114.745. Second resistance is monthly resistance crossing at $114.782. First support is the 50-day moving average crossing at $109.161. Second support is September's low crossing at $107.450.
The December Euro was steady to slightly higher overnight and sets the stage for a steady to slightly higher opening when the day session begins trading. Stochastics and the RSI are neutral to bearish signaling that sideways to lower prices are possible near-term. If December extends the decline off last-Tuesday's high crossing at $1.00545 would signal that a short-term top has been posted. Closes above last-Tuesday's high crossing at $1.00545 would confirm that a short-term low has been posted. First resistance is the 50-day moving average crossing at $1.00552. Second resistance is September's high crossing at $1.02650. First support is the overnight low crossing at $0.97185. Second support is last-last-Wednesday's low crossing at $0.95920.
The December British Pound was steady to slightly higher overnight and sets the stage for a steady to higher opening when the day session begins trading. Stochastics and the RSI are turning neutral to bearish signaling that sideways to lower prices are possible near-term. Monday's close below the 10-day moving average crossing at 1.1176 would signal that a short-term top has been posted. If December extends the decline off last-Wednesday's high, September's low crossing at 1.0392 is the next downside target. If December renews the rally off September's low, the 50-day moving average crossing at 1.1606 is the next upside target. First resistance is the 50-day moving average crossing at 1.1606. Second resistance is September's high crossing at 1.1759. First support is the overnight low crossing at 1.1010. Second support is September's low crossing at 1.0392.
The December Swiss Franc was steady to slightly lower overnight and sets the stage for a lower opening when the day session begins trading. Stochastics and the RSI are oversold but remain neutral to bearish signaling that sideways to lower possible near-term. If December renews the decline off September's high, the June low on the monthly continuation chart crossing at 1.00235 is the next downside target. Closes above the 20-day moving average crossing at 1.02806 would signal that a short-term low has been posted. First resistance is the 20-day moving average crossing at 1.02806. Second resistance is the 50-day moving average crossing at 1.04137. First support is the overnight low crossing at 1.00465. Second support is the June low on the monthly continuation chart crossing at 1.00235.
The December Canadian Dollar was steady to lower overnight. The high-range overnight trade sets the stage for a steady to slightly lower opening when the day session begins trading. Stochastics and the RSI are becoming oversold but remain neutral to bearish signaling that sideways to lower prices are possible near-term. If December extends the decline off April's high, the 87% retracement level of the 2020-2021 rally crossing at $70.24 is the next downside target. Closes above the 20-day moving average crossing at $73.78 would confirm that a short-term low has been posted. First resistance is the 20-day moving average crossing at $73.78. Second resistance is the September 20th high crossing at $75.62. First support is the 75% retracement level of the 2020-2021 rally crossing at $72.14. Second support is the 87% retracement level of the 2020-2021 rally crossing at $70.24.
The December Japanese Yen was slightly higher overnight as it extends the September-October trading range. Overnight trading sets the stage for a slightly higher opening when the day session begins trading. Stochastics and the RSI oversold but remain neutral to bearish signaling that sideways to lower prices are possible near-term. If December extends this year's decline, is long-term support crossing at 0.065720 is the next downside target. Closes above the September 22nd high crossing at 0.071895 would signal that a short-term low has been posted. First resistance is the September 22nd high crossing at 0.071895. Second resistance is the 50-day moving average crossing at 0.072162. First support is the September 22nd low crossing at 0.069150. Second support is long-term support crossing at 0.065720.
PRECIOUS METALS http://quotes.ino.com/ex changes/?c=metals"
PRECIOUS METALS: Decembergold was steady to slightly higher overnight. Overnight trading sets the stage for a steady to slightly higher opening when the day session begins trading. Stochastics and the RSI are neutral to bearish signaling that sideways to lower prices are possible near-term. Closes above the 50-day moving average crossing at $1730.90 would open the door for a larger-degree rebound during the first half of October. If December extends the decline off last-Tuesday's high, September's low crossing at $1622.20 is the next downside target. First resistance is the 50-day moving average crossing at $1730.90. Second resistance is the August 25th high crossing at $1778.80. First support is September's low crossing at $1622.20. Second support is the 62% retracement level of the 2016-2020 rally on the weekly chart crossing at $1610.30.
December silver was steady to lower overnight. The low-range overnight trade sets the stage for a steady to lower opening when the day session begins trading later this morning. Stochastics and the RSI are neutral to bearish signaling that sideways to lower prices are possible near-term. Closes below the 50-day moving average crossing at 19.472 would open the door for a possible test of September's low crossing at 17.400. If December renews the rally off September's low, the 50% retracement level of the March-August decline crossing at $22.448 is the next upside target. First resistance is the 38% retracement level of the March-August decline crossing at $21.248. Second resistance is 50% retracement level of the March-August decline crossing at $22.448. First support is the September 28th low crossing at $17.895. Second support is the September low crossing at 17.400.
December copper was slightly lower overnight and sets the stage for a slightly lower opening when the day session begins trading. Stochastics and the RSI are turning neutral to bearish signaling that sideways to lower prices are possible near-term. If December renews the decline off August's high, July's low crossing at 3.1355 is the next downside target. Closes above the 50-day moving average crossing at 3.5237 would confirm that a short-term low has been posted. First resistance is the 50-day moving average crossing at 3.5237. Second resistance is the September 13th high crossing at 3.6925. First support is September's low crossing at 3.2430. Second support is July's low crossing at 3.1355.
GRAINS http://quotes.ino.com/ex changes/?c=grains
December corn was slightly higher overnight as it extends Monday's rally and is challenging psychological resistance crossing at $7.00. Overnight trading sets the stage for a steady to higher opening when the day sessions begins trading. Stochastics and the RSI are neutral to bullish signaling that sideways to higher prices are possible near-term. If December extends the rally off July's low, the 75% retracement level of the May-July decline crossing at $7.15 is the next upside target. Closes below last-Friday's low crossing at $6.71 1/2 would open the door for a possible test of the 50-day moving average crossing at $6.58 1/4 is the next downside target. First resistance is Monday's high crossing at $7.06 1/2. Second resistance is the 75% retracement level of the May-July decline crossing at $7.15. First support is last-Friday's low crossing at $6.71 1/2. Second support is the 50-day moving average crossing at $6.58 1/4.
December wheat was lower overnight as it consolidates some of Monday's huge rally. Overnight trading sets the stage for a lower opening when the day session begins trading. Stochastics and the RSI are neutral to bullish signaling that sideways to higher prices are possible near-term. If December renews the rally off August's low, the 50% retracement level of the May-August decline crossing at $10.15 is the next upside target. Closes below last-Friday's low crossing at $8.72 1/2 would signal that a short-term top has been posted. First resistance is the 38% retracement level of the May-August decline crossing at $9.50 1/2. Second resistance is the 50% retracement level of the May-August decline crossing at $10.15. First support is last-Friday's low crossing at $8.72 1/2. Second support is the 50-day moving average crossing at $8.42 1/4.
December Kansas City wheat was lower overnight as it consolidates some of Monday's rally. Overnight trading sets the stage for a lower opening when the day session begins trading later this morning. Stochastics and the RSI have turned neutral to bullish signaling that sideways to higher prices are possible near-term. If December extends the rally off August's low, the 50% retracement level of the May-August decline crossing at $10.93 1/2 is the next upside target. Closes below the 20-day moving average $9.66 1/4 would signal that a short-term top has been posted while opening the door for additional weakness near-term. First resistance is the 38% retracement level of the May-August decline crossing at $10.26 3/4. Second resistance is the 50% retracement level of the May-August decline crossing at $10.93 1/2. First support is the 20-day moving average $9.66. Second support is the 50-day moving average crossing at $9.14.
December Minneapolis wheat was lower overnight as it consolidates some of Monday's rally. Overnight trading sets the stage for a lower opening when the day session begins trading. Stochastics and the RSI are neutral to bullish signaling that sideways to higher prices are possible near-term. If December extends the rally off August's low, the July 11th high crossing at $10.56 1/4 is the next upside target. Closes below the 20-day moving average crossing at $9.62 3/4 would signal that a short-term top has been posted while opening the door for additional weakness near-term. First resistance is Monday's high crossing at $10.24 1/4. Second resistance is the July 11th high crossing at $10.56 1/4. First support is the 20-day moving average crossing at $9.62 3/4. Second support is the 50-day moving average crossing at $9.29 1/2.
SOYBEAN COMPLEX? http://quotes.ino.com/ex?changes/?c=grains "
November soybeans were steady to lower overnight. Overnight strength sets the stage for a lower opening when the day session begins trading. Stochastics and the RSI are oversold but remain neutral to bearish signaling that sideways to lower prices are possible near-term. If November extends the decline off September's high, July's low crossing at $12.88 1/2 is the next downside target. Closes above the 50-day moving average crossing at $14.17 1/2 would signal that a short-term low has been posted. First resistance is the 50-day moving average crossing at $14.17 1/2. Second resistance is the September 21st high crossing at $14.88 3/4. First support is last-Thursday's low crossing at $13.50. Second support is July's low crossing at $12.88 1/2.
December soybean meal was steady to slightly lower overnight as it consolidates some of the rally off last-Friday's low. The mid-range overnight trade sets the stage for a steady to lower opening when the day session begins trading. Stochastics and the RSI are oversold but are turning neutral to bullish signaling that a low might be in or is near. Closes above the 20-day moving average crossing at $414.80 would signal that a short-term low has been posted. If December extends the decline off September's high, the July 22nd low crossing at $380.80 is the next downside target. First resistance is the 50-day moving average crossing at $413.80. Second resistance is the 20-day moving average crossing at $414.80. First support is last-Friday's low crossing at $391.90. Second support is the July 22nd low crossing at $380.80.
December soybean oil was lower overnight as it consolidates some of the rally off September's low. The low-range overnight trade sets the stage for a lower opening when the day session begins trading. Stochastics and the RSI are overbought and are turning neutral to bearish signaling that sideways to lower prices are possible near-term. Closes below the 10-day moving average crossing at 64.51 would signal that a short-term top has been posted. If December extends the rally off September's low, the August 12th high crossing at 68.16 is the next upside target. First resistance is the September 13th high crossing at 68.00. Second resistance is the August 12th high crossing at 68.16. First support is September's low crossing at 60.75. Second support is the August 4th low crossing at 60.20.
Thanks tallpine!
Wheat shot up Monday from the bombing of Ukraine, with help from the drought in the Plains.
News of wheat coming out of Ukraine has wheat much lower today.
Wheat Plunges Overnight; Around 100 Ships From Ukraine Lined Up For Inspection
https://www.agriculture.com/news/three-big-things/3-big-things-today-october-11-2022
HRW planting and germination out this afternoon will be interesting.
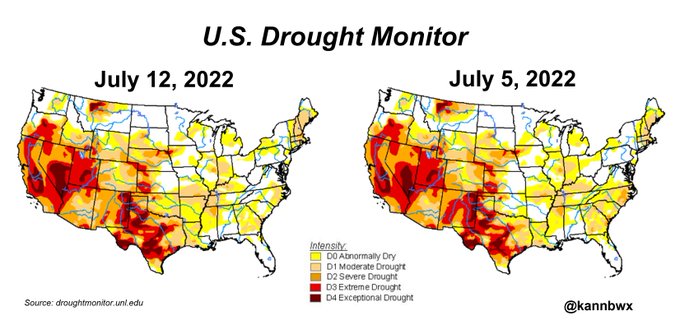
Here's the drought and the outlook:
Soilmoisture anomaly:
These maps sometimes take a day to catch up to incorporate the latest data(the bottom map is only updated once a week).
https://www.cpc.ncep.noaa.gov/products/Soilmst_Monitoring/US/Soilmst/Soilmst.shtml#
![]()


++++++++++++++++++++++++++++
https://mrcc.purdue.edu/cliwatch/watch.htm#curMonths

October 4, 2022 Below
Drought worsening!!
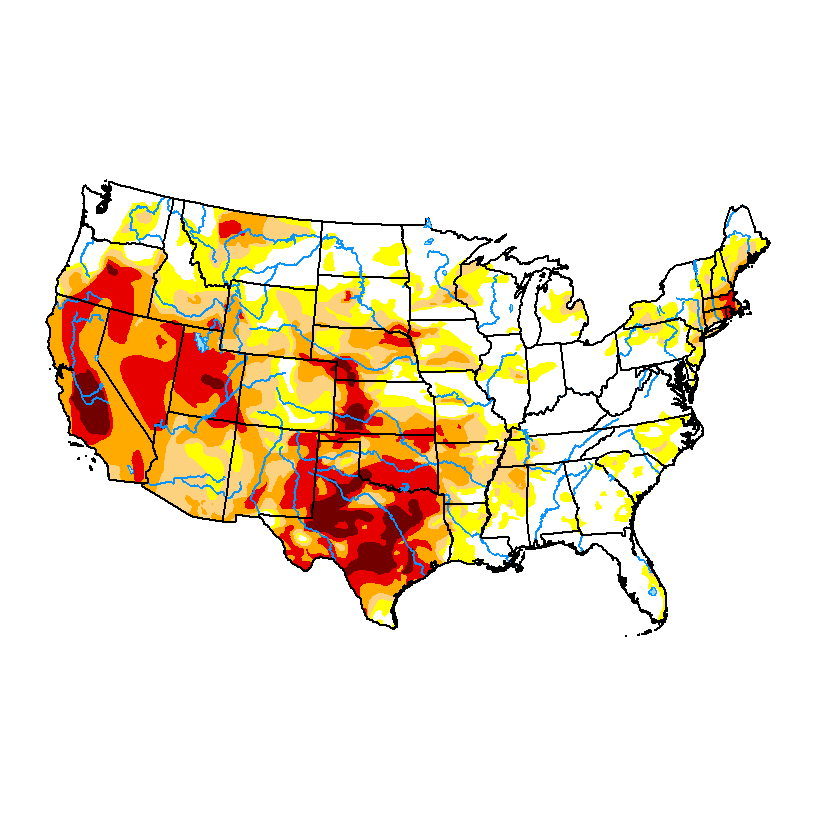
https://droughtmonitor.unl.edu/Maps/CompareTwoWeeks.aspx

AUGUST 16, 2022 BELOW
Drought is worse in the WCB compared to 3 weeks earlier
July 26, 2022-update
U.S. Drought Monitor
https://droughtmonitor.unl.edu/Maps/CompareTwoWeeks.aspx

Drought monitor previous years:
+++++++++++++++++