
Please continue NG related discussions here.
Thanks much Larry!
Here's the link to the previous NG thread with the last couple of posts to include the significant graphs.
https://www.marketforum.com/forum/topic/88807/
10-21-22
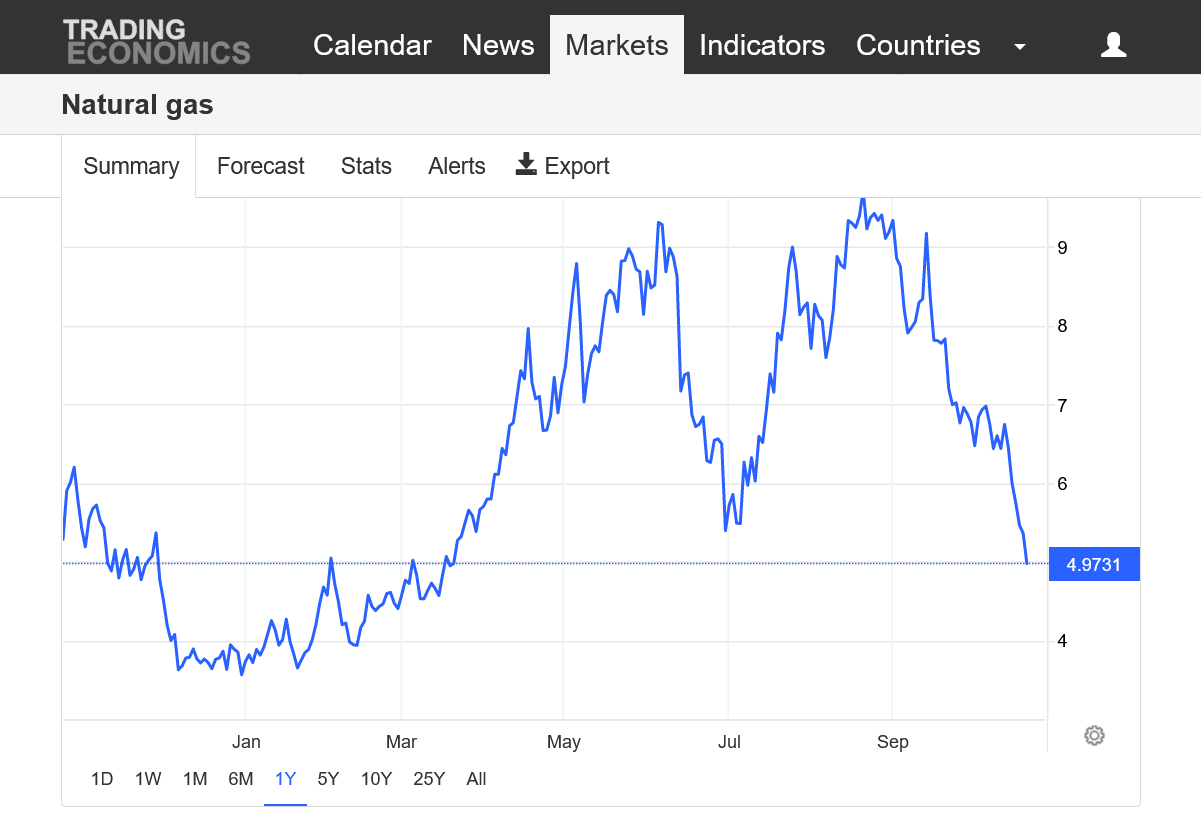
2 weeks ago, yesterday just before the first incredibly bearish, 129 BCF injection from the EIA, natural gas was trading $22,000/contract higher than this! I just went back and reviewed the last 2+ weeks. Pretty amazing period in natural gas history with these injections.
Also, this got me wondering what sector of traders pushed us down this far so fast? So I found this awesome site that shows, not just prices but the COT. Unfortunately, it doesn't look possible to cut/paste there stuff to do an analysis here but here's the link: https://www.barchart.com/futures/quotes/NG*0/interactive-chart?cot=true
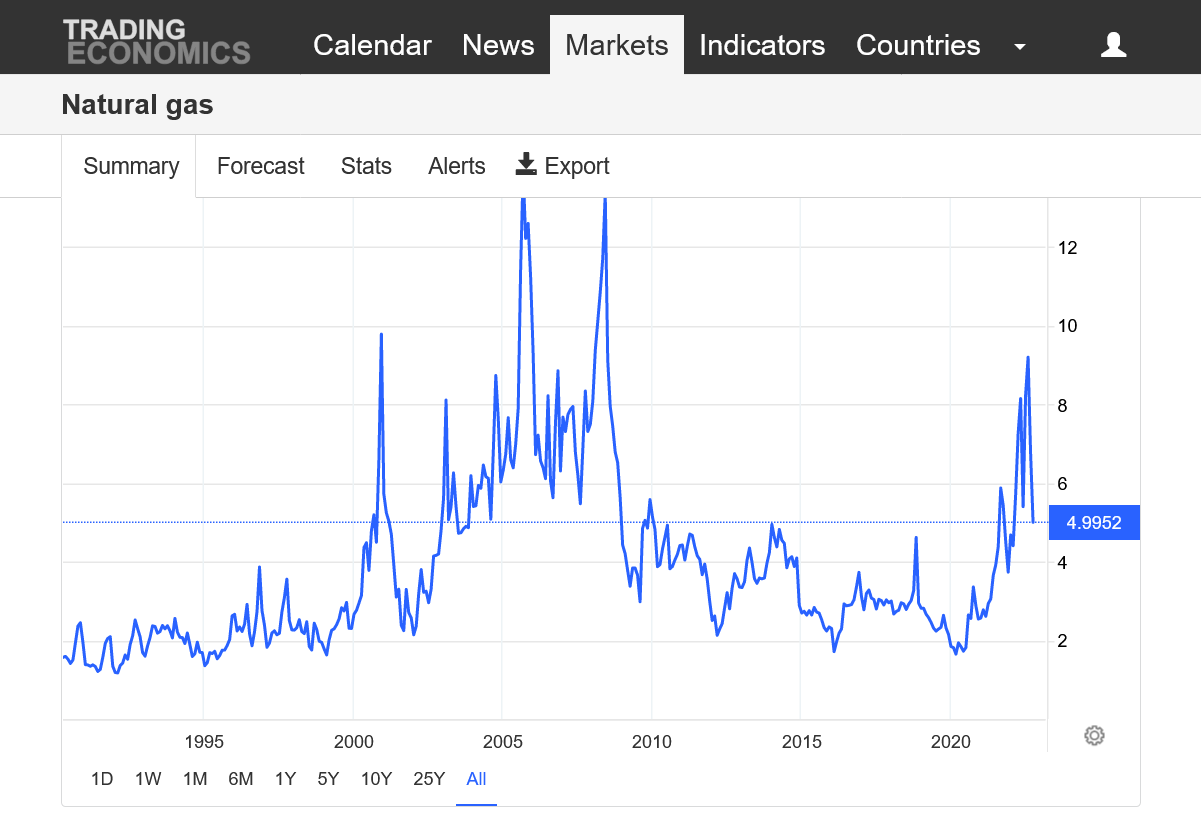
With the 2 highs, first in June, then August at $10, we clearly had a double top. Here, 2 months later, ng is trading $50,000/contract less and half that price, below $5. That's never happened before in history. The gap lower on Sunday night, below support at $6.3 was a huge downside break out. With todays additional -4,000/contract, ng has is almost $15,000/contract less than last Friday. Dang, wish I could copy those charts. I'll find others.
Ice, COT report. I've never followed this and don't have time to figure it out at the moment but am posting the link for future reference: https://www.cftc.gov/dea/futures/nat_gas_lf.htm
++++++++++++++++++
Here's some great charts. They don't show gaps, like the one we had Sunday Night. I just realized that we don't show ng price charts much and its been a huge oversight on my part. Sorry about that. I shrunk them to reduce space.
https://tradingeconomics.com/commodity/natural-gas
+++++++++++
Facing ‘Bearish Weather Headwinds,’ Natural Gas Futures Continue Retreat
With more mild early winter weather on tap, and with storage refilling quickly, natural gas futures added to their recent losses in early trading Monday. Coming off a 39.9-cent sell-off in the previous session, the November Nymex contract was down 6.1 cents to $4.898/MMBtu at around 8:45 a.m. ET. Plummeting futures prices reflect a market…
+++++++++++++++++
NG has had a few more HDDs on recent model runs, though the pattern overall is still above average temps. It's reversed higher this morning. The price is down $50,000/contract since the Summer highs, down 50%, so at some point it has to stop going lower no matter how bearish the injections and weather.
Front month expiration is on Thursday-27th too and I noted that December now has more volume than the expiring November. https://www.energygps.com/HomeTools/ExpiryCalendar
| Expiry Calendar - 10/21/2022 to 12/31/2023 | ||||
| Crude Oil Futures | NY Harbor ULSD Futures | Henry Hub Natural Gas Futures | RBOB Gasoline Futures | |
| Contract Month | CL | HO | NG | RB |
| Nov 2022 (X) | 10/20/2022 | 10/31/2022 | 10/27/2022 | 10/31/2022 |
Natural gas rig count has been increasing from the record low number of 69 in the Summer of 2020.
https://ycharts.com/indicators/us_gas_rotary_rigs
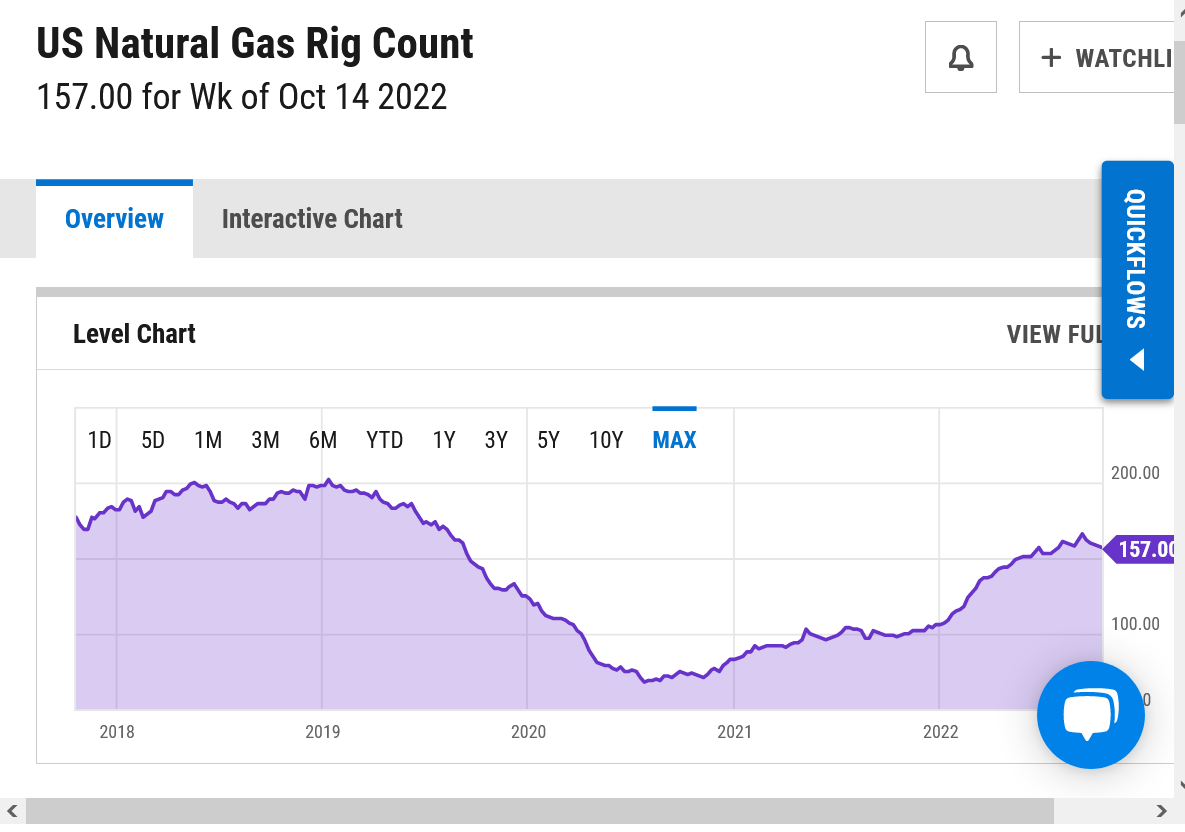
Here's a really good site with data going back 35 years! September 2008 at 1,585 rigs was the peak for natural gas rigs, when the price was in the double digits BEFORE horizontal wells had replaced most of the GOM wells.
https://www.eia.gov/dnav/ng/ng_enr_drill_s1_m.htm
https://www.eia.gov/dnav/ng/hist/e_ertrrg_xr0_nus_cm.htm
.png)
7 day temps from last week. Big chill in the eastern half of the country, where the most people live, using ng for heating. This assures us of a much less robust injection vs the previous monster, 3 digit additions to storage.
The 5 straight 100+ injection streak is coming to an end. This has got to be a record! What do you say, Larry?
https://www.cpc.ncep.noaa.gov/products/tanal/temp_analyses.php

+++++++++++++++++++++++
Look at the blue line below taking a sharp turn upwards to close the storage gap/deficit with previous years as supplies are gushing in!
https://ir.eia.gov/ngs/ngs.html
 ++++++++++++++++++++++++
https://www.investing.com/economic-calendar/natural-gas-storage-386
Latest Release Oct 20, 2022 Actual 111B Forecast 105B Previous 125B
| Release Date | Time | Actual | Forecast | Previous | |
|---|---|---|---|---|---|
| Oct 20, 2022 | 10:30 | 111B | 105B | 125B | |
| Oct 13, 2022 | 10:30 | 125B | 123B | 129B | |
| Oct 06, 2022 | 10:30 | 129B | 113B | 103B | |
| Sep 29, 2022 | 10:30 | 103B | 94B | 103B | |
| Sep 22, 2022 | 10:30 | 103B | 93B | 77B | |
| Sep 15, 2022 | 10:30 | 77B | 73B | 54B |
Natural Gas Futures Recover Some Ground as Weather Model Adds Modest Demand
Stronger cash prices, short-covering and caffeine following late-night celebrations as the Houston Astros swept the New York Yankees to advance to their fourth World Series in six years. Those were among the myriad reasons market observers gave for Monday’s recovery along the Nymex natural gas futures curve. At A Glance: HDDs added to long-range forecasts…
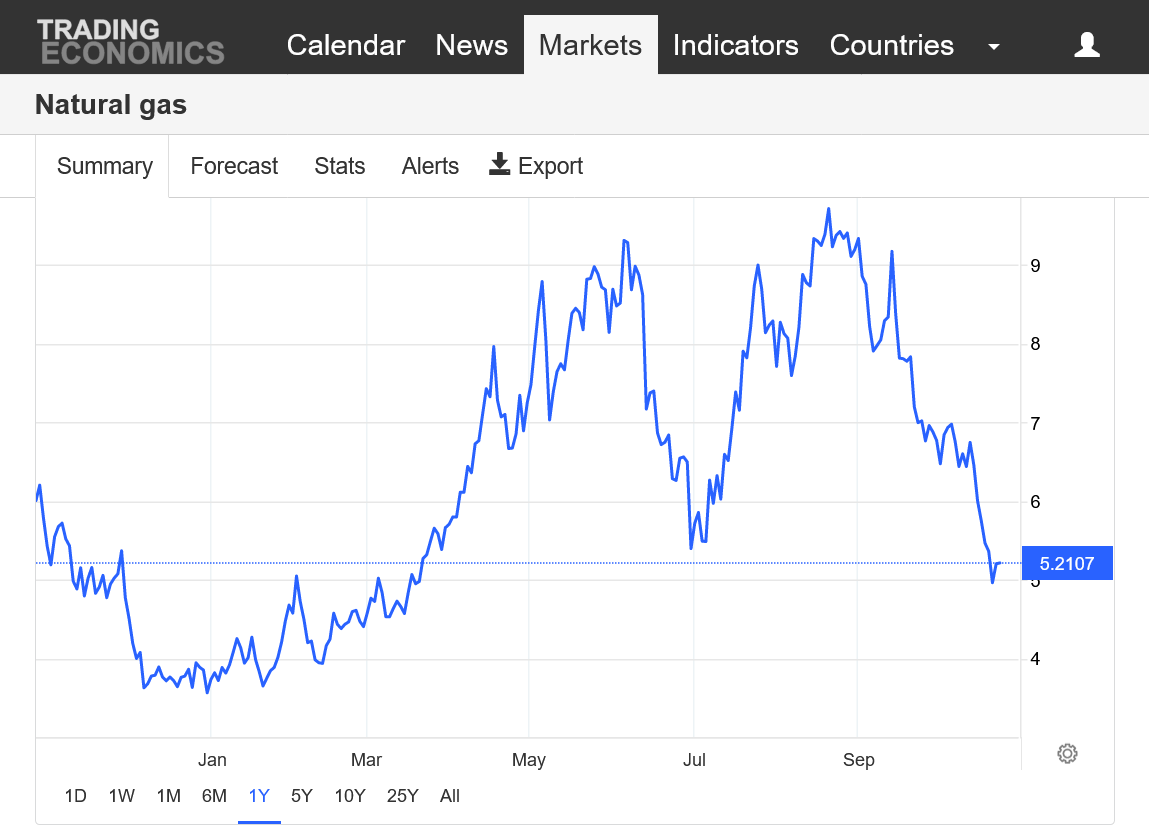
Natural gas has been trading the complete opposite of the 20 year seasonal below. After hitting a double top in late August, NG plunged 50% and lost an amazing $50,000/contract.
https://charts.equityclock.com/natural-gas-futures-ng-seasonal-chart
https://tradingeconomics.com/commodity/natural-gas
FERC is projecting elevated U.S. natural gas prices for the 2022-2023 winter, despite mild weather forecasts for most of the country and steadily rising domestic production.
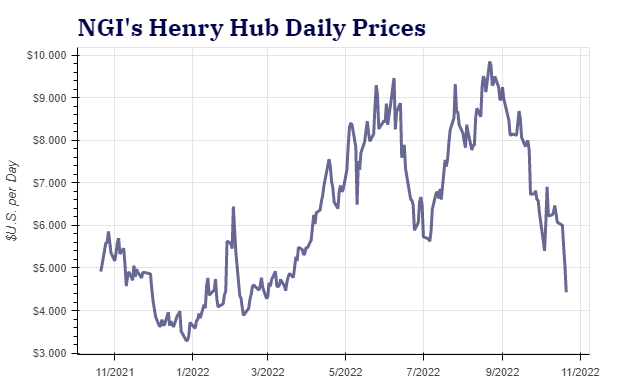
“Natural gas prices for the upcoming winter are expected to remain higher than recent years at major trading hubs across the U.S.,” Federal Energy Regulatory Commission staff said in the Winter Energy Market and Reliability Assessment for 2022-2023 released last week.
Although production growth is likely to outpace that of domestic demand this winter, rising net exports – namely LNG — “will place additional pressure on natural gas prices this winter,” researchers said.
They cited winter strip pricing for Henry Hub natural gas that stood at $6.82/MMBtu as of Oct. 12, or about 30% higher than last winter’s settled price. NGI’s Forward Look showed Henry Hub gas for the balance of winter trading at $5.727 as of Friday (Oct. 21).
“Winter 2022-2023 demand for natural gas is expected to increase 2.4% over winter 2021-2022 levels to 121.2 Bcf/d,” staff said, “driven primarily by growth in demand for natural gas exports.”
The anticipated export growth is mainly because of the increase in liquefied natural gas export capacity over the last year, “as well as increased pipeline exports to Mexico.”
New England Volatility
Since New England is the only U.S. region that relies meaningfully on LNG imports, it is the most susceptible to volatility in global LNG prices, as it must compete for volumes with Europe and Asia, FERC said. As a result, “natural gas supply is expected to remain constrained in New England this winter, leading to higher natural gas and electricity prices.”
They cited that for the second winter in a row, the Algonquin Citygate hub outside of Boston “has the largest year-over-year futures price increase” of any hub in the country.
NGI Forward Look data showed the Algonquin Citygate balance of winter price at $20.222 as of Friday.
New England is not alone, however, as “winter futures prices at all major demand hubs currently reflect large year-over-year increases,” researchers said. “Similarly, futures prices at supply hubs also reflect year-over-year increases for winter 2022-2023.”
FERC’s assessment said “Natural gas pipelines in California may also face constraints this winter due to ongoing pipeline outages.”
Production, Inventories Rising
Meanwhile, dry natural gas production is forecast to increase over the winter period by 3.2% above winter 2021-2022 levels to 99.1 Bcf/d, researchers said.
“The expected increase in production is due to high natural gas and crude oil prices leading to a rising number of natural gas-directed rigs and greater natural gas produced in association with oil from oil wells,” FERC staff said.
Natural gas storage levels, another key input for prices, remain below the five-year average, although the deficit has been narrowing. The week ended Oct. 14 saw a fifth consecutive triple-digit Bcf injection into storage.
The natural gas storage withdrawal season, which takes place from November to March, is forecast to see withdrawals totaling 2 Tcf, or 11.1% less than the 2021-2022 withdrawal serason, according to FERC.
“The reduced withdrawals will partially offset the anticipated gains in production and contribute to continuing supply-demand tightness,” researchers said.
Manipulators Beware
FERC also will be keeping a close eye on market manipulation in the natural gas markets this winter with prices expected to be higher than last year, Chairman Richard Glick said Thursday upon FERC’s release of the winter assessment.
A FERC investigation found “anomalies” in the natural gas markets during Winter Storm Uri in 2021 that may have been caused by market manipulation, according to Glick.
“The impacts of rising natural gas prices on consumers are top of mind” heading into this winter, Glick said. “Although FERC does not regulate natural gas prices, we do have authority to address market manipulation and we intend to remain particularly watchful during this period of inflation and high price sensitivity.”
Balmy Temperatures Ahead?
Researchers highlighted that the National Oceanic and Atmospheric Administration (NOAA) is forecasting above average temperatures this winter in most of the country, except for the Pacific Northwest and West-North Central region.
The NOAA forecast for December through February suggests a 50-80% likelihood of higher-than-average temperatures in Southern California, the Desert Southwest, Texas and the Eastern Seaboard, researchers said.
The warm overall forecast implies “lower-than average electric and natural gas demand, although a prolonged cold weather event nevertheless could cause disruptions and price impacts, even within the context of a warmer winter,” researchers said.
U.S. electricity markets, meanwhile, “are projected to have adequate amounts of generating capacity to maintain reliable operations this winter, though grid operators in certain regions may face challenges during periods of extreme weather,” according to the assessment.
Oct 25, 2022
Editor’s Note: In this five-part series, NGI is taking an indepth review of natural gas utility rates across the country and how – and why – they have escalated since 2021. Part 1delves into the escalating consumer costs in New York and New England. Part 2focuses on how natural gas rates on the West Coast have risen. Part 3 will take a look at the costs consumers will be paying in the Southeast and Florida, which takes into account the fallout from Hurricane Ian. Part 4takes a trip to the Appalachian Basin and how rates there are responding to winter fears, while Part 5 takes a dive into what consumers can expect in the coming months in the Midcontinent.
Black Hills Corp. also announced in mid-October its Colorado intrastate natural gas pipeline, Rocky Mountain Natural Gas LLC (RMNG) filed with the state’s PUC for a rate review that would aim to boost annual revenue by $12.3 million.
“This rate review request reflects our commitment to our Colorado customers to deliver safe, reliable and cleaner natural gas service,” said Black Hills CEO Linn Evans. “This investment in our system, combined with excellent operational execution by our team, supports our ability to safely transport natural gas to various delivery points throughout western Colorado and reduces emissions through a more resilient and modern pipeline system.”
According to the company, Black Hills Energy has invested more than $120 million in safety and integrity for its 600-mile natural gas infrastructure in Colorado since its last rate review in 2017.
NGI’s Patrick Rau, director of strategy and research, noted that infrastructure in the Rockies complicates natural gas prices in the region.
“It’s not very economic to ship production out of the Rockies to other places in the U.S. right now, so the Rockies is seeing a lot of gas-on-gas competition from other regions,” Rau said.
“Part of it is…some producers are just focusing their efforts in other parts of the country…And with all this focus, particularly from publicly traded producers to increase their returns on invested capital, they’re going to logically focus on more profitable areas as much as they can, and I think the Rockies has suffered because of that. That, and the fact that it’s just not economic to ship gas from the Rockies to other areas of the country right now.
“So those utilities are looking at less supply in their own backyard.”
Another challenge facing the Rockies is that, “Production continues to decline there,” Rau said. As of early October, production was down about 8% year/year. “To put that in perspective, in Oklahoma and Kansas, that’s down 1% year/year, and that’s the next biggest decline.”
Meanwhile, Black Hills Energy’s Arkansas branch received approval from the Arkansas Public Service Commission (PSC) for new rates to recover $220 million from investments made since 2018 on its 7,200-mile natural gas infrastructure.
OG&E cited multiple factors that led up to its hefty under-collected fuel cost balance, including costs incurred during Winter Storm Uri of 2021 and rapid increases in the price of natural gas since May 2022.
The utility last set its FCA factors in March 2022, in part to recover an under-recovery balance of $164 million. However, the utility began to see increases in the price of gas over the summer that approached nearly “three times the average natural gas price included in OG&E’s March FCA factors,” the utility noted in a filing. “In the month of September alone, daily spot prices of natural gas ranged from $4.62/MMBtu to $8.70/MMBtu across the pipelines OG&E utilizes.”
Through September, OG&E paid about $467 million more than it received from customers for its fuel and Southwest Power Pool (SPP) Integrated Market purchases.
The utility noted it “specifically avoided” implementing an interim FCA factor to begin recovering costs “in the middle of the high usage summer period. It was important to OG&E to wait until the weather started to cool so that customer usage was lower, and this fuel increase would not result in even higher summer bills.”
The SPP set five new peak load records last summer.
“Second, OG&E was hopeful that natural gas prices…would moderate over the summer and OG&E would see less volatility in those costs. Obviously, this did not happen, and natural gas prices continued to climb throughout the summer,” the utility said in a filing.
Following an exceptionally hot summer, “prices have been coming down lately,” Rau said.
“Production has really ramped up…We’re consistently getting days with 100 Bcf/d or more in production now, and I don’t think that was quite on the radar screen for this year, so there has certainly been a supply response to the increase in prices and that’s starting to have an impact.”
In addition, with the lingering threat of a recession, there is “potential that could reduce demand,” and thus prices, “a little bit,” Rau added.
What’s more, “we have seen some pretty good storage injections these last few weeks” to go along with “some good production…our year/year and five-year deficits in storage levels, they continue to shrink,” he said. “We’re still below where we need to be, where we are on average going into this winter, but things have certainly improved quite dramatically, over the last few weeks.”
Big spike down early from the 0z Euro being -3 HDDs, then the 06z GFS ensemble, which had been cooler recently, being a whopping -11 HDDs milder and agreeing with the very mild Euro solutions this week.
Front month December expires tomorrow, usually good for some price spike fireworks several days before expiration day.
Also, the EIA report out tomorrow will NOT be nearly as robust as the previous 5, triple digit injections. https://www.marketforum.com/forum/topic/89973/#89981
NG has come all the way back from steep losses early this morning. The about to expire November is actually positive with the December just below unch.
https://ir.eia.gov/ngs/ngs.html
for week ending October 21, 2022 | Released: October 27, 2022 at 10:30 a.m. | Next Release: November 3, 2022
+ 52 BCF Slightly bullish vs the estimates
| Working gas in underground storage, Lower 48 states Summary text CSV JSN | |||||||||||||||||||||||||
|---|---|---|---|---|---|---|---|---|---|---|---|---|---|---|---|---|---|---|---|---|---|---|---|---|---|
| Historical Comparisons | |||||||||||||||||||||||||
| Stocks billion cubic feet (Bcf) | Year ago (10/21/21) | 5-year average (2017-21) | |||||||||||||||||||||||
| Region | 10/21/22 | 10/14/22 | net change | implied flow | Bcf | % change | Bcf | % change | |||||||||||||||||
| East | 825 | 812 | 13 | 13 | 882 | -6.5 | 893 | -7.6 | |||||||||||||||||
| Midwest | 1,007 | 987 | 20 | 20 | 1,048 | -3.9 | 1,054 | -4.5 | |||||||||||||||||
| Mountain | 199 | 195 | 4 | 4 | 212 | -6.1 | 214 | -7.0 | |||||||||||||||||
| Pacific | 248 | 249 | -1 | -1 | 255 | -2.7 | 290 | -14.5 | |||||||||||||||||
| South Central | 1,116 | 1,099 | 17 | 17 | 1,139 | -2.0 | 1,140 | -2.1 | |||||||||||||||||
| Salt | 277 | 271 | 6 | 6 | 301 | -8.0 | 295 | -6.1 | |||||||||||||||||
| Nonsalt | 839 | 828 | 11 | 11 | 838 | 0.1 | 845 | -0.7 | |||||||||||||||||
| Total | 3,394 | 3,342 | 52 | 52 | 3,536 | -4.0 | 3,591 | -5.5 | |||||||||||||||||
Totals may not equal sum of components because of independent rounding. | |||||||||||||||||||||||||
Working gas in storage was 3,394 Bcf as of Friday, October 21, 2022, according to EIA estimates. This represents a net increase of 52 Bcf from the previous week. Stocks were 142 Bcf less than last year at this time and 197 Bcf below the five-year average of 3,591 Bcf. At 3,394 Bcf, total working gas is within the five-year historical range.
For information on sampling error in this report, see Estimated Measures of Sampling Variability table below.
 +++++++++++++++
Latest Release Oct 27, 2022 Actual 52B Forecast 59B Previous 111B
https://www.investing.com/economic-calendar/natural-gas-storage-386
| Release Date | Time | Actual | Forecast | Previous | |
|---|---|---|---|---|---|
| Oct 27, 2022 | 10:30 | 52B | 59B | 111B | |
| Oct 20, 2022 | 10:30 | 111B | 105B | 125B | |
| Oct 13, 2022 | 10:30 | 125B | 123B | 129B | |
| Oct 06, 2022 | 10:30 | 129B | 113B | 103B | |
| Sep 29, 2022 | 10:30 | 103B | 94B | 103B | |
| Sep 22, 2022 | 10:30 | 103B | 93B | 77B |
The U.S. Energy Information Administration (EIA) on Thursday reported a 52 Bcf injection into natural gas storage for the week ended Oct. 21. The result came in below already modest market expectations and had little immediate impact on Nymex natural gas futures. Following a spate of benign weather and robust production that reached a record…
++++++++++++++
Maybe we should call the injection NOT AS bearish as the previous bearish surprises may have had the market giving estimates TOO bearish. For the amount of cold that we had over a huge key, high population/demand last week, I wouldn't call that injection bullish compared to previous years. November is expiring in 30 minutes.
+++++++++++
HDDs have been falling the past 24 hours on most models. A solidly bearish wx outlook!
Natural gas futures retreated in early trading Friday amid a continued absence of impressive early winter heating demand in the latest forecasts. The December Nymex contract was down 17.3 cents to $5.702/MMBtu at around 8:50 a.m. ET. Weather models trended cooler overnight, but the outlook had been “about as bearish as it could be,” making…
+++++++++++++++
0z Euro was actually +3 HDDs but 6z GFS dropped a bearish bomb with -7 HDDs and we've been -$3,000/contract since then. No sign of cold looking out thru the month of November, so the storage deficit with previous years will continue to rapidly close......BEARISH! Note this year's blue line below turning up and catching up with the darker line above it. At this fill rate, we could catch up to the 5 year average by the end of November which means gaining +197 BCF! We should note that natural gas exports will be resuming soon from the repaired export facility which will gobble up some of the recent excess.

LITTLETON, Colo., Oct 27 (Reuters) - Sales of U.S. "freedom gas" are on track to smash volume and earnings records in 2022, but the stellar short-term gains for exporters may have long-term consequences for the entire U.S. energy sector due to the resulting higher natural gas prices.
Total U.S. liquefied natural gas (LNG) exports jumped nearly 11% in the first 10 months of 2022 from the same period in 2021, Kpler data shows, but soared nearly 150% to Europe as desperate buyers there paid top dollar to replace reduced Russian pipelined supplies.

Those higher European purchases have affected far more than just the gas exporters who raked in record profits.
The entire U.S. power market has been churned by the resulting rise in domestic gas costs, which have averaged 85% more through October than in the same period last year.
LITTLETON, Colo., Oct 27 (Reuters) - Sales of U.S. "freedom gas" are on track to smash volume and earnings records in 2022, but the stellar short-term gains for exporters may have long-term consequences for the entire U.S. energy sector due to the resulting higher natural gas prices.
Total U.S. liquefied natural gas (LNG) exports jumped nearly 11% in the first 10 months of 2022 from the same period in 2021, Kpler data shows, but soared nearly 150% to Europe as desperate buyers there paid top dollar to replace reduced Russian pipelined supplies.

Revenues from that export bonanza have been equally eye-catching, topping $25 billion through July, according to the latest data from the U.S. Energy Information Administration (EIA), compared with just over $13 billion in the same slot in 2021.
Those higher European purchases have affected far more than just the gas exporters who raked in record profits.

The entire U.S. power market has been churned by the resulting rise in domestic gas costs, which have averaged 85% more through October than in the same period last year.
Natural gas is by far the largest power source in the United States, accounting for 37.1% of power generation across the lower 48 states through Oct. 24, EIA data shows.

As the brisk LNG export pace and uptick in local use resulted in reduced supplies for domestic consumers, U.S. gas prices have trended higher, averaging $6.60 per MMBtu through Oct. 24 compared with $3.56 for the same period last year.
Forward markets suggest prices will stay elevated well into 2023, with benchmark prices for LNG in Asia holding sharply above U.S. domestic prices through the end of next year, presenting sustained profit-making opportunities for LNG exporters.

At the same time, however, the sustained stretch of above-normal gas prices is likely to spur substitution toward lower- cost alternatives by utilities, households and businesses alike.
According to the EIA's Annual Energy Outlook for 2022, which estimated costs for electricity from new facilities entering service in 2024, the levelized cost of electricity from a natural gas plant already exceeded that from onshore wind and standalone solar installations.
EIA estimates LNG exports will increase to 12.47 Bcfd in the first quarter of 2023
++++++++++++++++++++
12.5 BCF/day is almost 375 BCF/month or 4,489 BCF/year. That's a lot of LNG!
https://www.eia.gov/naturalgas/weekly/


| U.S. natural gas supply - Gas Week: (10/20/22 - 10/26/22) | |||
|---|---|---|---|
| Average daily values (billion cubic feet) | |||
| this week | last week | last year | |
| Marketed production | 111.1 | 110.6 | 106.6 |
| Dry production | 99.1 | 98.6 | 96.5 |
| Net Canada imports | 5.2 | 5.8 | 5.7 |
| LNG pipeline deliveries | 0.1 | 0.1 | 0.1 |
| Total supply | 104.4 | 104.5 | 102.2 |
| Data source: PointLogic | |||


A glimpse of mid-November cold in updated forecasts, offering a potential momentum shift for a natural gas futures market weighed down by bearish weather sentiment, sparked a sharp rally in early trading Monday. The December Nymex contract was up 61.0 cents to $6.294/MMBtu at around 8:55 a.m. ET. The latest forecast from Maxar’s Weather Desk…
+++++++++++++++
NG open sharply higher and has stayed strongly supported since then. The week 3-4 forecast as looking pretty bearish on Friday-1st map below but got MUCH colder on Sunday-2nd map below. The 1st image is a freeze frame but the 2nd one is updated daily, with this one being from Sunday. Tomorrow it will be 1 day fresher. I don't get the one from the current day but obviously, in this environment that's a good thing to have.


This week's EIA will be another robust injection. However, last Thursday, for the first time in 5 reports, the number was actually more BULLISH as opposed to the recent mega bearish numbers. https://www.marketforum.com/forum/topic/89973/#90073
Also, LNG exports will be resuming shortly at the repaired site which will gobble up some of the supply.

+++++++++++++++++++++
12z European model was -8 HDDs bearish and the 18z GFS ensemble a whopping -18 HDDs bearish. So NG has been weak since the daytime close but still holding most of the gains from Monday's session.
++++++++++
The milder outlooks actually started early Mon afternoon with the Euro model. It was -15 HDDs overnight compared to 24 hours earlier. The GFS was also milder.
++++++++++++++
Models were colder overnight which actually started earlier in the day Tuesday(after being milder Monday/Monday night) ((after being colder on Sunday). The latest colder trend looks the most likely.
+++++++++++
Colder weather models and Sharply higher on Tuesday.
After sharply lower on Tuesday and sharply higher on Monday.
Another HUGE injection compared to expectations!
https://www.investing.com/economic-calendar/natural-gas-storage-386
Latest Release Nov 03, 2022 Actual107B Forecast97B Previous52B
| Release Date | Time | Actual | Forecast | Previous | ||
|---|---|---|---|---|---|---|
| Nov 10, 2022 | 11:30 | 52B | ||||
| Nov 03, 2022 | 10:30 | 107B | 97B | 52B | ||
| Oct 27, 2022 | 10:30 | 52B | 59B | 111B | ||
| Oct 20, 2022 | 10:30 | 111B | 105B | 125B | ||
| Oct 13, 2022 | 10:30 | 125B | 123B | 129B | ||
| Oct 06, 2022 | 10:30 | 129B | 113B | 103B | ||
| Sep 29, 2022 | 10:30 | 103B | 94B | 103B | ||
| Sep 22, 2022 | 10:30 | 103B | 93B | 77B | ||
| Sep 15, 2022 | 10:30 | 77B | 73B | 54B | ||
| Sep 08, 2022 | 10:30 | 54B | 54B | 61B | ||
| Sep 01, 2022 | 10:30 | 61B | 58B | 60B | ||
| Aug 25, 2022 | 10:30 |
+++++++++++++++++++++++++
https://ir.eia.gov/ngs/ngs.html
for week ending October 28, 2022 | Released: November 3, 2022 at 10:30 a.m. | Next Release: November 10, 2022
| Working gas in underground storage, Lower 48 states Summary text CSV JSN | |||||||||||||||||||||||||
|---|---|---|---|---|---|---|---|---|---|---|---|---|---|---|---|---|---|---|---|---|---|---|---|---|---|
| Historical Comparisons | |||||||||||||||||||||||||
| Stocks billion cubic feet (Bcf) | Year ago (10/28/21) | 5-year average (2017-21) | |||||||||||||||||||||||
| Region | 10/28/22 | 10/21/22 | net change | implied flow | Bcf | % change | Bcf | % change | |||||||||||||||||
| East | 848 | 825 | 23 | 23 | 897 | -5.5 | 903 | -6.1 | |||||||||||||||||
| Midwest | 1,042 | 1,007 | 35 | 35 | 1,068 | -2.4 | 1,072 | -2.8 | |||||||||||||||||
| Mountain | 204 | 199 | 5 | 5 | 213 | -4.2 | 214 | -4.7 | |||||||||||||||||
| Pacific | 247 | 248 | -1 | -1 | 256 | -3.5 | 290 | -14.8 | |||||||||||||||||
| South Central | 1,160 | 1,116 | 44 | 44 | 1,168 | -0.7 | 1,156 | 0.3 | |||||||||||||||||
| Salt | 299 | 277 | 22 | 22 | 318 | -6.0 | 306 | -2.3 | |||||||||||||||||
| Nonsalt | 861 | 839 | 22 | 22 | 850 | 1.3 | 850 | 1.3 | |||||||||||||||||
| Total | 3,501 | 3,394 | 107 | 107 | 3,602 | -2.8 | 3,636 | -3.7 | |||||||||||||||||
Totals may not equal sum of components because of independent rounding. | |||||||||||||||||||||||||
Working gas in storage was 3,501 Bcf as of Friday, October 28, 2022, according to EIA estimates. This represents a net increase of 107 Bcf from the previous week. Stocks were 101 Bcf less than last year at this time and 135 Bcf below the five-year average of 3,636 Bcf. At 3,501 Bcf, total working gas is within the five-year historical range.
For information on sampling error in this report, see Estimated Measures of Sampling Variability table below.

metmike: Look at the blue line above rapidly gaining on the 5 year average. The angle of the upsloping blue line is MUCH steeper than any other year with us now having 6 of the last 7 reports featuring 100+ BCF injections. I don't need to check the records(Larry can) to know that has NEVER happened before.
Hey Mike,
1. When I have time I'll check the records. I've been very tied up. But off the top of my head, I can't recall anything like this in Sept-Oct regarding this number of 100+ injections. So, I'm nearly 100% sure you're right on this.
2. When you list forecasted EIA, is that based on a specific survey? If so, which survey? Please tell me more about this if you don't mind.
+++++++++++++++++++++
Colder pattern on the way in week 2 but the amount of ng gushing in right now is a record.
I finally got a chance to look at today's EIA in relation to the DD data for the week involved. I can already say with confidence that today's +107 on 67 HDD/6 CDD was one of the, if not THE, most bearish EIA reports in at least three years. I mean bearish in relation to DD data (vs past reports), not in relation to survey guesses, which had already adjusted to the very bearish EIAs of most of the last six weeks.
More later as I get the chance!
Thanks Larry! After last week's less bearish EIA #, I was shocked to see a number this bearish.
++++++++++++
The last 2 GFS ensemble runs were +23 HDDs after the previous 2 were -10 HDDs. The much colder week 2 overnight is not extreme sustained cold which may be needed for the bulls to overcome the incredible amounts of supplies gushing in right now.
NG has reversed lower after being +$3,000/contract earlier on the colder week 2 solutions. Too much supply gushing in.
Natural gas futures finished a volatile week on a high note, with the December Nymex contract jumping 42.5 cents day/day and settling at $6.400/MMBtu. January gained 42.4 cents to $6.754. Traders shrugged off a stout storage report and focused anew on approaching winter weather and long-term global demand. At A Glance: Domestic weather outlook shifts…
+++++++++++++++
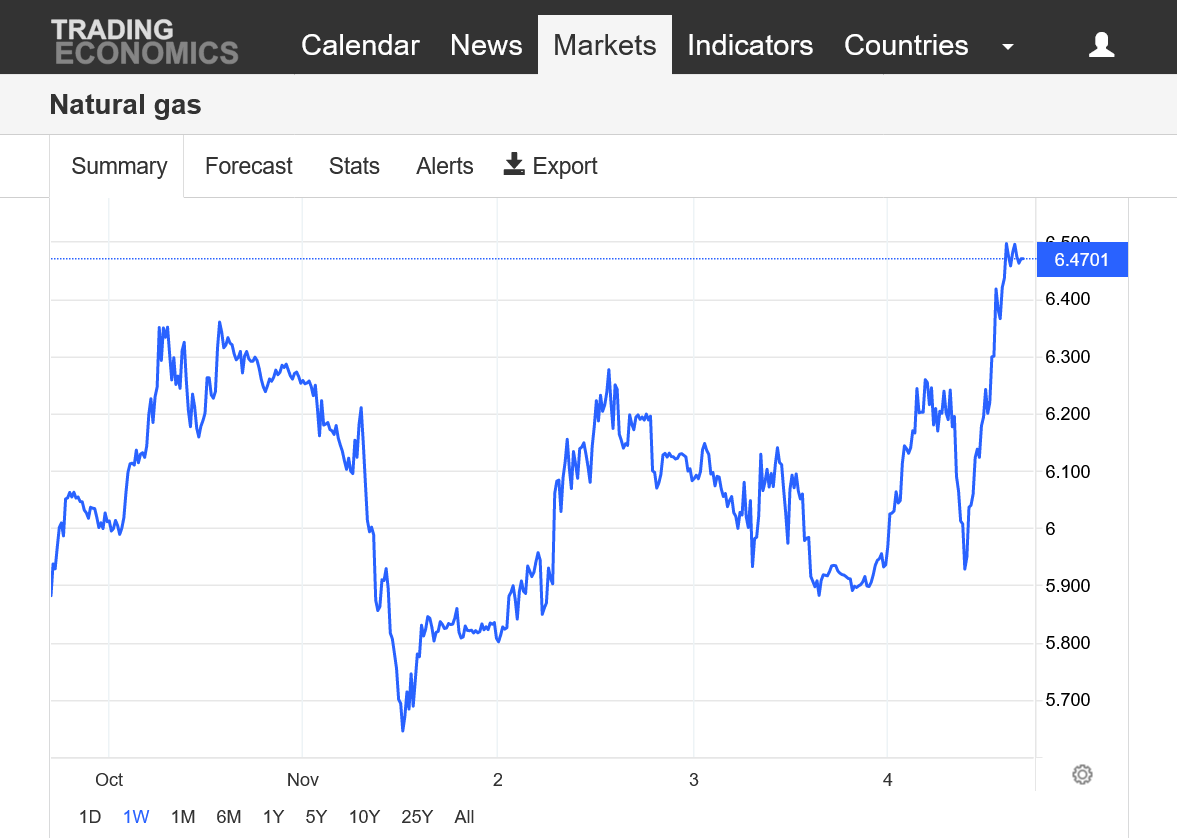
Insane trading on Friday. +3,000/contract very early on colder models overnight. Then reversing down to lower on the day by mid-morning. Then reversing back +$6,000/contract from the lows.
1 week chart below. Friday the 4th trading is the last day on the graph.
https://tradingeconomics.com/commodity/natural-gas
Big gap higher coming.
5:01pm: That was crazy. +6,000/contract on the open!
Do you know what the HDD differences are for Sun 12Z EE vs Fri 12Z EE on just the common days? Same question for GEFS. Thanks in advance.
Unfortunately I didn't keep write them down during much of that time Larry. They were MUCH higher though, obviously.
+++++++++++
Much colder models vs last Friday. Friday was almost impossible to trade. +4,000 over night to reverse lower by early morning, then reverse higher to +6,000 by early afternoon made this impossible to trade.
++++++++++++++++++++++++++++++++
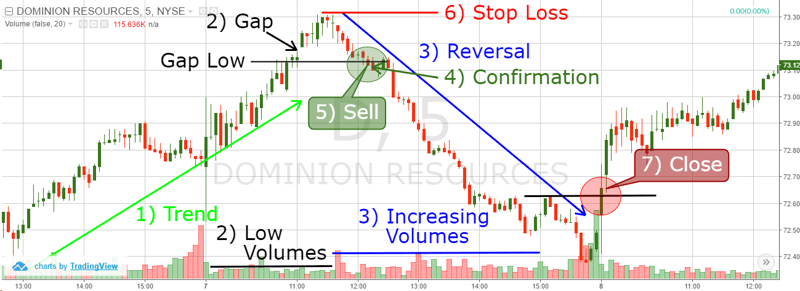
That's not it. Natural gas closed the huge gap higher on Sunday Night as the cold coming up is very transient/temporary. Just a short covering spike higher in a bearish, oversold, volatile market with supplies gushing in.
This puts in an extremely bearish, gap and crap technical formation............in a condensed, extremely volatile short term time frame that is different that most gap and craps that occur from a buying exhaustion at the top of a long uptrend.(which marks the end of the bullish mentality).
GapandCrap buying(selling) exhaustion formation
1 response |
Started by metmike - Aug. 30, 2019, 6:12 p.m.
https://www.marketforum.com/forum/topic/38044/
https://www.tradingsim.com/day-trading/exhaustion-gap
Another very robust injection coming up on Thursday at 9:30 am, at a time of year when injections normally are getting dinky. 
NG down more than $10,000/contract vs yesterday at this time.
Mike,
1). How do the HDDs look vs yesterday?
2) After a rise, NG loves to drop sharply when a tropical cyclone is getting close to landfall although it is often overdone like most things with this market.
Larry,
My internet was down intermittently since late last week and much of the day yesterday but is working great now. I was not documenting the HDDs like usual. However they are lower since yesterday evening.
The GFS was unchanged from 0z to 12z and the Euro was -4 HDDs less.
However, the very end of the 2 week period show a marked shift back to milder that got 1 day closer. The GFS actually is back to average, while the Euro is still lagging with modest +HDDs.
Natural gas continues the tendency of being sharply higher 1 day, then sharply lower the next day. We filled the huge gap higher from Sunday Night and then some today.
This is usually a gap and crap exhaustion formation that signals a reversal from the previous move but in this case, natural gas is not trading the usual signals followed by position traders.
Day traders for sure, though.
+++++++++++++++++
The Euro was +8 HDD's over night, however it warms things way back to average at the end of the period. GFS, was mix of milder and colder HDDs in the last 3 solutions but had the same abrupt end to the major cold late in week 2.
++++++++++++++++
HDDs were actually bullish +7 for the GFS and +5 for the European model and that gave us a late session bounce. However, the late week 2 pattern still features a huge warm up back to average temps on all models.
This potentially forebodes temps quickly turning well above average again in the southern 2/3rd of the country in week 3.
However, there will be more cross polar flow dumping some extreme cold into ALL of Canada with some of that getting across the border into the northern 1/3rd of the US in moderated fashion. As a result, expect an enormous temperature gradient from north to south late this month with a high potential for small changes in forecasts to make a difference of 20-30 degrees for some days where the temp gradient is tightest(northern US most likely).
https://ir.eia.gov/ngs/ngs.html
for week ending November 4, 2022 | Released: November 10, 2022 at 10:30 a.m. | Next Release: November 17, 2022
+ 79 BCF initial bullish price reaction
| Working gas in underground storage, Lower 48 states Summary text CSV JSN | |||||||||||||||||||||||||
|---|---|---|---|---|---|---|---|---|---|---|---|---|---|---|---|---|---|---|---|---|---|---|---|---|---|
| Historical Comparisons | |||||||||||||||||||||||||
| Stocks billion cubic feet (Bcf) | Year ago (11/04/21) | 5-year average (2017-21) | |||||||||||||||||||||||
| Region | 11/04/22 | 10/28/22 | net change | implied flow | Bcf | % change | Bcf | % change | |||||||||||||||||
| East | 865 | 848 | 17 | 17 | 897 | -3.6 | 906 | -4.5 | |||||||||||||||||
| Midwest | 1,068 | 1,042 | 26 | 26 | 1,074 | -0.6 | 1,080 | -1.1 | |||||||||||||||||
| Mountain | 208 | 204 | 4 | 4 | 213 | -2.3 | 213 | -2.3 | |||||||||||||||||
| Pacific | 247 | 247 | 0 | 0 | 258 | -4.3 | 290 | -14.8 | |||||||||||||||||
| South Central | 1,193 | 1,160 | 33 | 33 | 1,175 | 1.5 | 1,166 | 2.3 | |||||||||||||||||
| Salt | 311 | 299 | 12 | 12 | 323 | -3.7 | 314 | -1.0 | |||||||||||||||||
| Nonsalt | 882 | 861 | 21 | 21 | 850 | 3.8 | 851 | 3.6 | |||||||||||||||||
| Total | 3,580 | 3,501 | 79 | 79 | 3,617 | -1.0 | 3,656 | -2.1 | |||||||||||||||||
Totals may not equal sum of components because of independent rounding. | |||||||||||||||||||||||||
Working gas in storage was 3,580 Bcf as of Friday, November 4, 2022, according to EIA estimates. This represents a net increase of 79 Bcf from the previous week. Stocks were 37 Bcf less than last year at this time and 76 Bcf below the five-year average of 3,656 Bcf. At 3,580 Bcf, total working gas is within the five-year historical range.
For information on sampling error in this report, see Estimated Measures of Sampling Variability table below.

Natural gas futures rebounded Thursday amid bullish shifts in weather conditions and a lighter-than-expected storage injection — and despite widespread power losses in Florida as Tropical Storm Nicole wreaked havoc on the state’s Atlantic coast as well as inland markets. After plunging more than $1.00 over the two previous sessions – when weather was benign…
++++++++++++++
As mentioned, an extremely tight temp gradient develops in week 2 between extreme cold to the north and very balmy trying to return deep south.
Because of this, small changes are causing models to flip flop, sometimes in extreme fashion. The 12z GFS was -4 HDDs bearish vs the 0Z run, which had been +9 HDDs bullish. The European model did the exact opposite. The last 12z run was an incredible +15 HDD's bullish after the previous 0z run was -8 HDDs bearish.
Individual ensemble solutions have an extremely wide spread.
This is the bullish version of the pattern from the last operational 18z GFS.
1. Jet stream map
2. 850 mb temperature map
https://mag.ncep.noaa.gov/model-guidance-model-area.php
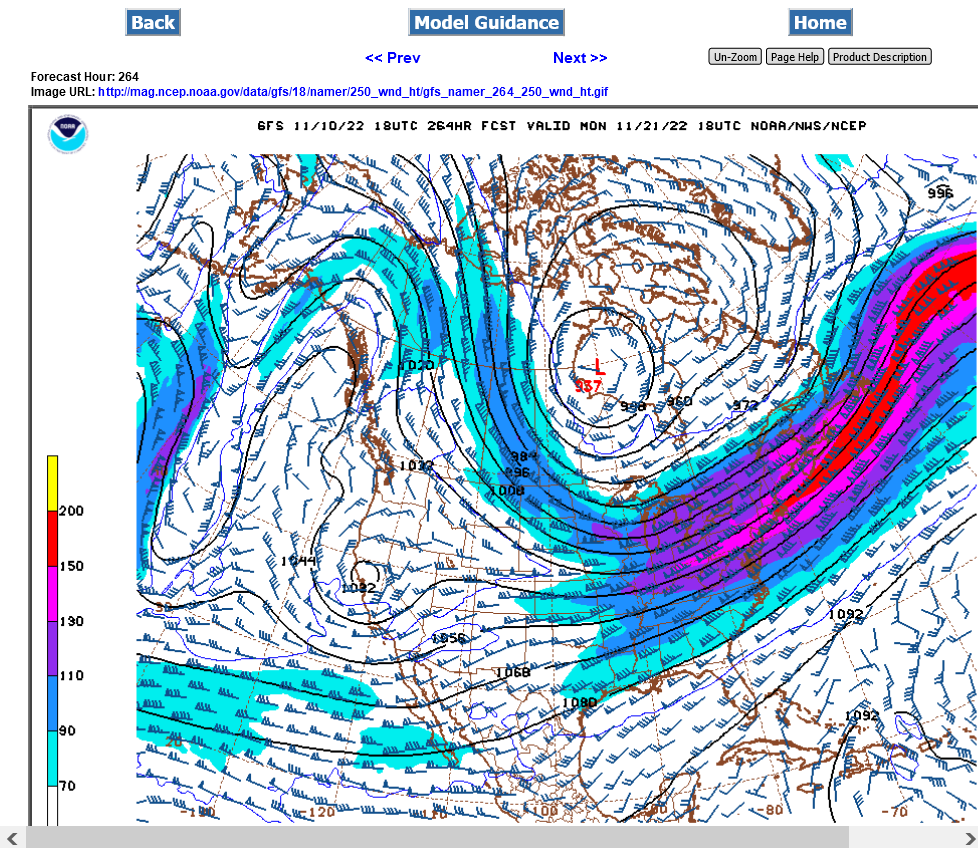

Added: The bearish version is zonal flow(instead of this meridional, north to south flow which results in keeping all the cold air locked up in Canada when we get to week 3/late November.
Some sort of news must have hit a few minutes before 10am.
NG went from +3,000/contract and in the midst of a strong push higher, on the highs......to -4,000/contract in 1 hour with more than half of that -7,000 loss in a 5 minute period.
Now we're down just 2,000/contract on the day.
That's even extreme of natural gas and could have only taken place from a news release. Maybe the exports from the down/damaged facility are going to be delayed longer?
Overnight weather was a bit bullish for HDDs during the first 2 weeks. GFS was +6HDDs at 6z after adding 6 HDDs at 0z. European model was just +1 HDD but the prior run was +15 HDDs.
Here the thing. At then end of the 2 week period it could turn very mild again if we go zonal and keep the extreme cold locked in Canada. Half of the individual ensemble members like that idea or one similar to that as we head towards the end of the month.
Added. the individual solutions are leaning bearish but the AO is dropping which increases the potential of cold moving from high latitudes to middle latitudes.