
New NG thread!
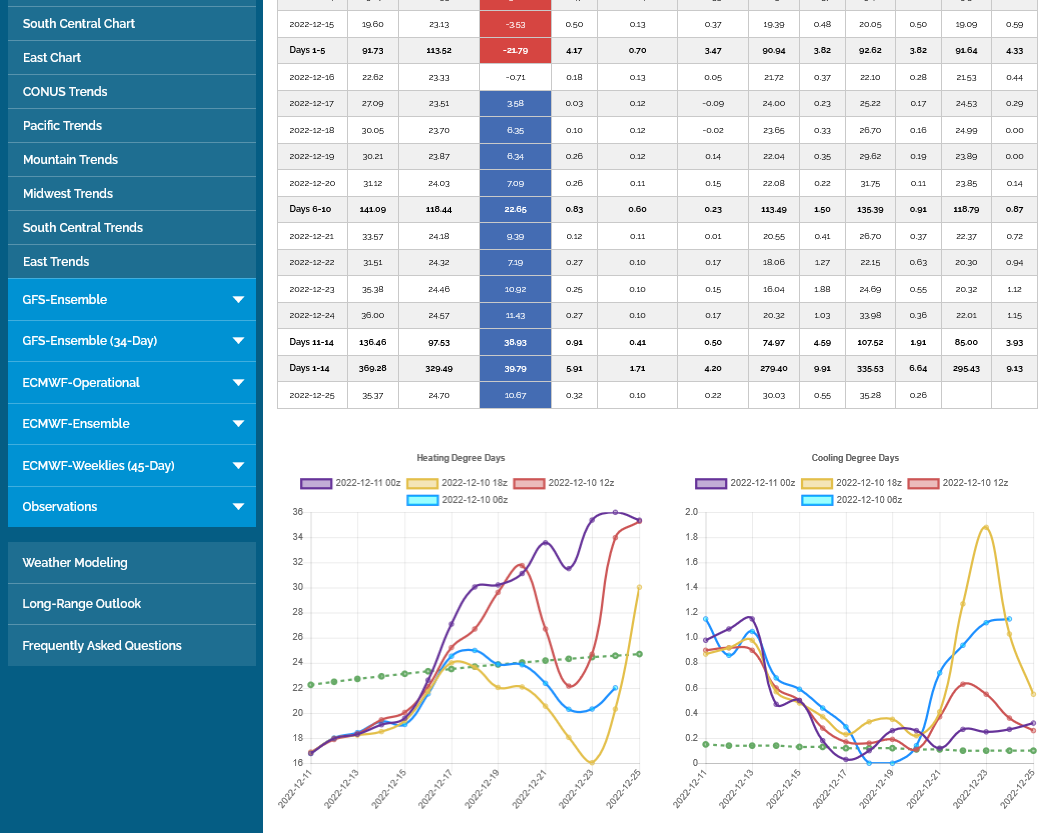
This has got to be an all time record for change in HDDs from the previous run.
The 0z GFS operational model is a mind boggling +90 HDDs vs the previous 18z run.
The previous 2 runs were +40 HDDs, which was one of the biggest I've ever seen, then -56 HDDs which was the biggest change that I can remember.
Now the +90 HDDs from 6 hours earlier is THE biggest change I've ever seen.
Note below that 2022-12-23 has +19 HDDs for just that day by itself between the 2 runs. 35.38-0z vs 16.04-18z. That would be huge for an entire 2 week period, let alone just b1 day.
| 0z | climo | diff vs climo | 18z | 12z | ||||||||
|---|---|---|---|---|---|---|---|---|---|---|---|---|
| 2022-12-23 | 35.38 | 24.46 | 10.92 | 0.25 | 0.10 | 0.15 | 16.04 | 1.88 | 24.69 | 0.55 |
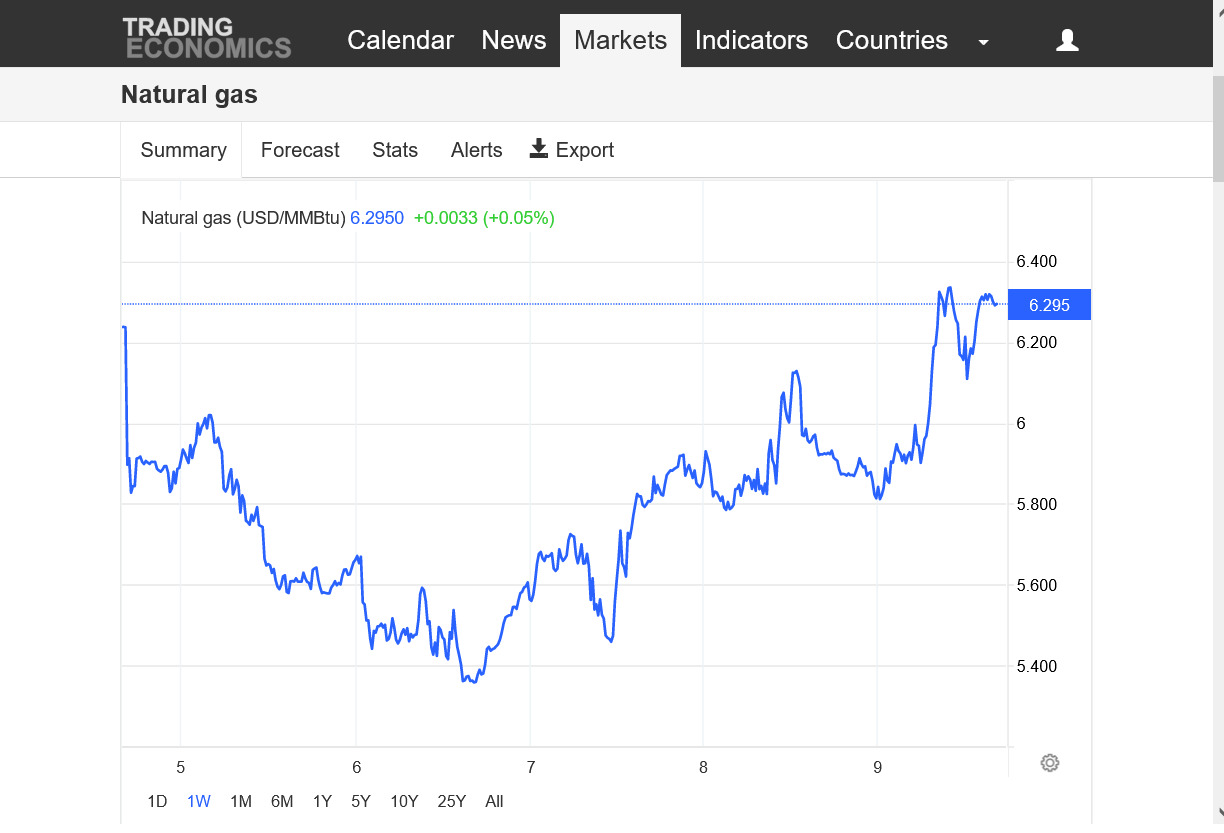
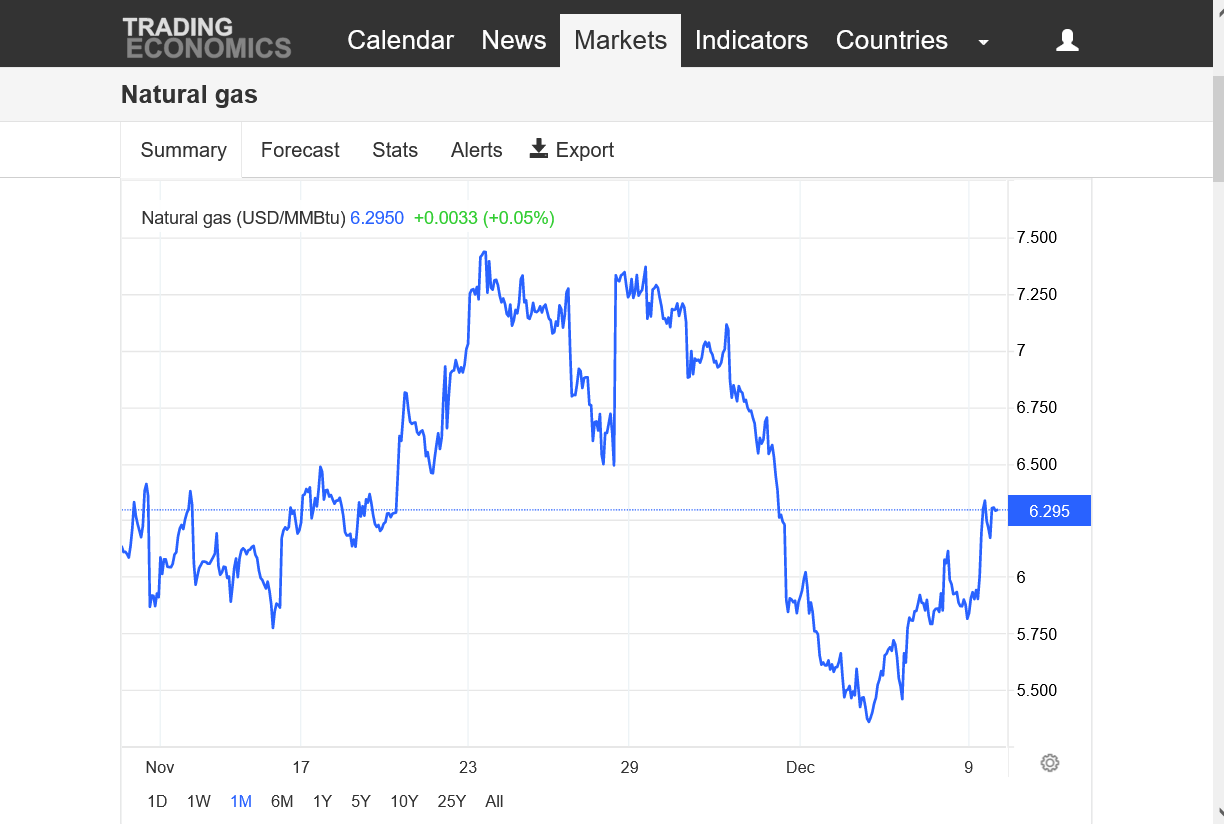
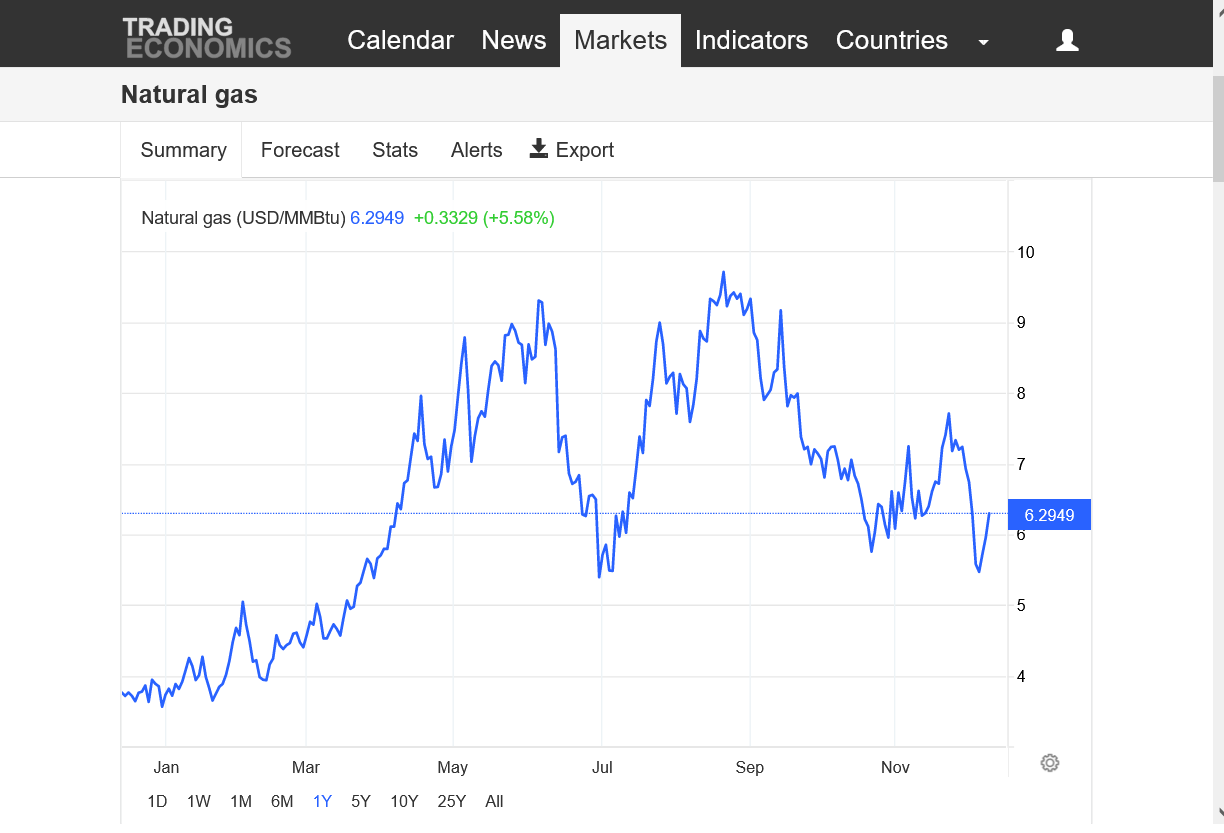
We closed that big gap lower from last Sunday Night(vs the low from the previous Friday and weekly low trading the previous week) and closed above it to make it a gap and crap selling exhaustion formation on the daily and weekly and monthly charts. Also we tested and held major support on the 1 year chart and even the 10 year chart.
We had a weekly reversal higher, closing around $9,000/contract above the lows.
1. 1 week
2. 1 month
3. 1 year
4. 10 years
5. 30 years
https://tradingeconomics.com/commodity/natural-gas
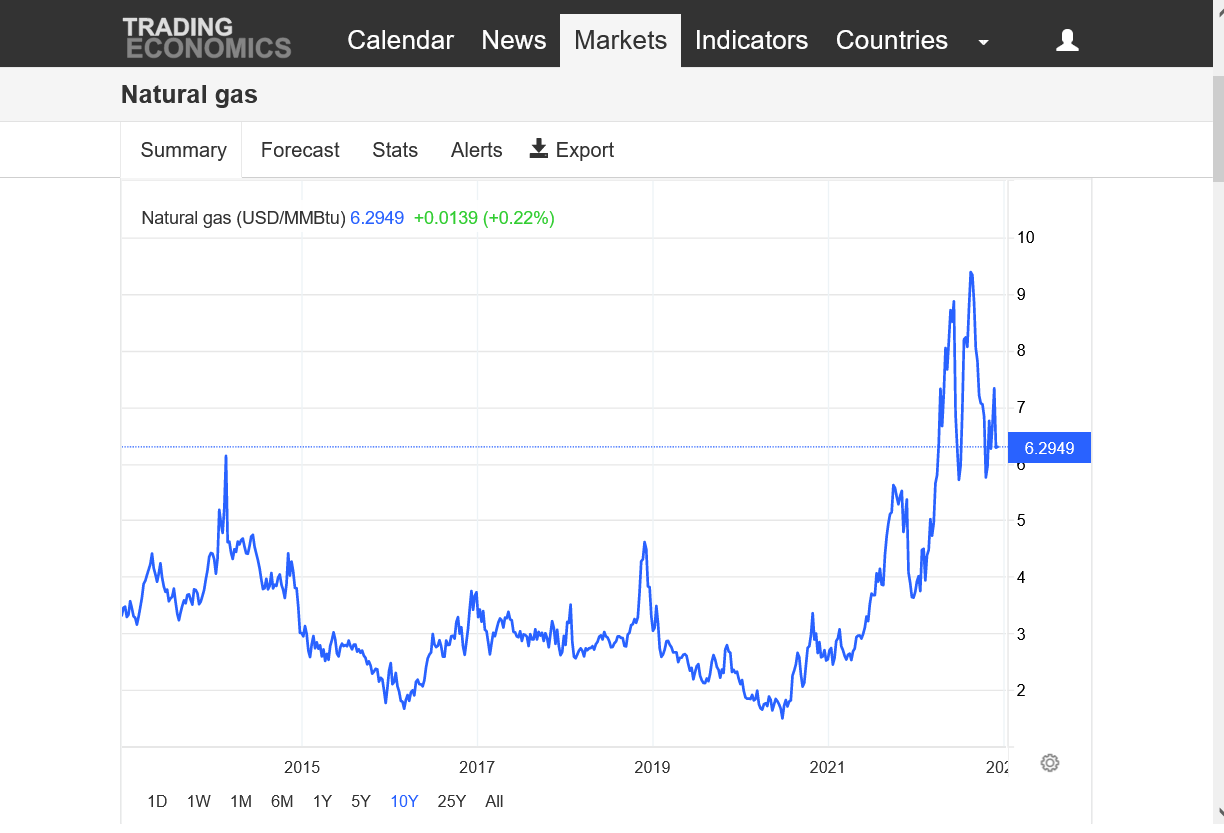
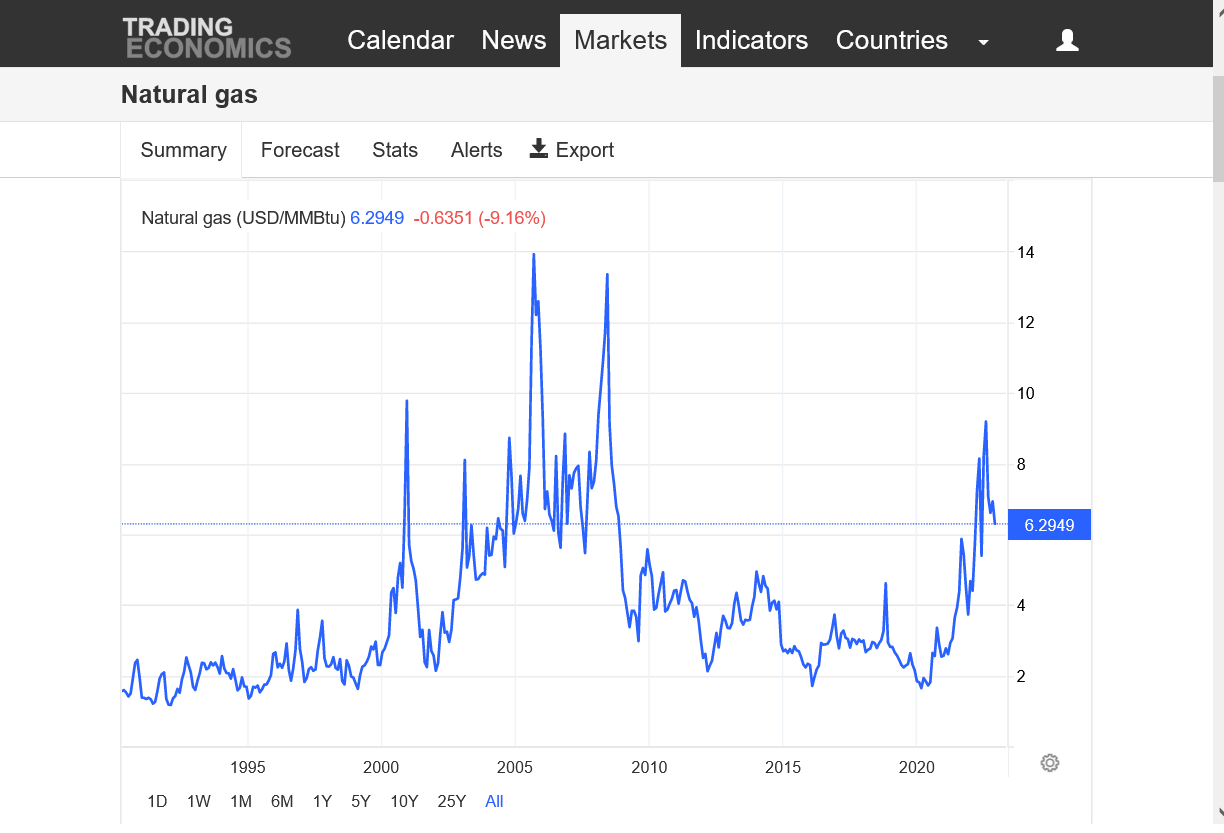
Previous EIA was bearish as supplies continue to gush in.
https://www.marketforum.com/forum/topic/90609/#91316
We closed the huge -349 BCF storage gap with last year and the 5 year average between just September and November(with record injections--6 were over 100 BCF, when the previous record for 100+ was just 3!).
See that analysis here:
https://www.marketforum.com/forum/topic/90609/
Then we had the big November cold snap that opened the storage gap again to just under 90 BCF.
https://www.marketforum.com/forum/topic/90609/#91316
The next 2 EIA reports will be bearish and we should close the gap again.......then the extreme cold hits in the 2nd half of December and we have massive drawdowns and open the supply deficit with last year and the 5 year average(with supplies still gushing in but with residential heating demand greatly exceeding those supplies).
Any guesses on how much higher the gap will be in natural gas tonight?
Opened $7,000/contract higher.
That's what you call an upside break away gap!
But this is natural gas. Whenever it turns milder, the gap will get filled.
With the current weather outlook that doesn't seem likely for awhile. But with the weather........that can change quickly too!
Mike, That means NG opened this evening ~10% higher than its last trade on Friday! Do you or anyone else know if that large of a % rise or fall had ever occurred before on the open after a non-holiday weekend? Or on the open after any weekend? Thanks in advance.
That must be pretty close to a record Larry.
The sad thing is that I was long several times last week and stopped out but was determined to be long on the close Friday.
We had chess at one of the schools that ended 15 minutes AFTER the market closed.
I put an order to buy just below $6.3 and figured I would check it before the close from chess practice and if not filled just go market.
But 47 new kids signed up the previous day that I was not expecting (100+ at that school now) and we were short a couple of chess sets, so I had to make some huge adjustments to accomodate the kids, including teaching 30 kids that had no idea how to play chess.
It was extremely hectic..................then, all of a sudden it was 4:15p and time to dismiss 100 students.
It was close to 5pm when I had a chance to look at the price. Not low enough for a fill.
Oh well. The weekend before, I almost bought on the Friday close and would have lost $3,000/contract on the open Sunday Night at a cheering competition where somebody hacked into both my phone and my wifes phone and changed the passwords to our WIFI so they could use them to hook up to the internet and we couldn't. I finally had to pay a fee to get an internet providing service offered by the event after the market had opened.
On the way home, we finally saw that somebody had changed our passwords and signing on info and that our cell phone provider was not at fault afterall.
Better than having a huge loss on the open and NOT being able to hook up to the trading account at the same time.
So the question is, where do we go from here?
We opened $16,000+ from last Tuesday's lows and $7,000 from the close on Friday.
Last week was clearly the buying set up and time to buy BEFORE the market reacted to the impending major cold and while it was still big time over sold.
How much of that cold is dialed in? That is completely impossible to answer, especially with record supplies gushing in right now.
If the models turn less cold overnight(and that continues) the open/high at $7 might be the high for a very long time. But we can go higher if the cold continues into January.
Early last week, the downside risk was getting lower as we dropped and even started bouncing higher with the impending cold being very supportive and being incredibly oversold, while running out of aggressive sellers so close to the lowest price in months.
Incredible risk now up here both down and up.
NG has been volatile recently(the less cold Friday 12z GEFS caused the price to fall $1,500 in 1 minute!) and it would be shocking to not see a week of extreme volatility.
Weather maps here: https://www.marketforum.com/forum/topic/83844/
These are still looking pretty cold. +PNA is really helping out to push cold hard in the East even with the NAO just slightly negative. AO still EXTREMELY negative, even with the slow increase late. It can't stay this low for THAT long.
https://www.marketforum.com/forum/topic/83844/#83856
Mike, why is NG 7% lower than early this morning? Are the 6Z GEFS/12Z GEFS warmer than the 0Z? Are the 12Z Euro op and EE warmer than the 0Z? TIA
Yep!
GEFS was -9 HDDs. EE was -12 HDDs. Canadian model was warmer too.
We're almost -$6,000 from the early morning highs now. In a fundamentally bearish environment with supplies gushing it, only COLDER weather will cause the prices to go higher.
Over the weekend, the forecasts turned MUCH, MUCH colder and we apparently dialed all that cold in, basically on the open.
The incredibly large and bullish upside breakaway gap higher has been well more than halfway filled.
If this gets filled, it will be amazing but not unexpected if the latest milder trends continue in weather models.
Thanks, Mike. So, the 12Z runs gave back only a small % of the Fri-Sun evening HDD gains?
Correct Larry!
I think an extremely important factor is where the models in late week 2 are headed which is the harbinger of week 3.
On Friday, they were teasing the potential of extreme cold.
On Monday, they are teasing rapid moderation.
This is based on pattern recognition entirely and independent of HDDs. I think if we had the same HDDs today that we did but it looked like it would get COLDER at the end of the period and beyond, the drop in price would have been minimal.
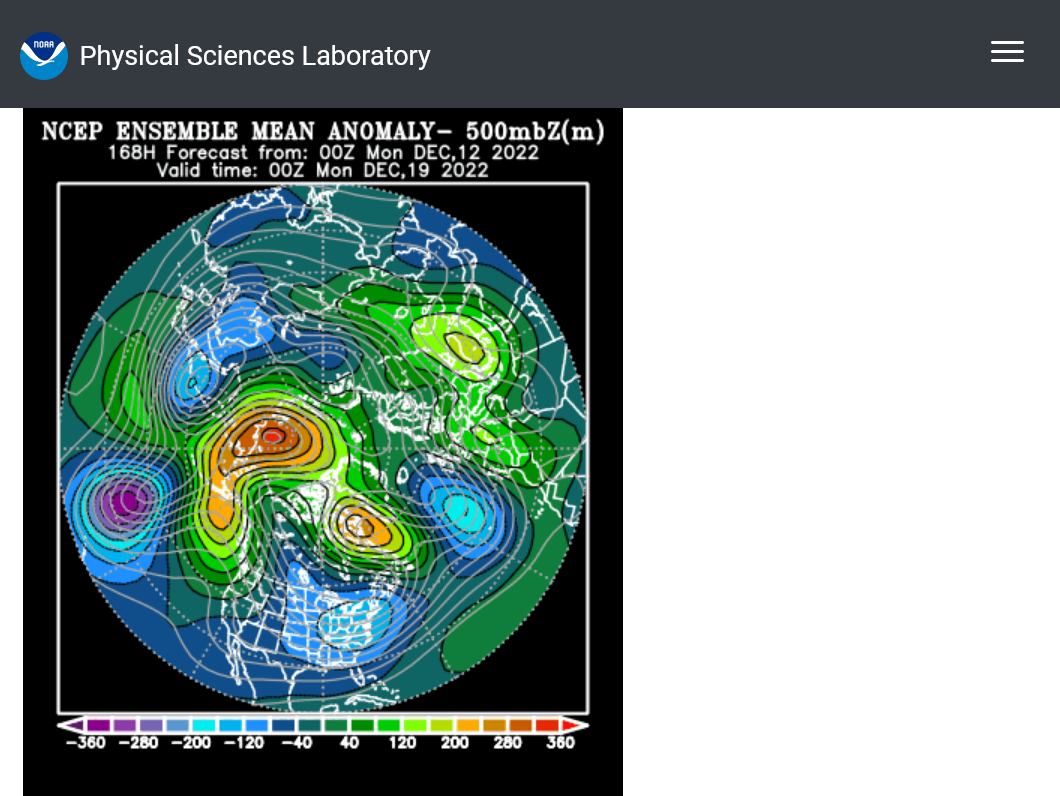
Here's what it all boils down too for that period. With the +PNA going we have a ridge/west, trough/east couplet that's ideal for cold in Canada to deeply penetrate far south in the US.
You astutely recognized earlier this month, that the -PNA was what was holding up the cold in Canada that wanted to come down from the -AO/-NAO but coulldn't make much inroads in the East because of the southerly component in steering winds downstream because of the teleconnection from a -PNA trough in the West.
That's been completely reversed to a +PNA and so the downstream winds from the riidge/West, trough/East couplet are strongly from the north. Farther north in Canada, where the air is coming from we've had a cross polar flow dumping air from Siberia into the country to our north(not that unusual for an extreme -AO and high level blocking) because the +PNA ridge extends thru Canada all the way back to Siberia!
Last week, we had the good cold air forcing at high latitudes being repelled at mid-latitudes.
This week the forecast is for the forcing at high and mid latitudes to be phased perfectly together from Siberia to deeply into the US.
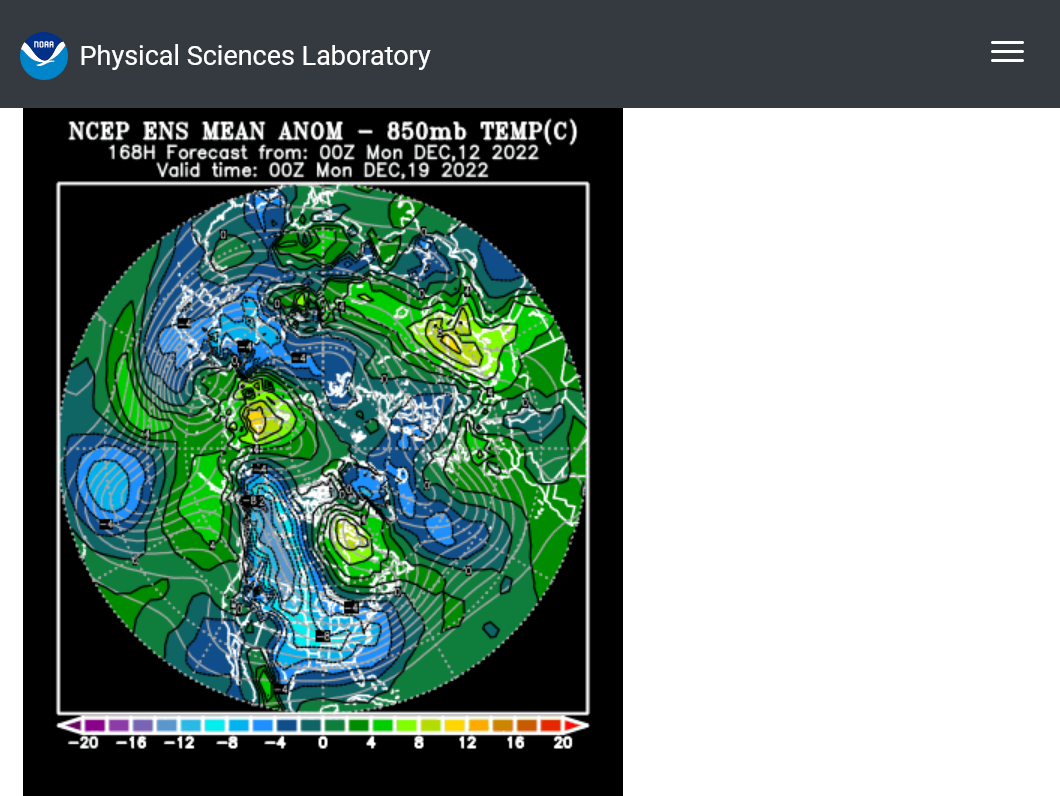
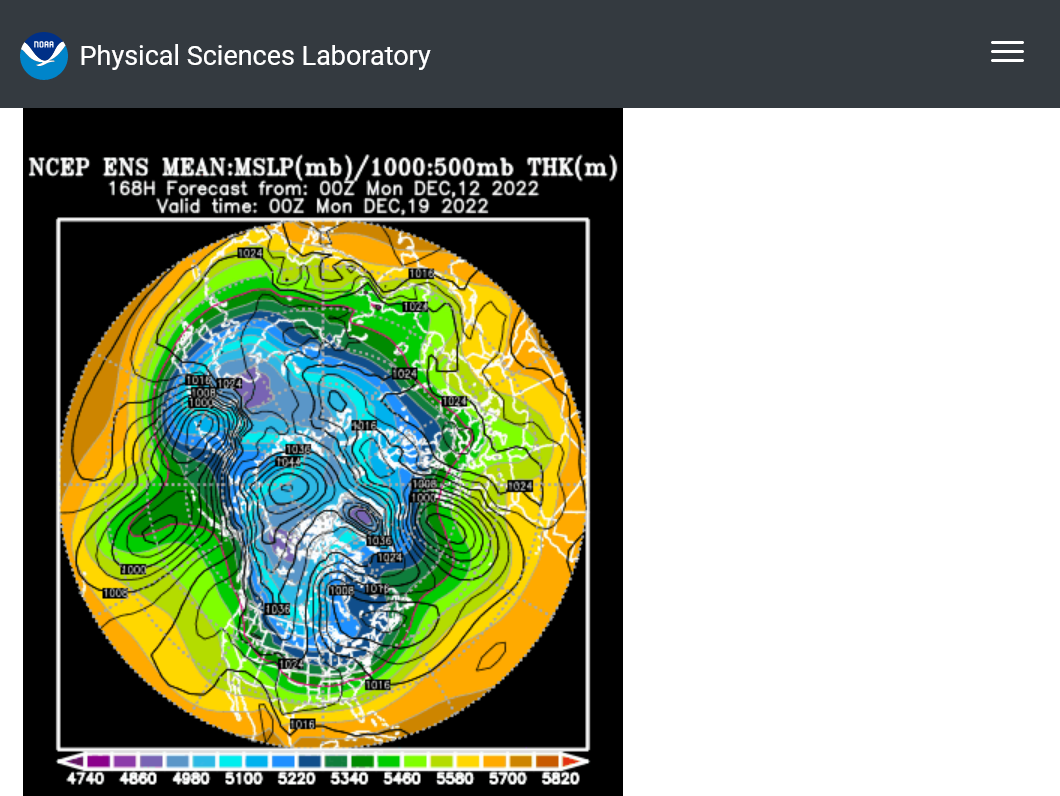
The images below are a snapshot for the 12-12-22 0z GEFS solution at 168 hours(1 week)
Upper level pattern anomalies below:
https://www.psl.noaa.gov/map/images/ens/z500anom_nh_alltimes.html
Temperature anomalies 1 mile up below
https://www.psl.noaa.gov/map/images/ens/t850anom_nh_alltimes.html
Surface pressure reflection below(strong northerly component implied by circulation and gradient). Big Siberian High in source region for our air masses following north to south steering currents/upper levels at the top.
https://www.psl.noaa.gov/map/images/ens/mslp_nh_alltimes.html
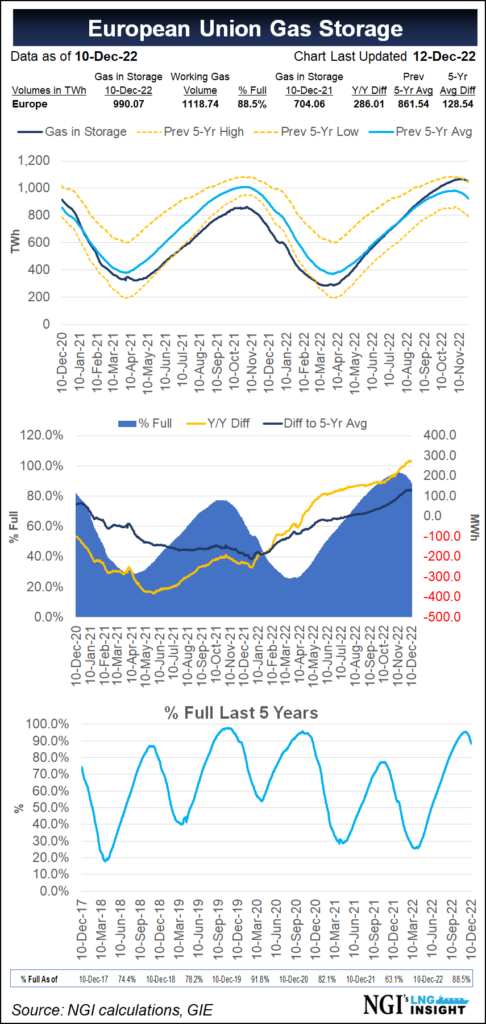
This is extremely important too. We hadn't heard much about this the last several months.
In 2021 into early 2022, ng in storage in Europe had dropped to extremely low levels, almost running out this past March.
Prices this year, at times were more than 10 times greater than what they were just a couple years prior as a potential crisis was perceived. Then the NG pipeline from Russia was sabotaged earlier in the Fall and it was perceived as extremely bullish.
But look at supplies in Europe now!!!!!! Just like the US, ng supplies have been gushing into Europe(not sure from where) even with our exports to them being hurt from the damaged facility.
Europe had an extreme cold outbreak recently and the market just shrugged it off because storage is plenty full to make the market comfortable with having enough for a cold Winter. And clearly the ng gushing in now is from sources that can be depended on this Winter.
It's extremely unlikely for a natural gas crisis this Winter in Europe or the US, no matter how cold the next 4 months are. Just way too much ng is gushing in!
This is what's making it extremely hard for us to hold price gains. When the cold lets up, natural gas in storage will continue to gain on previous years because ng gas is gushing in at a record pace.
18z GEFS was +13 HDDs vs the previous one. The highest HDD total yet. NG had a bounce but is still $4,000+ off the highs from early this morning.
The problem is that too much supply is gushing in but also the look of models suggesting the flow flattening out and becoming less amplified at the end of 2 weeks.
Amplification then should be able to get us going back higher.
Another huge increase in HDDs.
0z EE was +14 HDDs vs 12z/previous run.
Oz GEFS was +18 HDDs vs 12 run, then 06z was -6 HDDs vs 0z but still +12 HDDs vs 12z.
NG had already made over half of its gains early in the evening before that guidance came out. The 18z GEFS came out +13 HDDs which tipped the market off about what the overnight models might show(colder again).
Despite this, they all want to moderate the pattern as week 2 goes on. This is almost inevitable since alot of the extreme cold air will be tapped out. To get even colder, we will need something like a polar vortex type low.
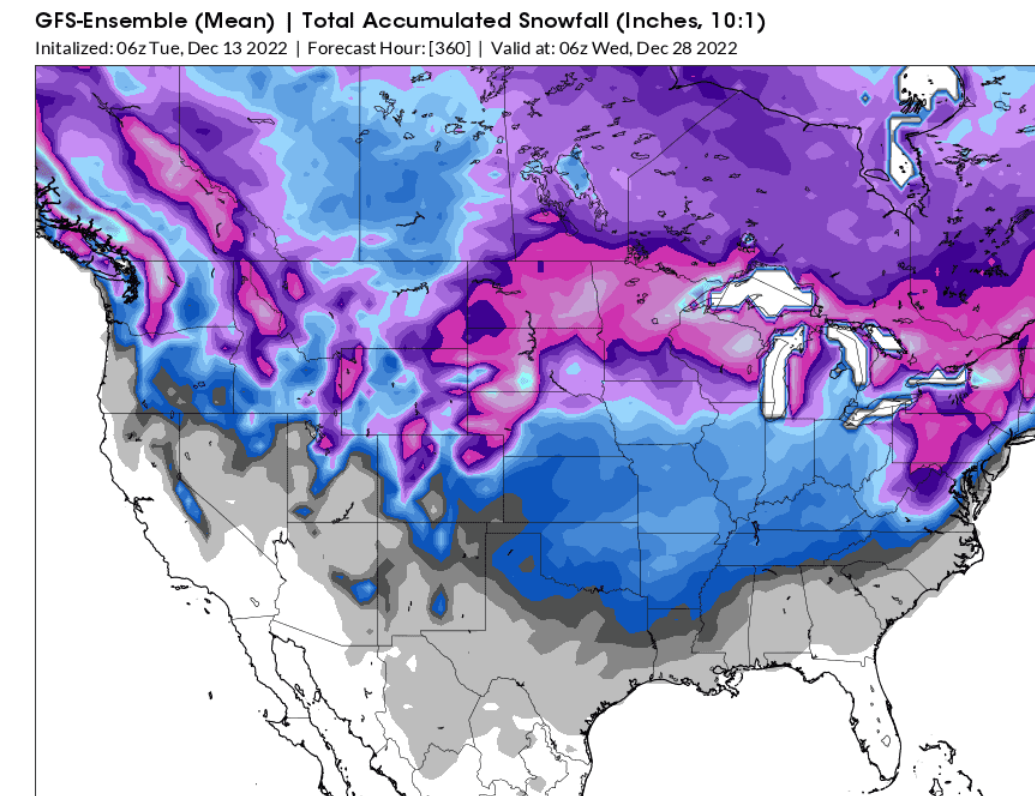
Another item is the deep snow cover that gets put down to help sustain and add to the cold.
+++++++++
Forecasts were NOT that much milder. THIS cold was dialed in and the fundamentals are extremely bearish and require even MORE cold to go higher. The EIA tomorrow will be bearish.
The 12z EE was +4 HDDs higher than the 0z but we finished that afternoon with a LOWER price than when that came out.
The last 18z GEFS was a whopping +18 HDDs vs the previous 12z run. We went higher but not are struggling to hold the gains.
Also, the period beyond 2 weeks looks like big time moderation and that matters.
7 day temps for Thursday's EIA report.
A bit bearish/lowish drawdown for December expected.
https://www.cpc.ncep.noaa.gov/products/precip/CWlink/daily_ao_index/ao.shtml

https://www.cpc.ncep.noaa.gov/products/precip/CWlink/pna/nao.shtml

https://www.cpc.ncep.noaa.gov/products/precip/CWlink/pna/pna.shtml

the 
https://ir.eia.gov/ngs/ngs.html
for week ending December 9, 2022 | Released: December 15, 2022 at 10:30 a.m. | Next Release: December 22, 2022
| Working gas in underground storage, Lower 48 states Summary text CSV JSN | |||||||||||||||||||||||||
|---|---|---|---|---|---|---|---|---|---|---|---|---|---|---|---|---|---|---|---|---|---|---|---|---|---|
| Historical Comparisons | |||||||||||||||||||||||||
| Stocks billion cubic feet (Bcf) | Year ago (12/09/21) | 5-year average (2017-21) | |||||||||||||||||||||||
| Region | 12/09/22 | 12/02/22 | net change | implied flow | Bcf | % change | Bcf | % change | |||||||||||||||||
| East | 822 | 834 | -12 | -12 | 822 | 0.0 | 827 | -0.6 | |||||||||||||||||
| Midwest | 1,002 | 1,028 | -26 | -26 | 987 | 1.5 | 990 | 1.2 | |||||||||||||||||
| Mountain | 186 | 193 | -7 | -7 | 200 | -7.0 | 197 | -5.6 | |||||||||||||||||
| Pacific | 203 | 217 | -14 | -14 | 262 | -22.5 | 276 | -26.4 | |||||||||||||||||
| South Central | 1,199 | 1,191 | 8 | 8 | 1,160 | 3.4 | 1,136 | 5.5 | |||||||||||||||||
| Salt | 337 | 327 | 10 | 10 | 328 | 2.7 | 325 | 3.7 | |||||||||||||||||
| Nonsalt | 862 | 864 | -2 | -2 | 831 | 3.7 | 811 | 6.3 | |||||||||||||||||
| Total | 3,412 | 3,462 | -50 | -50 | 3,430 | -0.5 | 3,427 | -0.4 | |||||||||||||||||
Totals may not equal sum of components because of independent rounding. | |||||||||||||||||||||||||
Working gas in storage was 3,412 Bcf as of Friday, December 9, 2022, according to EIA estimates. This represents a net decrease of 50 Bcf from the previous week. Stocks were 18 Bcf less than last year at this time and 15 Bcf below the five-year average of 3,427 Bcf. At 3,412 Bcf, total working gas is within the five-year historical range.
For information on sampling error in this report, see Estimated Measures of Sampling Variability table below.

Note: The shaded area indicates the range between the historical minimum and maximum values for the weekly series from 2017 through 2021. The dashed vertical lines indicate current and year-ago weekly periods.
With updated forecasts suggesting an upcoming stretch of Arctic chills in the Lower 48 will fade in the final days of 2022, natural gas futures were down sharply in early trading Friday. The January Nymex contract was down 60.7 cents to $6.363/MMBtu at around 8:45 a.m. ET. The American and European weather models both trended…
++++++++++++
metmike: Extreme volatility in NG with extreme cold on the way all dialed in and the huge warm up following that now the focus of the trade.
Spike down -$7,000/contract at one point and closing the upside breakaway gap from Sunday Night. WOW!
Normally, this formation signals the gap to be a buying exhaustion gap, when panic buyers(that caused the gap higher) run out of steam and the market collapses lower from overwhelming selling that causes the price to go below the bottom of the gap higher/fill the gap(I refer to it as a gap and crap).......however, the insane price movements in NG don't abide by technical signatures on price charts and if the moderation expected doesn't happen, then we can go back higher again.
+++++++++++++
More on gaps here:
https://www.marketforum.com/forum/topic/89973/#90406
GapandCrap buying(selling) exhaustion formation
1 response |
Started by metmike - Aug. 30, 2019, 6:12 p.m.
https://www.marketforum.com/forum/topic/38044/
+++++++++++++++++
Again, this is not the best signature in ng when its very sensitive to an extreme weather pattern. The formation only tells you the weather forecast and changes in the weather forecast. If the weather forecast changes, the price reaction negates the previous formation/price reaction. Right now, the weather forecast is for much milder air to return at the end of the month. The closer we get to that, without changing, the lower prices will go next week.
The market is looking ahead, after dialing this extreme cold in, really on the open Sunday Night. The rest of the week was spent spiking down and up and down but we closed the week more than $3,000 lower than we opened the week on the Sunday Night open.
gap lower on the open from quick moderation back to normal after this extreme transient cold snap.
if the gap doesn’t fill, it’s a downside breakaway gap. It’s also a gap lower on the weekly chart not just daily.
the updated weather models will determine where prices go this week.
with the cold being so extreme this week volatility could be high and filling the gap and going back down or going higher would not be a surprise.
++++++++++
We filled the small gap lower last night, then continued the crash lower from huge moderation after this intense cold intrusion ends.........along with supplies that continue to gush in.
Natural gas futures flopped a second consecutive trading day as the weather outlook for later this month and early next pointed to milder conditions and easing demand. The January Nymex gas futures contract settled at $5.851/MMBtu on Monday, down 74.9 cents day/day. February fell 59.3 cents to $5.710. At A Glance: Forecasts for soft start…
+++++++++++++++
Yep. As mentioned the last several posts. The market starting seeing this with confidence last week when it crashed several times and opened sharply lower Sunday evening.
https://www.cpc.ncep.noaa.gov/products/predictions/814day/index.php

EIA withdrawal on Thursday might be a bit below average for this time of year.

+++++++
Yep! Although the forecasts could start morphing colder again:
https://www.marketforum.com/forum/topic/83844/#83856
https://ir.eia.gov/ngs/ngs.html
for week ending December 16, 2022 | Released: December 22, 2022 at 10:30 a.m. | Next Release: December 29, 2022
Bearish........AGAIN! as ng supplies keep gushing in! -87 bcf
| Working gas in underground storage, Lower 48 states Summary text CSV JSN | |||||||||||||||||||||||||
|---|---|---|---|---|---|---|---|---|---|---|---|---|---|---|---|---|---|---|---|---|---|---|---|---|---|
| Historical Comparisons | |||||||||||||||||||||||||
| Stocks billion cubic feet (Bcf) | Year ago (12/16/21) | 5-year average (2017-21) | |||||||||||||||||||||||
| Region | 12/16/22 | 12/09/22 | net change | implied flow | Bcf | % change | Bcf | % change | |||||||||||||||||
| East | 789 | 822 | -33 | -33 | 810 | -2.6 | 796 | -0.9 | |||||||||||||||||
| Midwest | 974 | 1,002 | -28 | -28 | 966 | 0.8 | 951 | 2.4 | |||||||||||||||||
| Mountain | 178 | 186 | -8 | -8 | 190 | -6.3 | 188 | -5.3 | |||||||||||||||||
| Pacific | 186 | 203 | -17 | -17 | 249 | -25.3 | 267 | -30.3 | |||||||||||||||||
| South Central | 1,199 | 1,199 | 0 | 0 | 1,155 | 3.8 | 1,102 | 8.8 | |||||||||||||||||
| Salt | 340 | 337 | 3 | 3 | 333 | 2.1 | 317 | 7.3 | |||||||||||||||||
| Nonsalt | 858 | 862 | -4 | -4 | 821 | 4.5 | 785 | 9.3 | |||||||||||||||||
| Total | 3,325 | 3,412 | -87 | -87 | 3,370 | -1.3 | 3,303 | 0.7 | |||||||||||||||||
Totals may not equal sum of components because of independent rounding. | |||||||||||||||||||||||||
Working gas in storage was 3,325 Bcf as of Friday, December 16, 2022, according to EIA estimates. This represents a net decrease of 87 Bcf from the previous week. Stocks were 45 Bcf less than last year at this time and 22 Bcf above the five-year average of 3,303 Bcf. At 3,325 Bcf, total working gas is within the five-year historical range.
For information on sampling error in this report, see Estimated Measures of Sampling Variability table below.

The U.S. Energy Information Administration (EIA) on Thursday reported a withdrawal of 87 Bcf natural gas from underground storage for the week ended Dec. 16. The result fell shy of expectations and sent Nymex natural gas futures lower. Just ahead of the 10:30 ET government report, the January futures contract was up 3.0 cents at…
+++++++++++++
The biggest thing by a wide margin is that temps will warm to much above average by late next week with no signs of a change back to colder early next year.
https://www.psl.noaa.gov/map/images/ens/t850anom_nh_alltimes.html
Lower atmosphere temperature anomalies 2 weeks out.
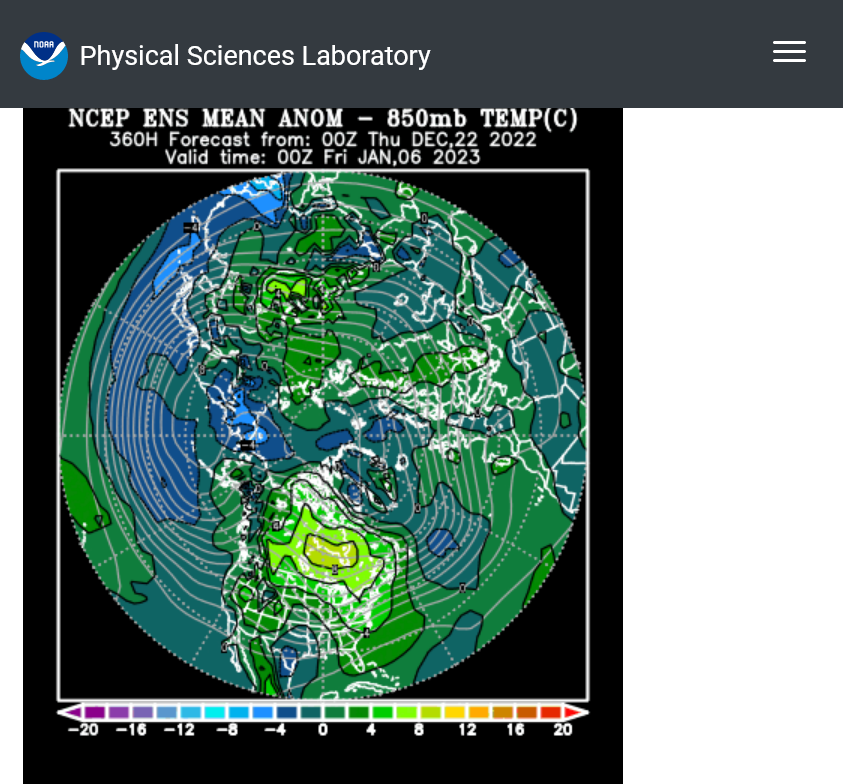
Temps for this weeks EIA report. Not as bearish as recent withdrawals. robust triple digit withdrawal expected. The weather outlook is still very bearish though which is dominated price behavior.
The front month, January will be expiring on Wednesday too which usually adds to volatility.

As updated forecasts hinted at longer lasting warmth to kick off 2023, natural gas futures were down sharply in early trading Wednesday. The expiring January Nymex contract was down 30.0 cents to $4.982/MMBtu at around 8:40 a.m. ET. February was off 27.5 cents to $4.843.
Weather data trended slightly warmer overnight during the Jan. 9-12 time frame, chipping away at demand expectations for a period that had been expected to bring a return to more seasonal temperatures following exceptional warmth to start 2023, according to NatGasWeather.
“Essentially, the overnight data suggested the warmer than normal pattern wouldn’t go easily,” NatGasWeather said.
A sizable drop-off in production, down into the 80s Bcf/d range in recent days, failed to prevent February prices from dipping below the $5 mark in after hours trading, the firm observed.
“At issue is the exceptionally warm pattern setting up over the southern and eastern U.S. most of the next 15 days,” NatGasWeather said. The January contract expiration might have also contributed to selling pressure, but “more likely” the move lower was “due to record warmth arriving over the U.S. to start January.”
As for assessing the balance impacts of the recent Arctic blast that swept through the Lower 48, NGI modeled a 199 Bcf withdrawal from U.S. natural gas storage for the week ended Dec. 23. Should the Energy Information Administration’s (EIA) weekly storage report confirm such a print, it would far outpace the five-year average 106 Bcf withdrawal.
“The market will struggle to pinpoint upcoming EIA storage reports,” EBW Analytics Group analyst Eli Rubin said.
The analyst pointed to the combination of “extreme weather” and associated “disruptions to production, LNG feed gas, industrial demand and linepack.”
Each of the next two reported EIA withdrawals are on track to potentially surpass the 200 Bcf threshold, Rubin added.
“With the first seven weeks of the withdrawal season cumulatively totaling a mere 177 Bcf draw, the back-to-back outsized pulls may provide support for rapidly deteriorating Nymex futures,” Rubin said.
Meanwhile, focusing on the February contract, ICAP Technical Analysis pegged key support at $4.838-4.750-4.716.
“Still watching intently to see if the bulls can find their footing,” ICAP analyst Brian LaRose said in a note to clients.
If they can hold key support, bulls will then need to “start chipping away at the ratio retracements associated with the $6.871 high and lift natural gas back above the 22/50 day moving averages,” the analyst added.
On the other hand, should prices continue to decline the next downside targets will be $4.342 and $4.220-4.093, according to LaRose.
NG actually started the week on Monday evening with a small gap higher from extended guidance showing a colder trend vs last Friday.
Mostly weakness since then with the lions share of losses coming out after midnight this morningafter the European model came out with a milder late week 2.....despite the GEFS being + 8 HDDs!
The market was also looking to todays expiration of the front month, january and this weeks extremely mild weather.
for week ending December 23, 2022 | Released: December 29, 2022 at 10:30 a.m. | Next Release: January 5, 2023
-213 BCF Very Big number!
| Working gas in underground storage, Lower 48 states Summary text CSV JSN | |||||||||||||||||||||||||
|---|---|---|---|---|---|---|---|---|---|---|---|---|---|---|---|---|---|---|---|---|---|---|---|---|---|
| Historical Comparisons | |||||||||||||||||||||||||
| Stocks billion cubic feet (Bcf) | Year ago (12/23/21) | 5-year average (2017-21) | |||||||||||||||||||||||
| Region | 12/23/22 | 12/16/22 | net change | implied flow | Bcf | % change | Bcf | % change | |||||||||||||||||
| East | 747 | 789 | -42 | -42 | 782 | -4.5 | 767 | -2.6 | |||||||||||||||||
| Midwest | 899 | 974 | -75 | -75 | 924 | -2.7 | 914 | -1.6 | |||||||||||||||||
| Mountain | 166 | 178 | -12 | -12 | 181 | -8.3 | 181 | -8.3 | |||||||||||||||||
| Pacific | 165 | 186 | -21 | -21 | 237 | -30.4 | 257 | -35.8 | |||||||||||||||||
| South Central | 1,136 | 1,199 | -63 | -63 | 1,122 | 1.2 | 1,078 | 5.4 | |||||||||||||||||
| Salt | 323 | 340 | -17 | -17 | 327 | -1.2 | 315 | 2.5 | |||||||||||||||||
| Nonsalt | 813 | 858 | -45 | -45 | 794 | 2.4 | 764 | 6.4 | |||||||||||||||||
| Total | 3,112 | 3,325 | -213 | -213 | 3,245 | -4.1 | 3,197 | -2.7 | |||||||||||||||||
Totals may not equal sum of components because of independent rounding. | |||||||||||||||||||||||||
Working gas in storage was 3,112 Bcf as of Friday, December 23, 2022, according to EIA estimates. This represents a net decrease of 213 Bcf from the previous week. Stocks were 133 Bcf less than last year at this time and 85 Bcf below the five-year average of 3,197 Bcf. At 3,112 Bcf, total working gas is within the five-year historical range.
For information on sampling error in this report, see Estimated Measures of Sampling Variability table below.

In an eye-opening indication of the impact Winter Storm Elliott had on the natural gas market, the U.S. Energy Information Administration (EIA) on Thursday reported a stunning 213 Bcf withdrawal from storage for the week ending Dec. 23. The triple-digit draw was near the high end of most major surveys and pumped the brakes on…
+++++++++++++++++=
Weather forecast still mild, with no sign for below average temperatures the next 2 weeks.
Last weeks temps were pretty extreme and that continued into the early part of the EIA report for next week, so next weeks EIA will be on the high side(much lower).
Then we see a couple of tiny withdrawals vs average from the current mild spell.
4 consecutive 200+ withdrawals in Jan/Feb and late Winter withdrawals, dropped inventory to very low levels which continued until September of this year, when we had massive supplies gushing in (a record smashing 100+ BCF injections on 6 occasions)
These were the withdrawals last Winter:
| Release Date | Time | Actual | Forecast | Previous |
|---|
| Mar 31, 2022 | 09:30 | 26B | 21B | -51B | |
| Mar 24, 2022 | 09:30 | -51B | -56B | -79B | |
| Mar 17, 2022 | 09:30 | -79B | -73B | -124B | |
| Mar 10, 2022 | 10:30 | -124B | -117B | -139B | |
| Mar 03, 2022 | 10:30 | -139B | -138B | -129B | |
| Feb 24, 2022 | 10:30 | -129B | -134B | -190B | |
| Feb 17, 2022 | 10:30 | -190B | -193B | -222B | |
| Feb 10, 2022 | 10:30 | -222B | -222B | -268B | |
| Feb 03, 2022 | 10:30 | -268B | -216B | -219B | |
| Jan 27, 2022 | 10:30 | -219B | -216B | -206B | |
| Jan 20, 2022 | 10:30 | -206B | -194B | -179B | |
| Jan 13, 2022 | 10:30 | -179B | -173B | -31B | |
| Jan 06, 2022 | 10:30 | -31B | -54B | -136B | |
| Dec 30, 2021 | 10:30 | -136B | -125B | -55B | |
| Dec 23, 2021 | 10:30 | -55B | -56B | -88B |
| Dec 16, 2021 | 10:30 | -88B | -86B | -59B | |
| Dec 09, 2021 | 10:30 | -59B | -54B | -59B | |
| Dec 02, 2021 | 10:30 | -59B | -57B | -21B |
+++++++++++++++++++++++
| Nov 10, 2022 | 10:30 | 79B | 84B | 107B | |
| Nov 03, 2022 | 09:30 | 107B | 97B | 52B | |
| Oct 27, 2022 | 09:30 | 52B | 59B | 111B | |
| Oct 20, 2022 | 09:30 | 111B | 105B | 125B | |
| Oct 13, 2022 | 09:30 | 125B | 123B | 129B | |
| Oct 06, 2022 | 09:30 | 129B | 113B | 103B | |
| Sep 29, 2022 | 09:30 | 103B | 94B | 103B | |
| Sep 22, 2022 | 09:30 | 103B | 93B | 77B | |
| Sep 15, 2022 | 09:30 | 77B | 73B | 54B | |
| Sep 08, 2022 | 09:30 | 54B | 54B | 61B |
https://tradingeconomics.com/commodity/natural-gas
1. 1 year
2. 30 years
Downside break out below key support!
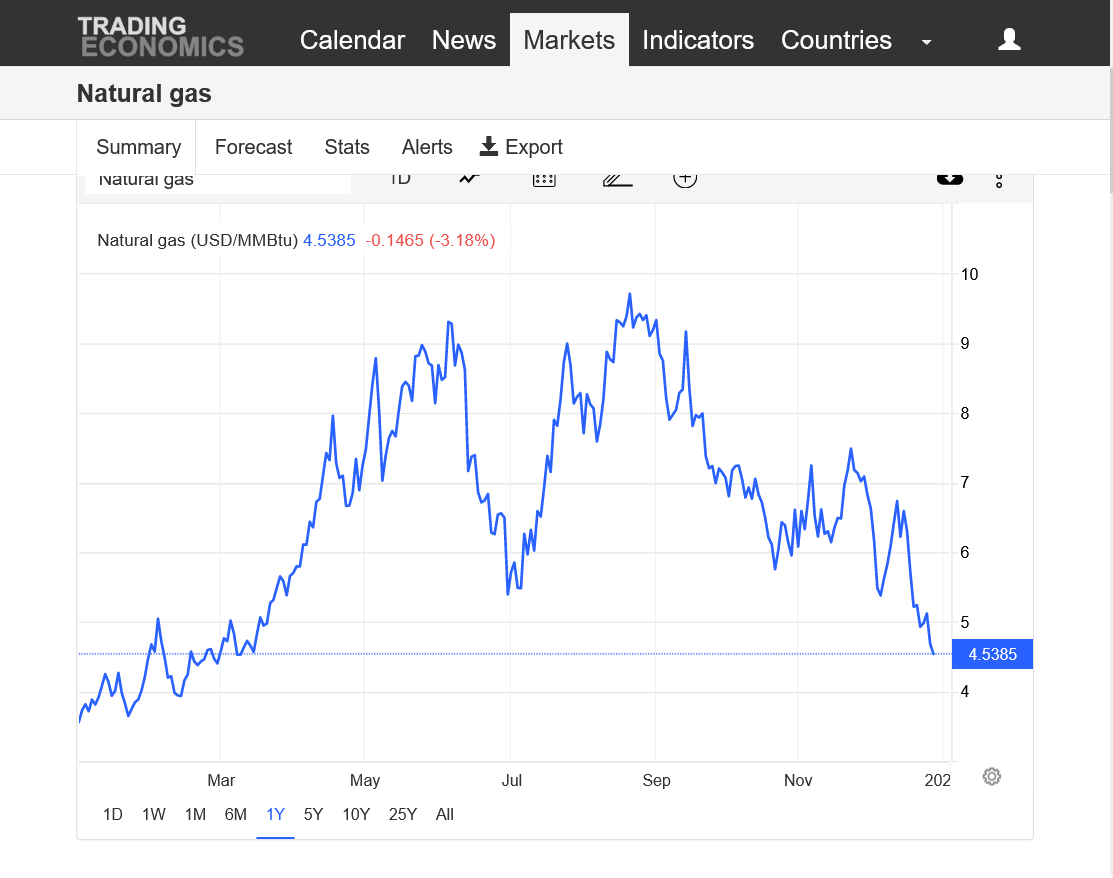
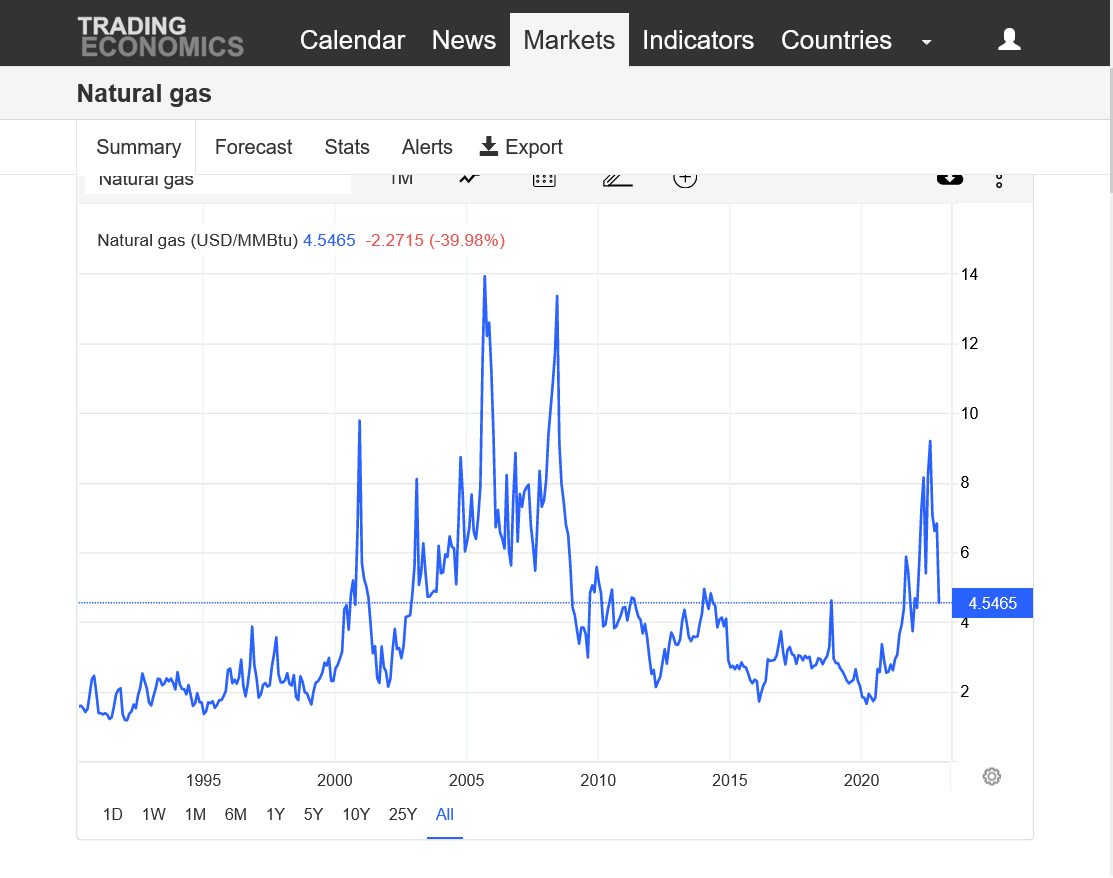
Despite a sizable inventory draw following December cold, expectations for mild January temperatures kept the pressure on natural gas futures in early trading Friday. Coming off a 12.6-cent sell-off in the previous session, the February Nymex contract was down another 8.4 cents to $4.475/MMBtu at around 8:40 a.m. ET. With bears in control, natural gas…
++++++++++++++++==
Still very mild
Mike said:
"Last weeks temps were pretty extreme and that continued into the early part of the EIA report for next week, so next weeks EIA will be on the high side(much lower). "
----------
Hey Mike,
I have significantly higher HDDs for the EIA week ending yesterday (for next week's report ) vs for the week ending 12/22, which what yesterday's report was based on. That's because the HDDs were much higher overall east of a line from Houston to Chicago, which would have much more weight than the area west of that line, which was much warmer than the prior week.
That having been said, the week ending yesterday was a holiday week vs non-holiday week for that yesterday's report was based on. Thus, some of that increased HDD related demand would have been negated due to the holiday. But my guess is that it won't fully negate the increased HDD related demand.
Another (separate) factor is freeze offs. Which EIA week had more freeze offs, the one ending 12/22 or the one ending 12/29?
My initial rough guess is that next week's report will have at least a slightly higher draw than the -213 due to the much higher HDDs vs the prior week more than negating the Christmas related demand drop.
----------------
Edit: I just found out that there were ~73 bcf more freeze offs for week ending 12/29 vs week ending 12/22. Based on this, significantly colder week ending 12/29 and even with taking into account holiday slowdown, I now think a draw at least in the middle 200s seems likely to me for the next EIA report.
Thanks Larry, that makes good sense.
-79 BCF in freeze offs is incredible!
That must be close to the highest ever!
- EIA report from last week was based on 224 HDD and 5 bcf of freeze offs.
- EIA report upcoming will be based on 248 HDD and 78 bcf of freeze offs, but it was a holiday week unlike the prior week. Still, the draw should be much higher than the prior one from all indications. My wild guess is that it will be 50-60 bcf higher or 263-273. I assumed very roughly 40 bcf reduction due to the holiday slowdown.
That's huge, Larry.
That must be close to a record for that week.
My educated guess as to why NG has risen somewhat today is what I said in the weather thread. It often rises in the days just before an anticipated large EIA draw. This is despite the fact that the very large draw would have been dialed in back when the intense cold leading to it was on the models two weeks ago. This is made even more likely by a prior sharp drop, which is the case here. Lots of short covering before tomorrow's EIA.
Mike, opinion?
Agree, Larry! Tied up with chess business all day and will try to comment more later.
Fwiw from NGI but this headline is consistent with what I said:
----------------------
I realize that the 12Z GFS suite had significantly more HDD, but NG had already risen a good bit before these were released. They only helped it to rise further. Also, although the 12Z EE was also colder, note that NG didn't go up further during its release interestingly enough. That's probably because it still has well below normal HDDs overall and looks bearish on its back end with strong Pacific flow.
I just checked and the 6z GEFS actually had +14 HDDs, Larry. The 12z was the same as the 6z. So the market may have bounced earlier from the GEFS that came out 6 hours before the 12z run you mentioned. The last 2 solutions of the Euro were -1 and +1 HDDs.
for week ending December 30, 2022 | Released: January 5, 2023 at 10:30 a.m. | Next Release: January 12, 2023
++++++++++++++++++++++++ -221 BCF, quite a bit less than you thought, Larry.
Interesting to note the blue line on the graph below diving lower and separating from the 5 year average in what would ordinarily be a bullish, fundamental storage signature.
Storage now is now -208 BCF lower than the 5 year average and -308 BCF vs storage last year and it did almost all of that in just 2 weeks(from extreme cold).
Why has the market been crashing lower, breaking out to the downside?
Because natural gas, like most futures markets is LOOKING AHEAD.
The pattern change to MUCH milder has been crystal clear since well before the extreme cold of December was over.
2022 featured huge draws thru late Winter.
2023 will feature much smaller draws.
The deficit in storage will quickly become a surplus with supplies gushing in as the La Nina has died and a mild, beneficial El Nino type weather regime is taking over.
This will warming in the Pacific Ocean temps will feature heat belching out and a resumption of the slight global warming pattern that had paused during the cooling La Nina.
https://www.marketforum.com/forum/topic/91060/#91893
++++++++++++++++++++++++
| Working gas in underground storage, Lower 48 states Summary text CSV JSN | |||||||||||||||||||||||||
|---|---|---|---|---|---|---|---|---|---|---|---|---|---|---|---|---|---|---|---|---|---|---|---|---|---|
| Historical Comparisons | |||||||||||||||||||||||||
| Stocks billion cubic feet (Bcf) | Year ago (12/30/21) | 5-year average (2017-21) | |||||||||||||||||||||||
| Region | 12/30/22 | 12/23/22 | net change | implied flow | Bcf | % change | Bcf | % change | |||||||||||||||||
| East | 691 | 747 | -56 | -56 | 768 | -10.0 | 740 | -6.6 | |||||||||||||||||
| Midwest | 839 | 899 | -60 | -60 | 897 | -6.5 | 876 | -4.2 | |||||||||||||||||
| Mountain | 157 | 166 | -9 | -9 | 173 | -9.2 | 173 | -9.2 | |||||||||||||||||
| Pacific | 165 | 165 | 0 | 0 | 221 | -25.3 | 247 | -33.2 | |||||||||||||||||
| South Central | 1,040 | 1,136 | -96 | -96 | 1,139 | -8.7 | 1,063 | -2.2 | |||||||||||||||||
| Salt | 270 | 323 | -53 | -53 | 344 | -21.5 | 317 | -14.8 | |||||||||||||||||
| Nonsalt | 770 | 813 | -43 | -43 | 795 | -3.1 | 747 | 3.1 | |||||||||||||||||
| Total | 2,891 | 3,112 | -221 | -221 | 3,199 | -9.6 | 3,099 | -6.7 | |||||||||||||||||
Working gas in storage was 2,891 Bcf as of Friday, December 30, 2022, according to EIA estimates. This represents a net decrease of 221 Bcf from the previous week. Stocks were 308 Bcf less than last year at this time and 208 Bcf below the five-year average of 3,099 Bcf. At 2,891 Bcf, total working gas is within the five-year historical range.
For information on sampling error in this report, see Estimated Measures of Sampling Variability table below.

Today's action appears to be a washout low.
26 weeks since last low, but a few days early on daily cycle, nevertheless I will buy tonight.
Great to hear from you tjc, Happy New Year!
The price has plunged below fair value........unless of course we're about to have a major recession that will also cut industrial demand, besides the huge drop in residential demand from lack of cold the next 2 weeks.
This is what happened to natural gas in late 2008/early 2009.
However, the US now has huge exports that were not there just a few years ago and like crude oil is more of a global market than it was then. Those exports can soak up alot of extra supply and our ng price right now, outside of the Middle East is probably the cheapest in the world by a wide margin.
definitely oversold...any specific support levels met mike?
Mike,
Yep, clearly a bearish number considering the 24 more HDDs and 73 more freeze offs vs the prior week. As often is the case, the holiday slowdown effect is very hard to predict. That very well may be why today's draw was so low vs expectations. Who knows?
Buy Stop Limit ngh 3.471 or 344.6 whichever comes first (buying 'breakout' after first hour)
Good luck tjc!
I'm working on chess stuff for the 5 schools that I coach at and will try to comment more later.