
I'll be making updates to this thread for the rest of the month. Scroll down for the latest:
All the weather maps are here:
https://www.marketforum.com/forum/topic/83844/#91421
Previous discussion:
https://www.marketforum.com/forum/topic/91060/
Additional threads may be started for Winter storms.
The coldest air in some time will invade the US next week, having origins from Siberia.
This is whats going on:
The forecast for next week is for the forcing at high and mid latitudes to be phased perfectly together from Siberia to deeply into the US.
With a +PNA upper level ridge/West, trough/East couplet the air masses will have a strong north to south component. Air from Canada will be dumped into the US.
Farther north in Canada, where the air is coming from we've had a cross polar flow dumping air from Siberia into the country to our north(not that unusual for an extreme -AO and high level blocking) because the +PNA ridge extends thru Canada all the way back to Siberia!
So the origins of these air masses will be from what's often the coldest place on the planet in December(Siberia). Even with some moderation, this spells sub zero cold over huge areas of our country next week.
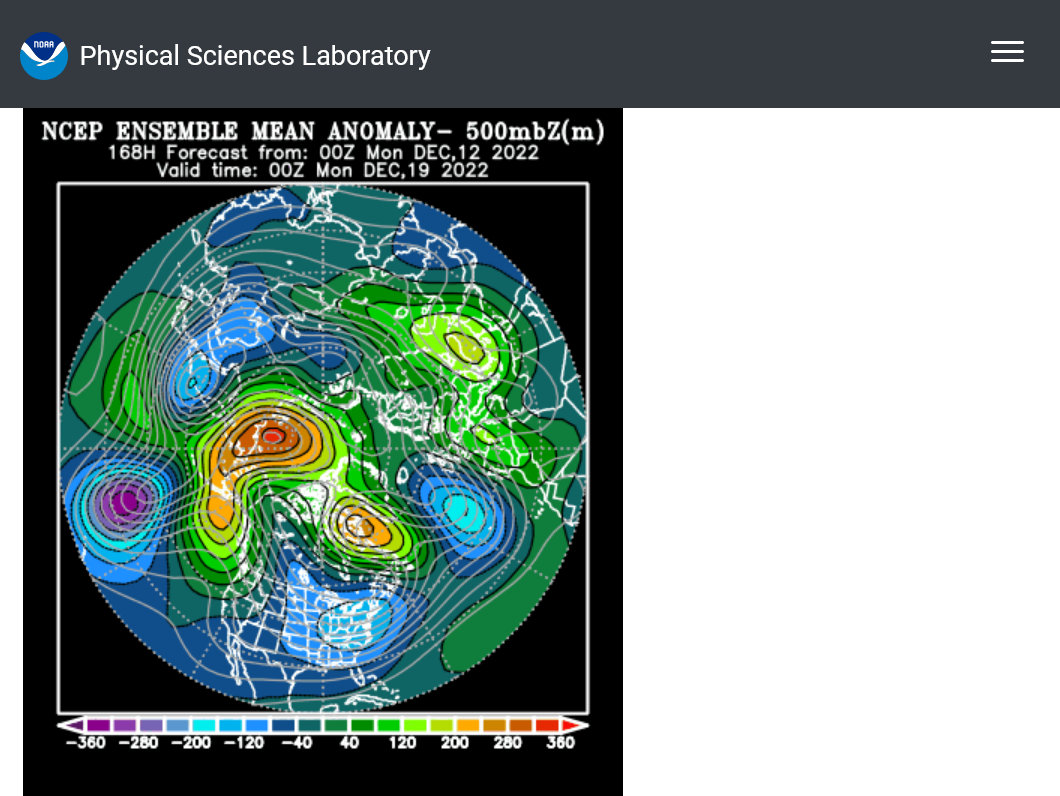
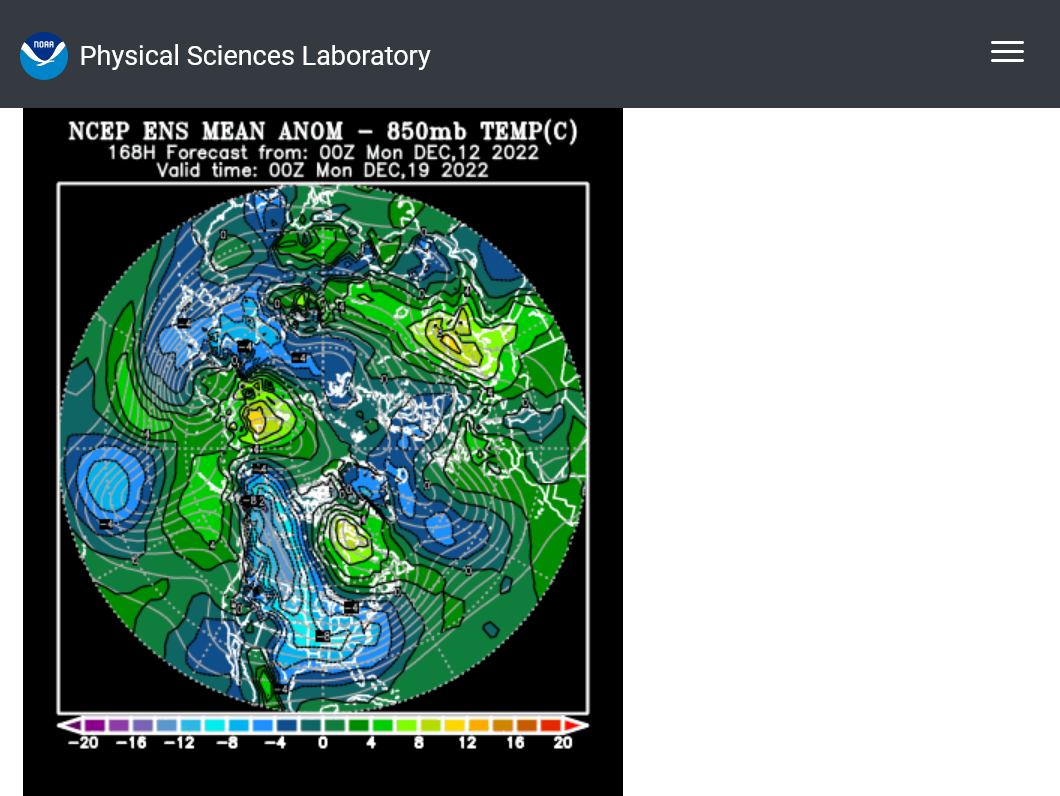
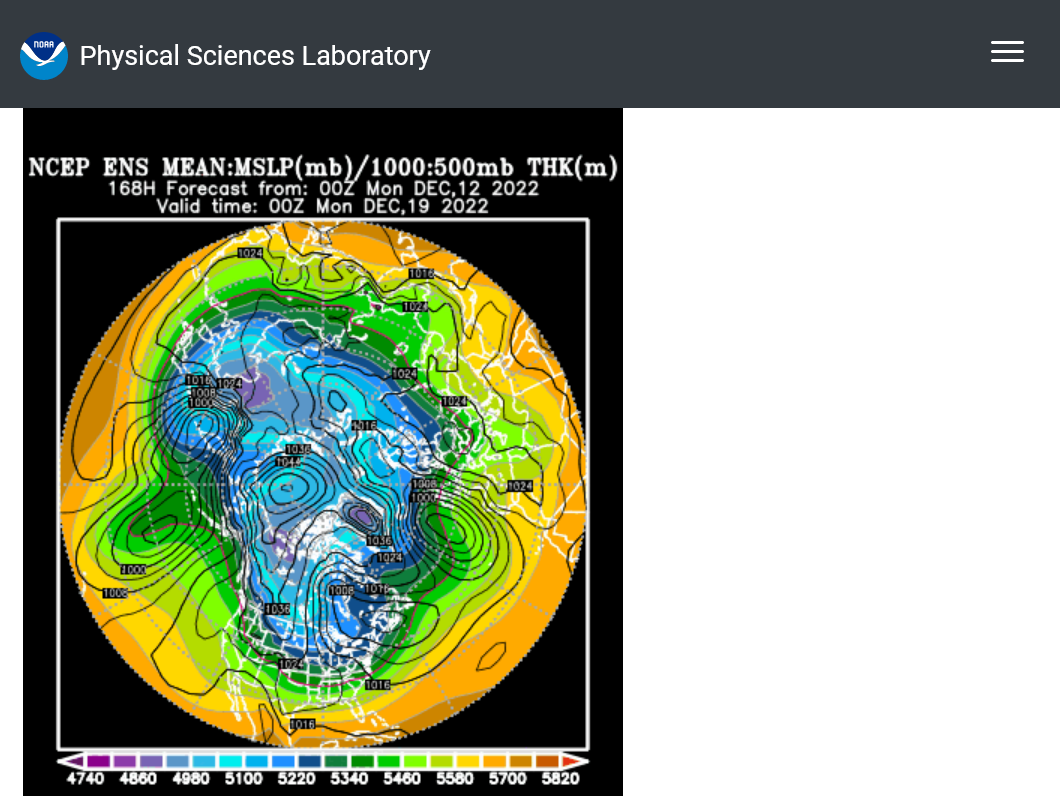
The images below are a snapshot for the 12-12-22 0z GEFS solution at 168 hours(1 week)
Upper level pattern anomalies below:
https://www.psl.noaa.gov/map/images/ens/z500anom_nh_alltimes.html
Temperature anomalies 1 mile up below
https://www.psl.noaa.gov/map/images/ens/t850anom_nh_alltimes.html
Surface pressure reflection below(strong northerly component implied by circulation and gradient). Big Siberian High in source region for our air masses following north to south steering currents/upper levels at the top.
https://www.psl.noaa.gov/map/images/ens/mslp_nh_alltimes.html
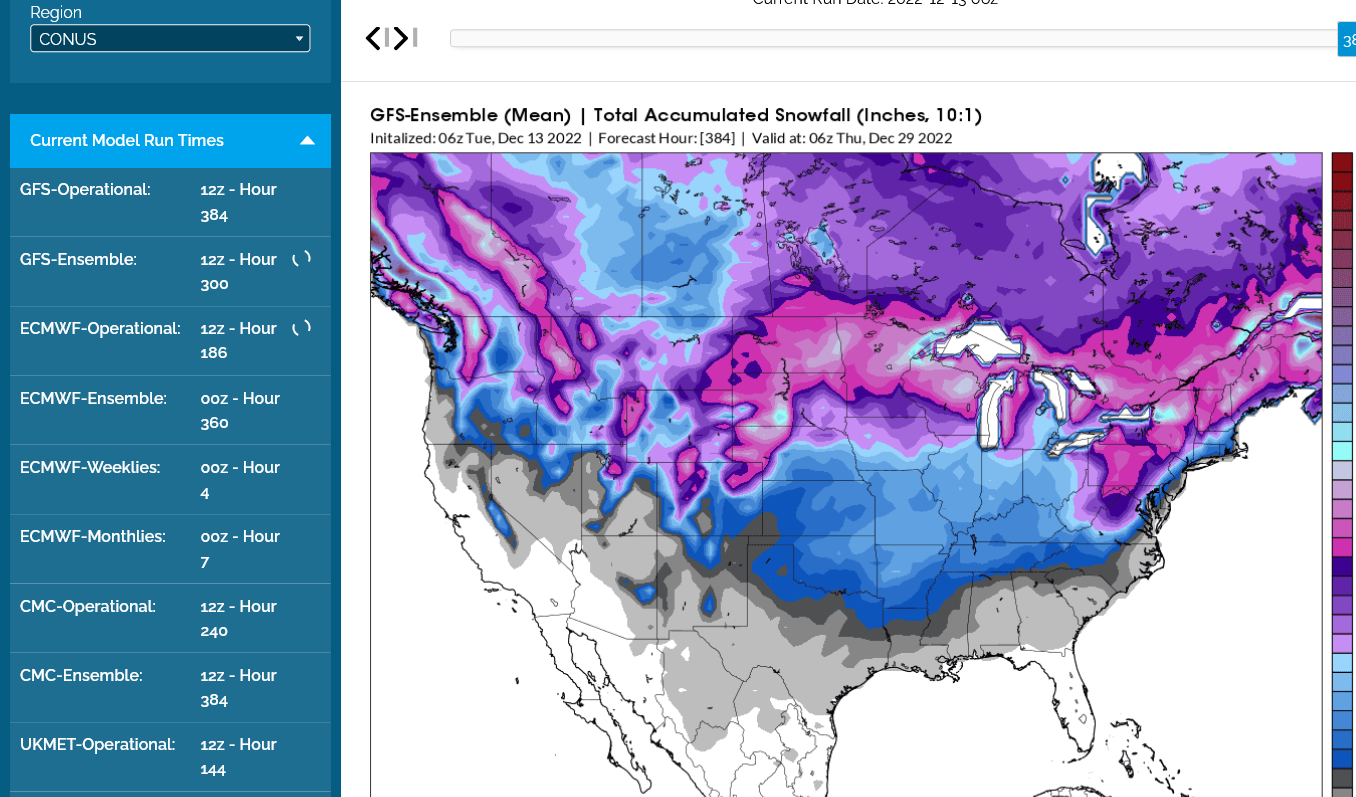
There will be some snow from this pattern.
Latest snow forecast for the next 2 weeks from the GFS-Ensemble mean. This will be changing as weather systems get closer.
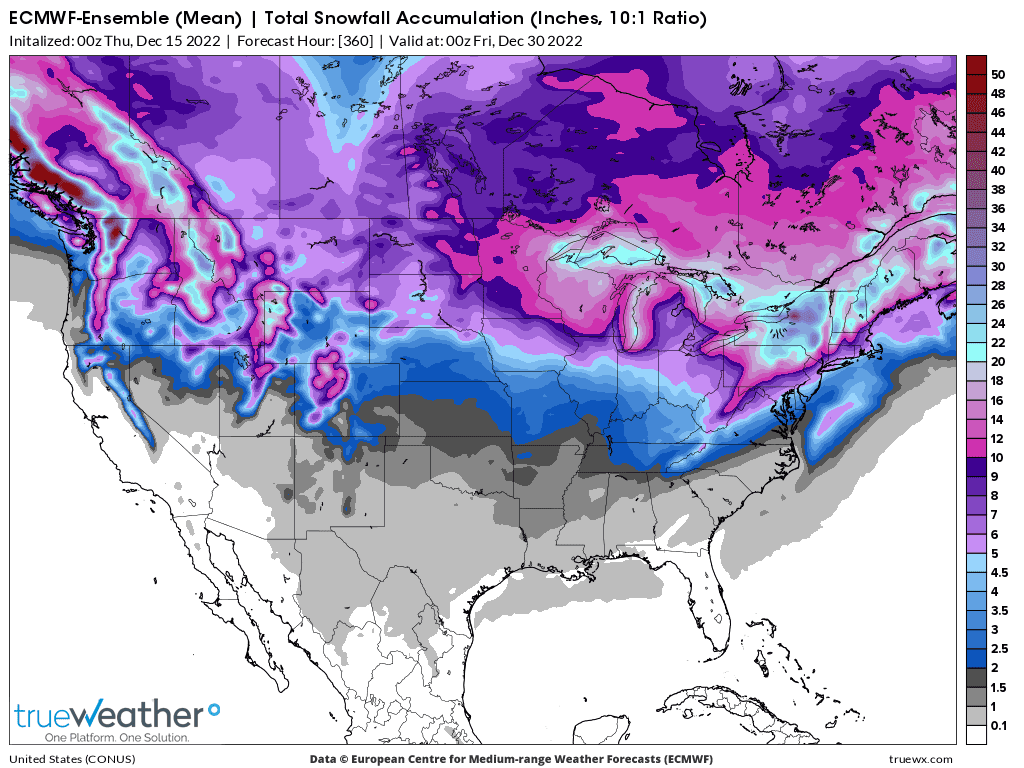
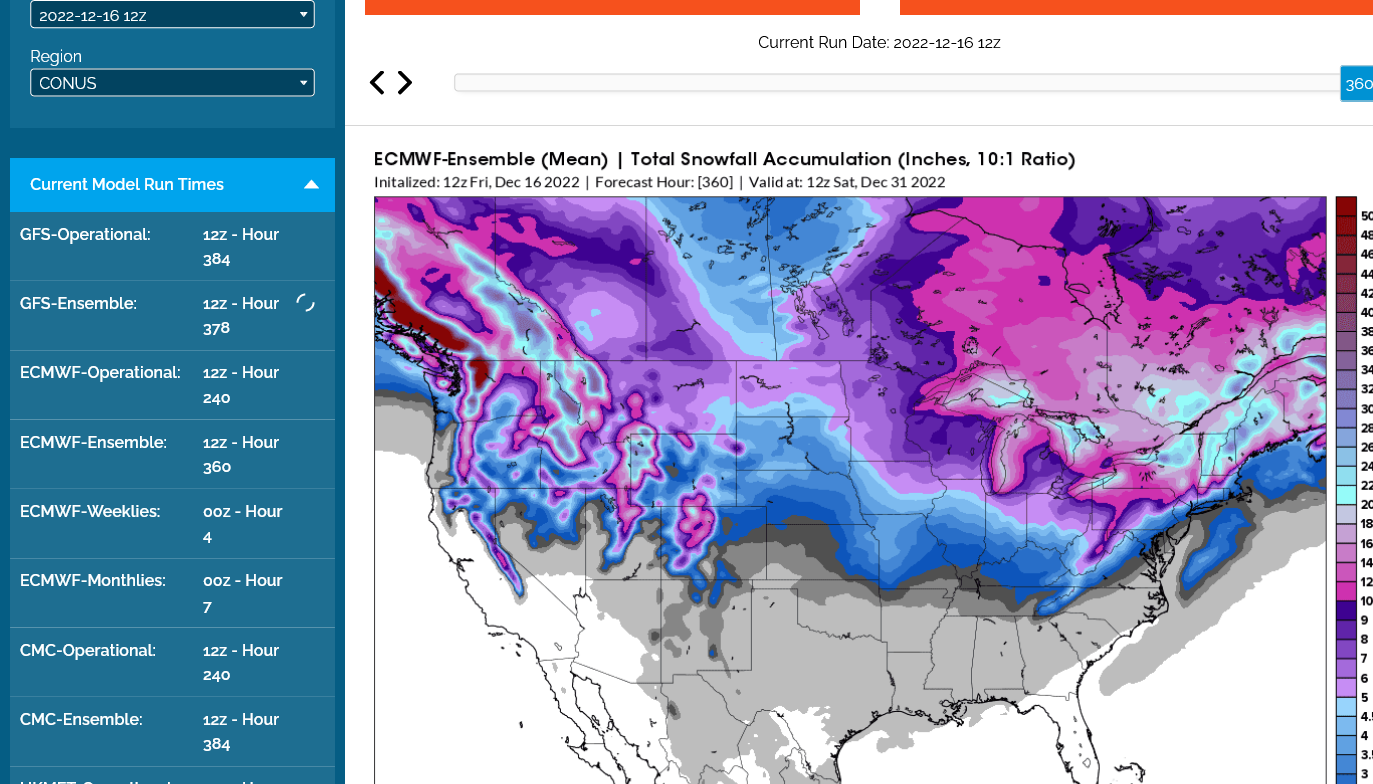
Latest total snow accumulation forecast from now thru the rest of December from the just out 0z European ensemble mean model.
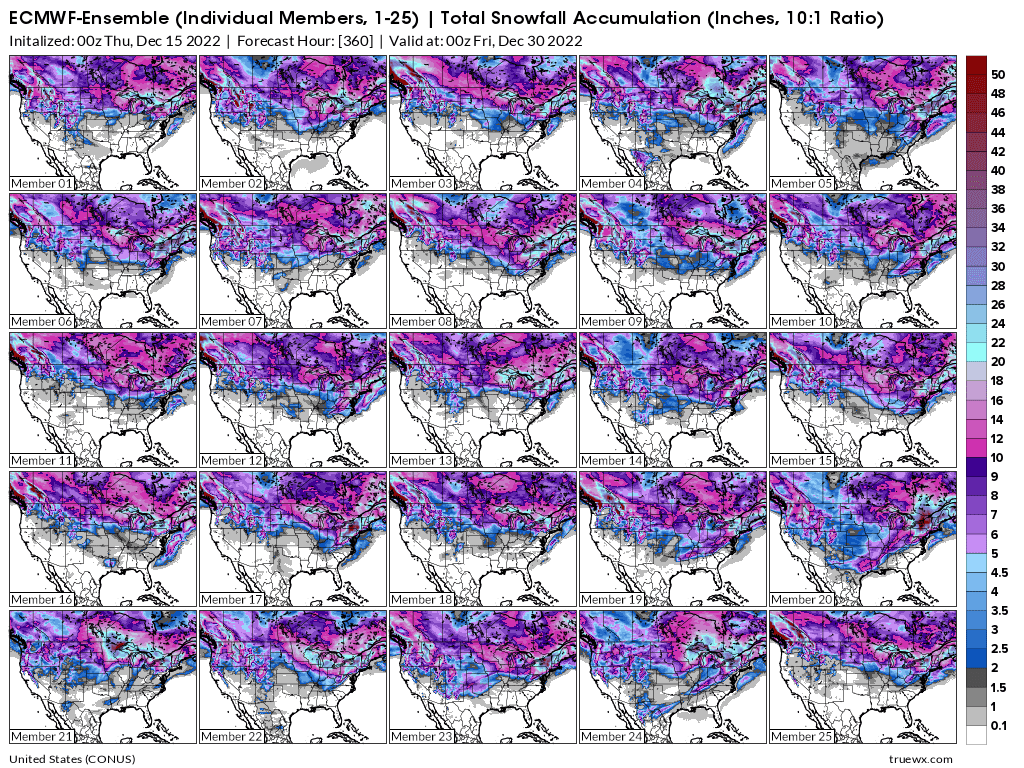
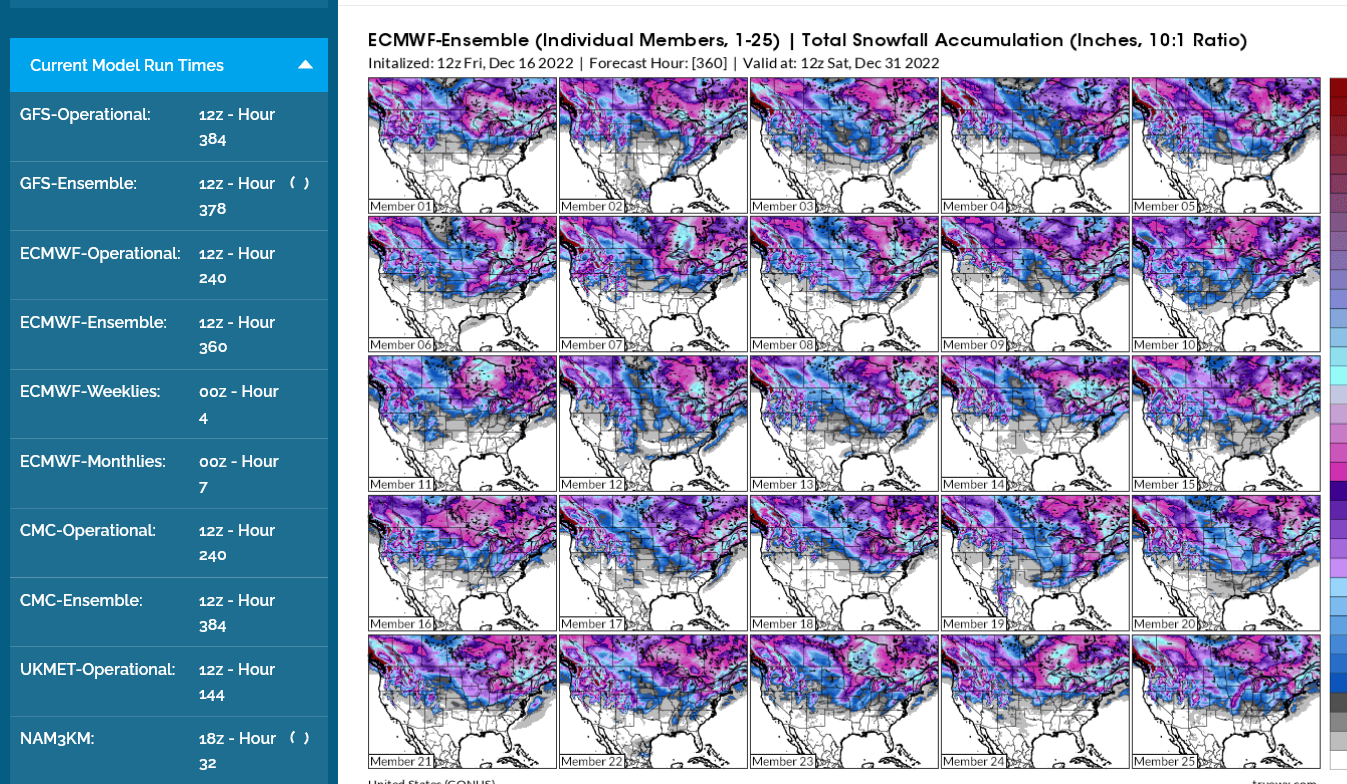
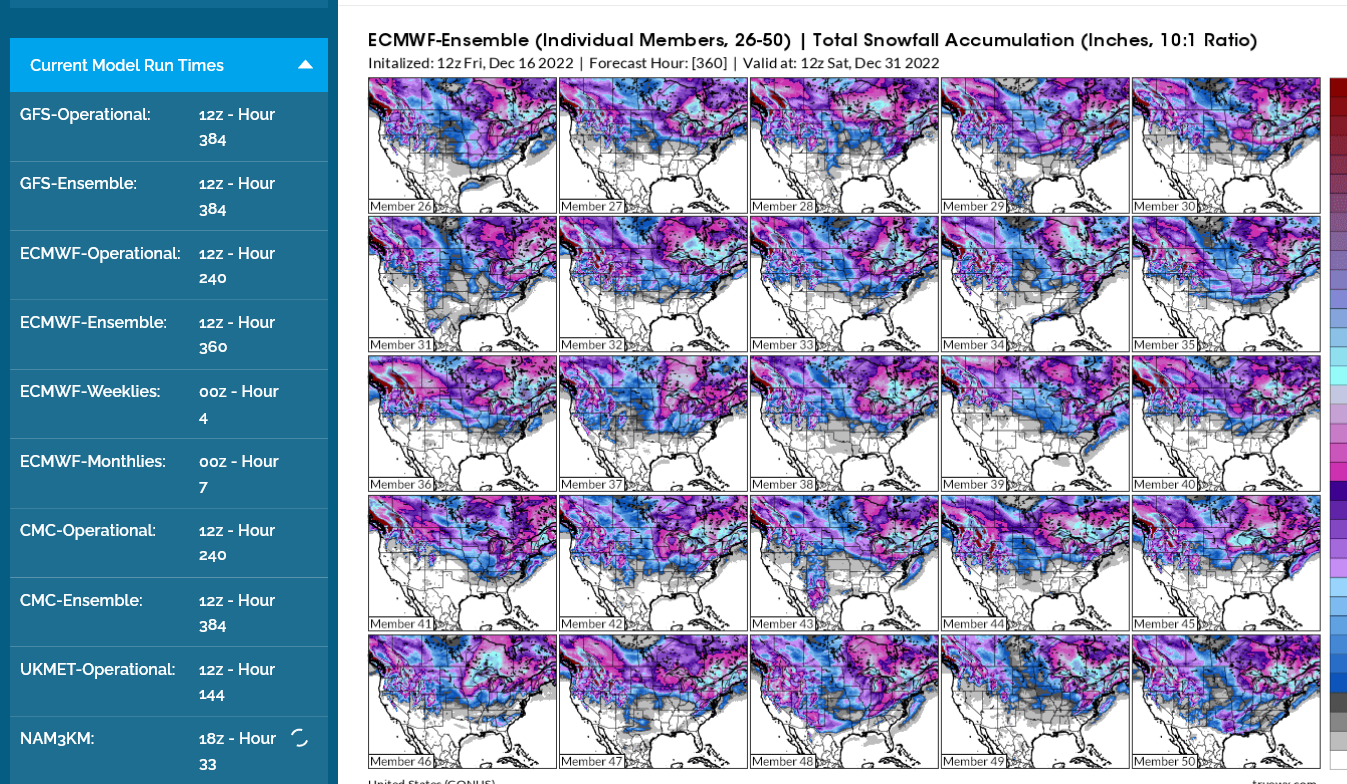
Here's a look at the individual Ensemble solutions that get averaged together to generate the average/mean above. 50 of them!
Almost half of them show at least a couple inches of snow for Evansville IN.
Around 10 of them (20%) show 6+ inches of snow for Evansville.
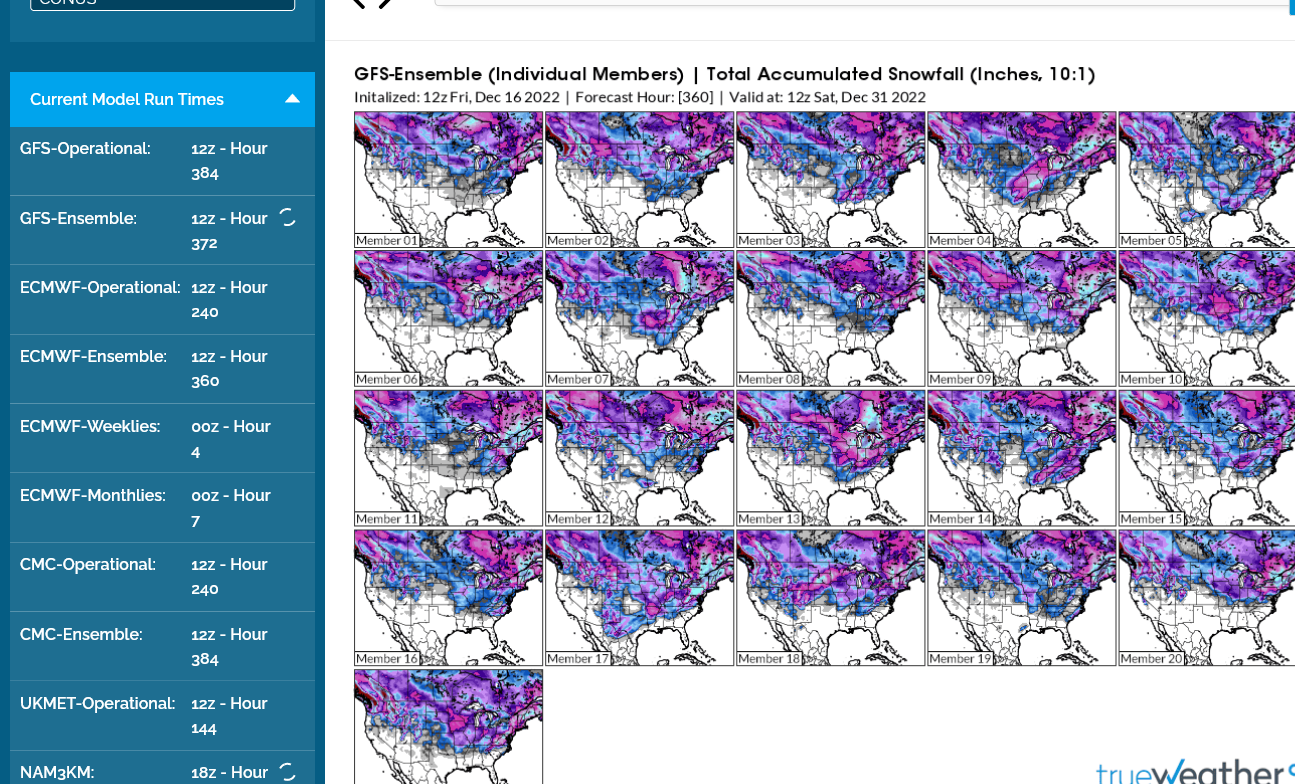
Here's the latest 2 week snowfall total from the just out 12z GEFS ensemble products.
Most of them have at least a few inches of snow for Evansville, IN. A couple have much more than that!
This is what the 30 individual ensembles/solutions think:
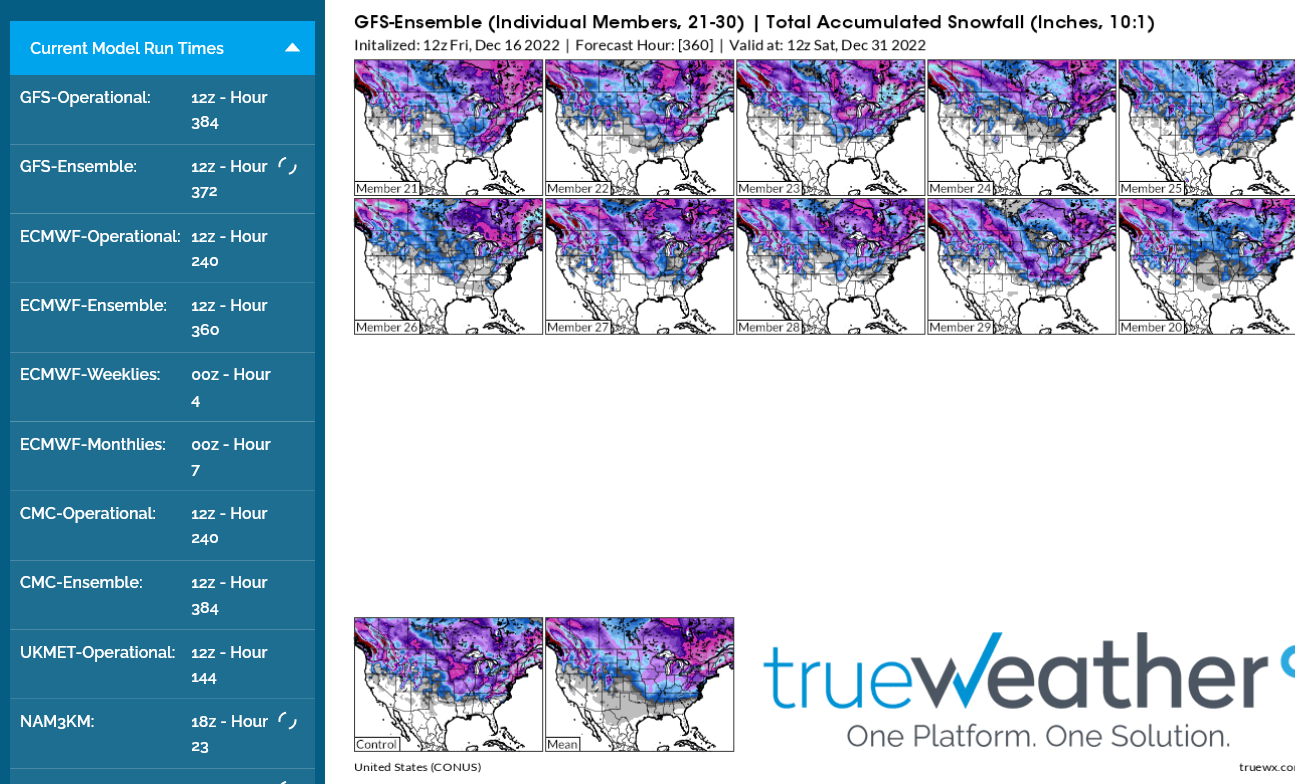
This is the average of them all below:
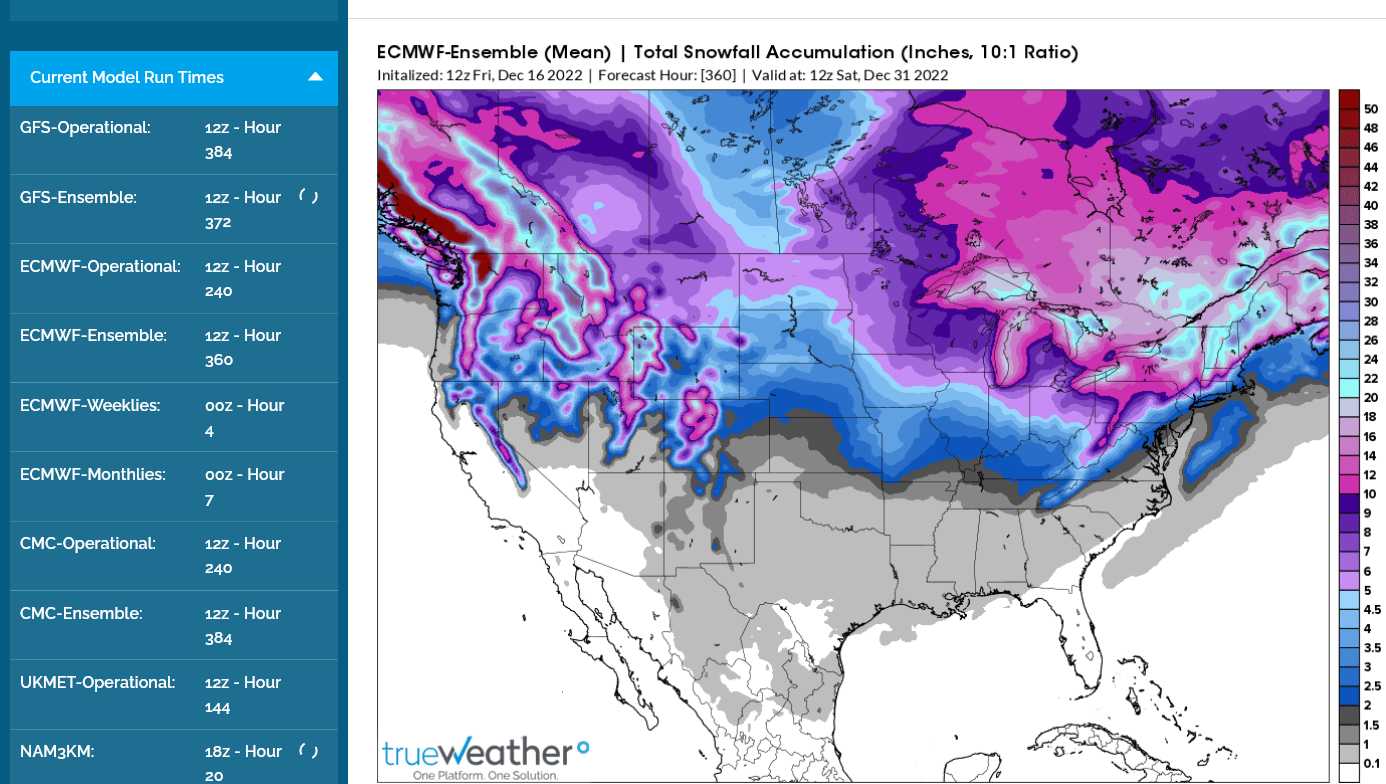
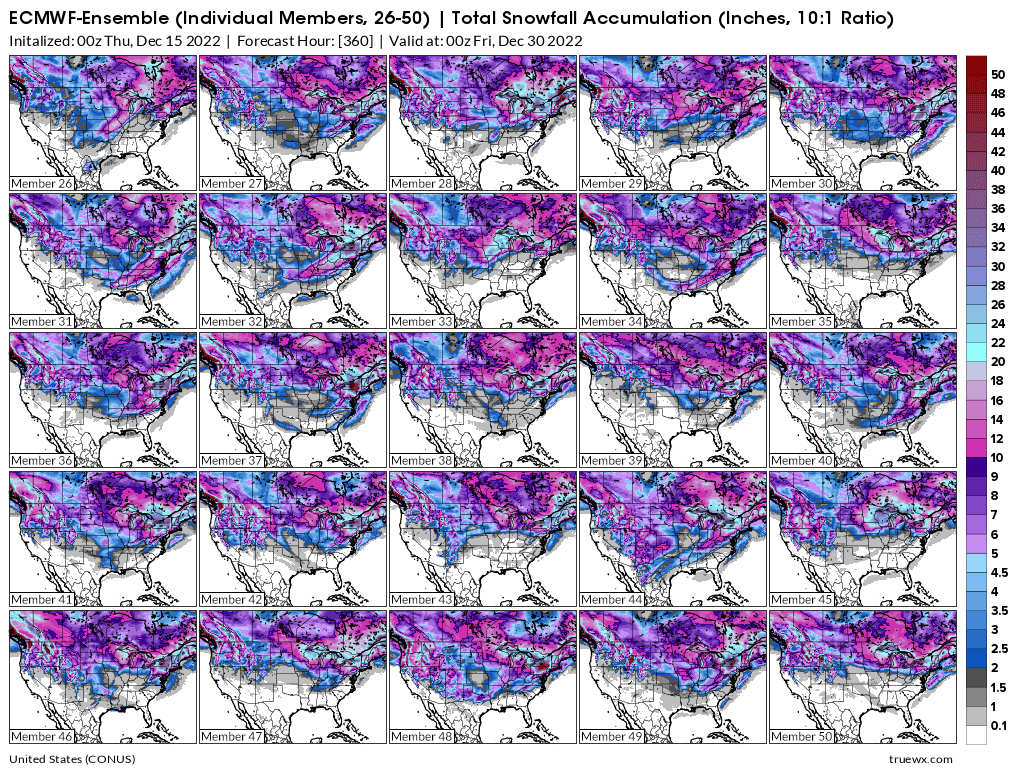
This is the just out European model ensemble average with its 50 individual solutions.
What stands out the most is that there will be an outside chance (25%) for 1 big snow event, 6+ inches, close to Evansville, IN. However, there's a 75% chance of accumulating snow from smaller systems.
We could be on the edge of a steep snowfall gradient(heavier to the north), meaning amounts might be minor or could be heavy, depending on the track.
We'll try to focus on the potential tracks of these snow systems when they get close enough to forecast. ...days before they hit.
In several days, the exact track of storm coming up on 12-23 will be more obvious and this will matter a great deal in refining the snow amounts and timing.
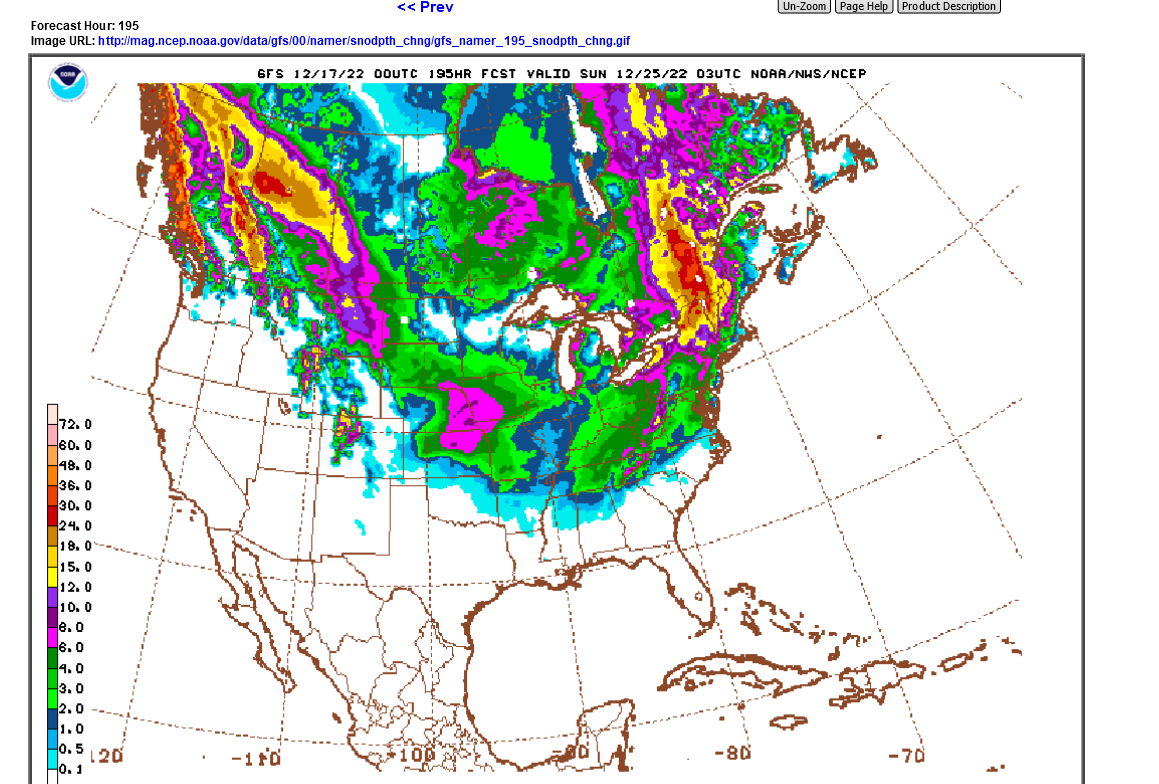
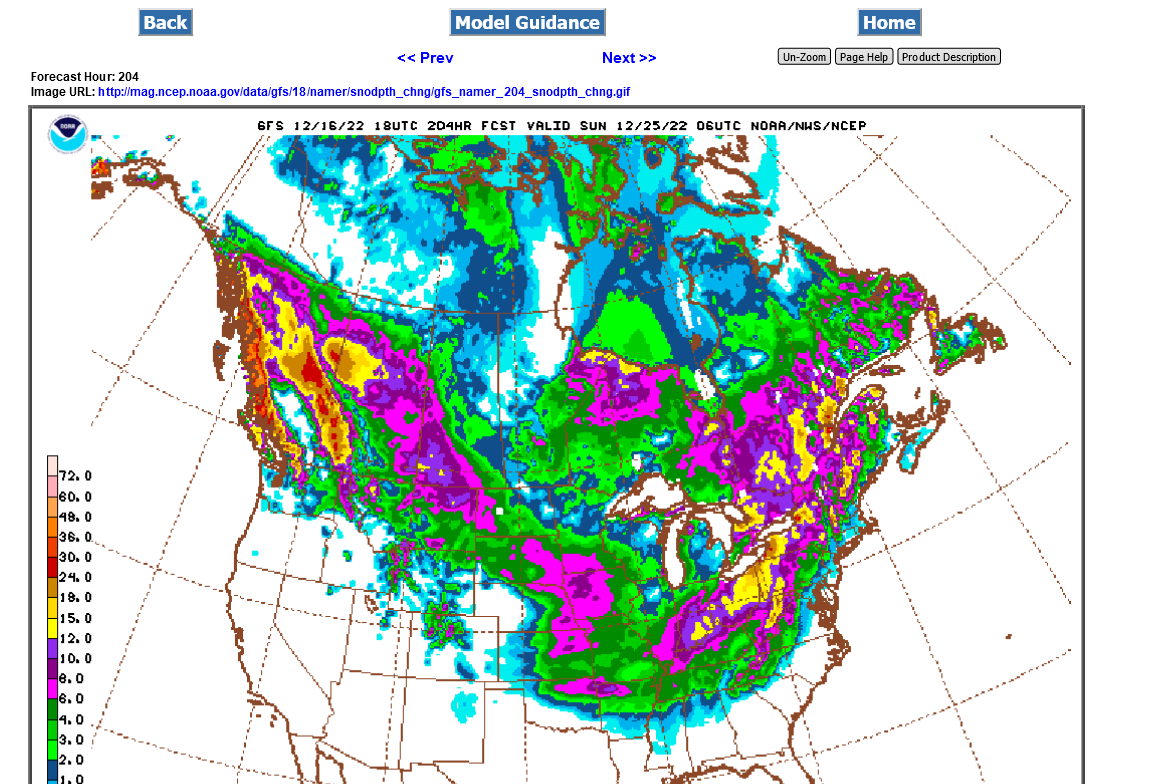
These were the last 2 runs of the GFS operational model. The just out 0z model, That shows around 2 inches, then the 18z from 6 hours earlier which shows almost 10 inches.
https://mag.ncep.noaa.gov/Image.php
++++++++++++++++++
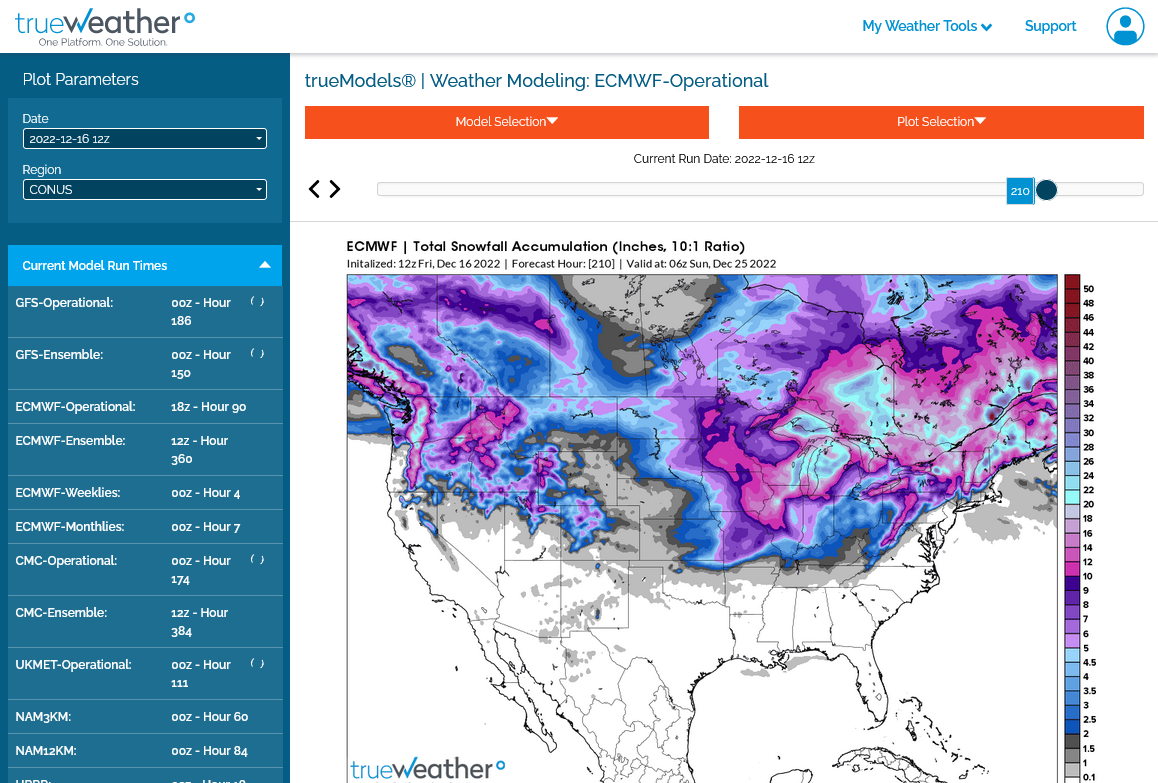
This was the previous 12z OPERATIONAL European model solution. The models WILL change.
 ++++++++++
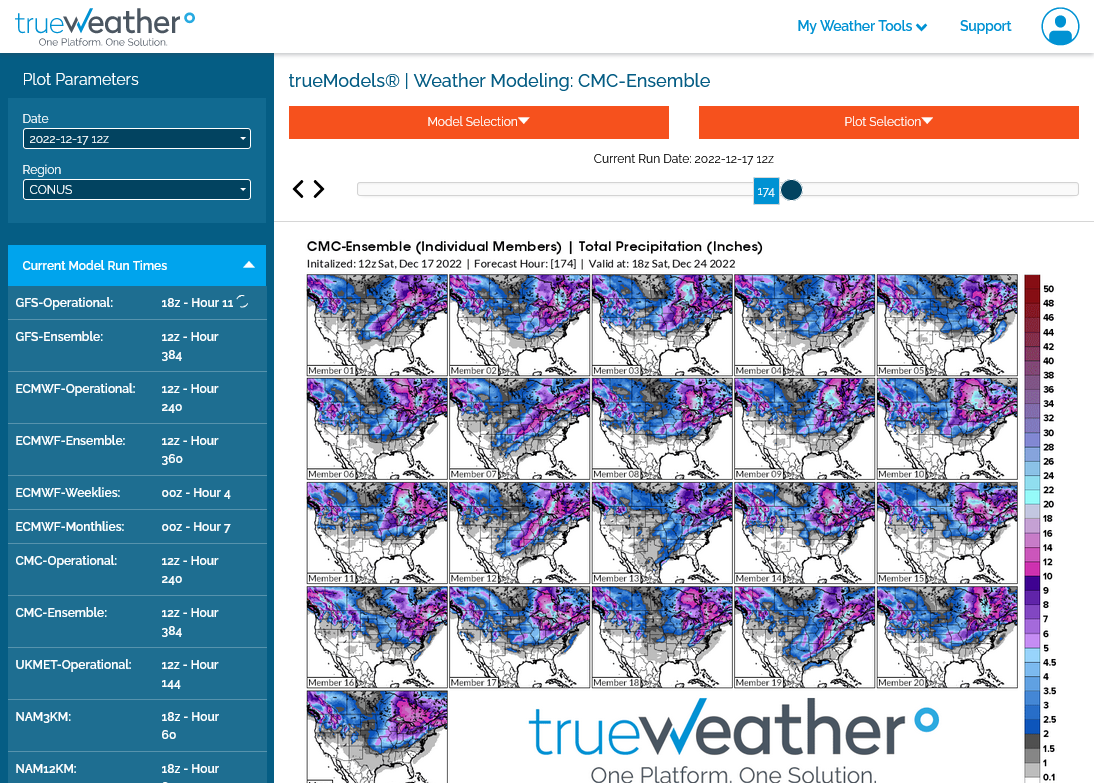
The 12z CMC model ensembles were the most bullish for heavy snow below.
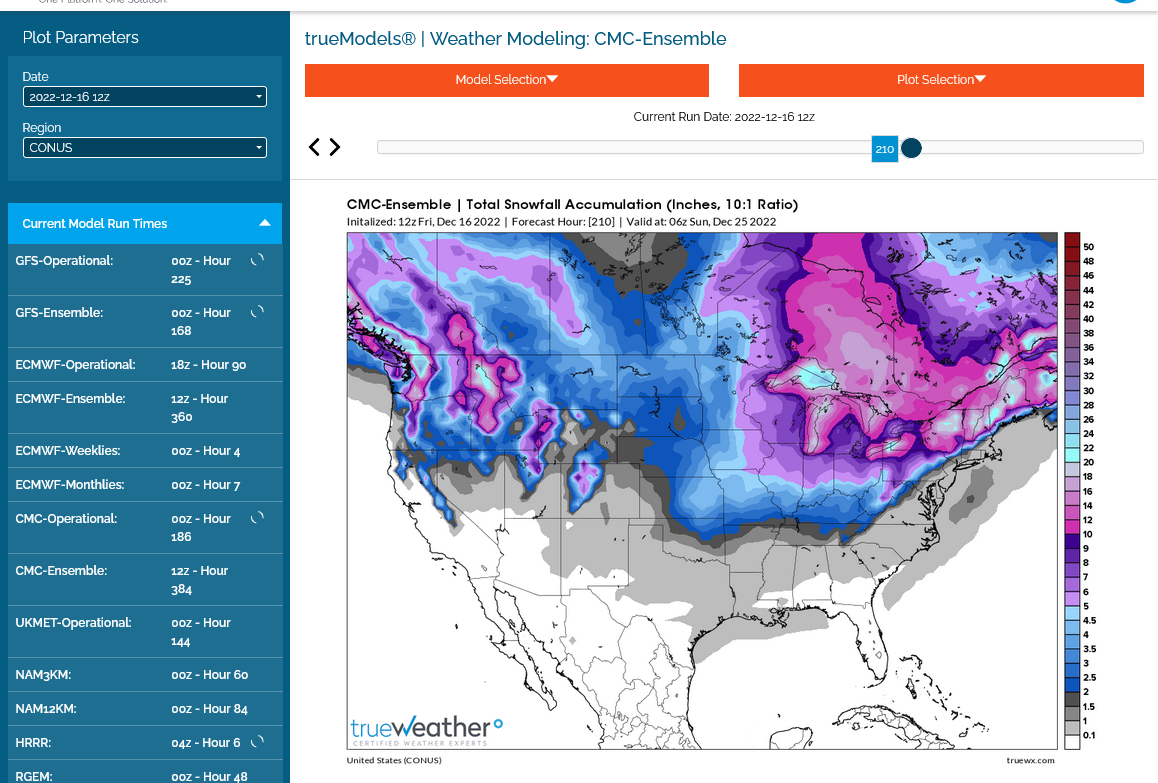
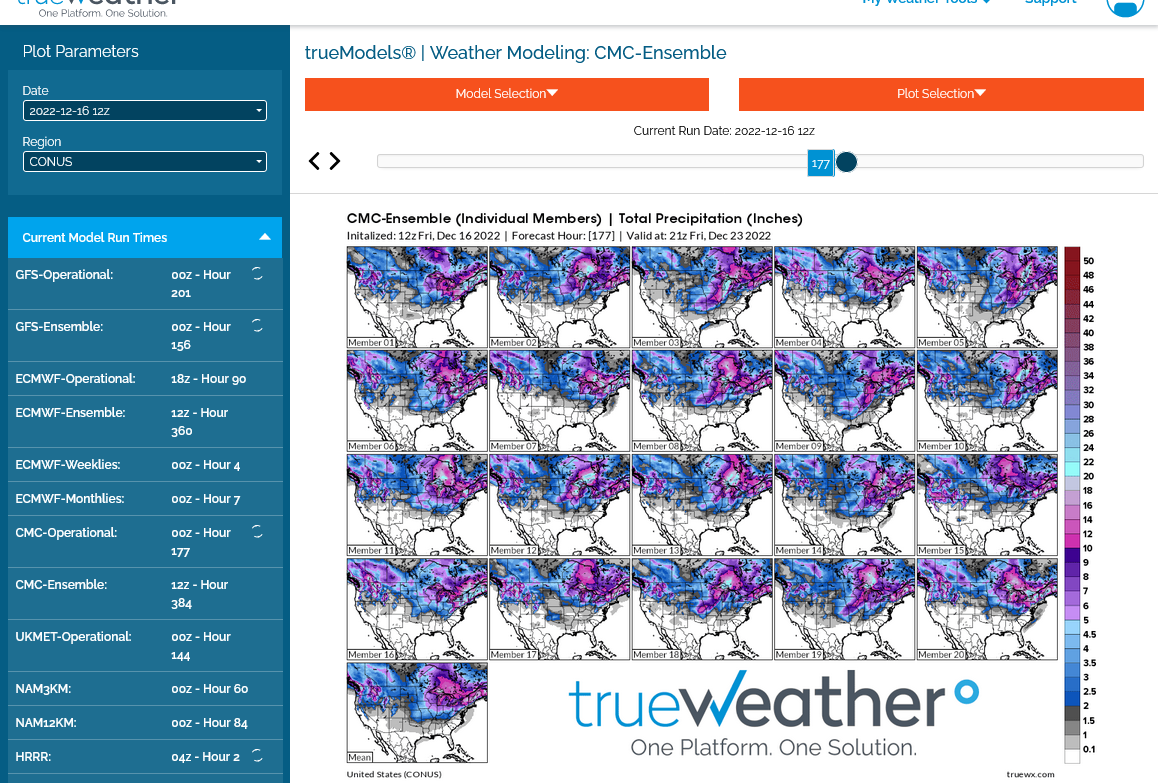 This was the mean/average below
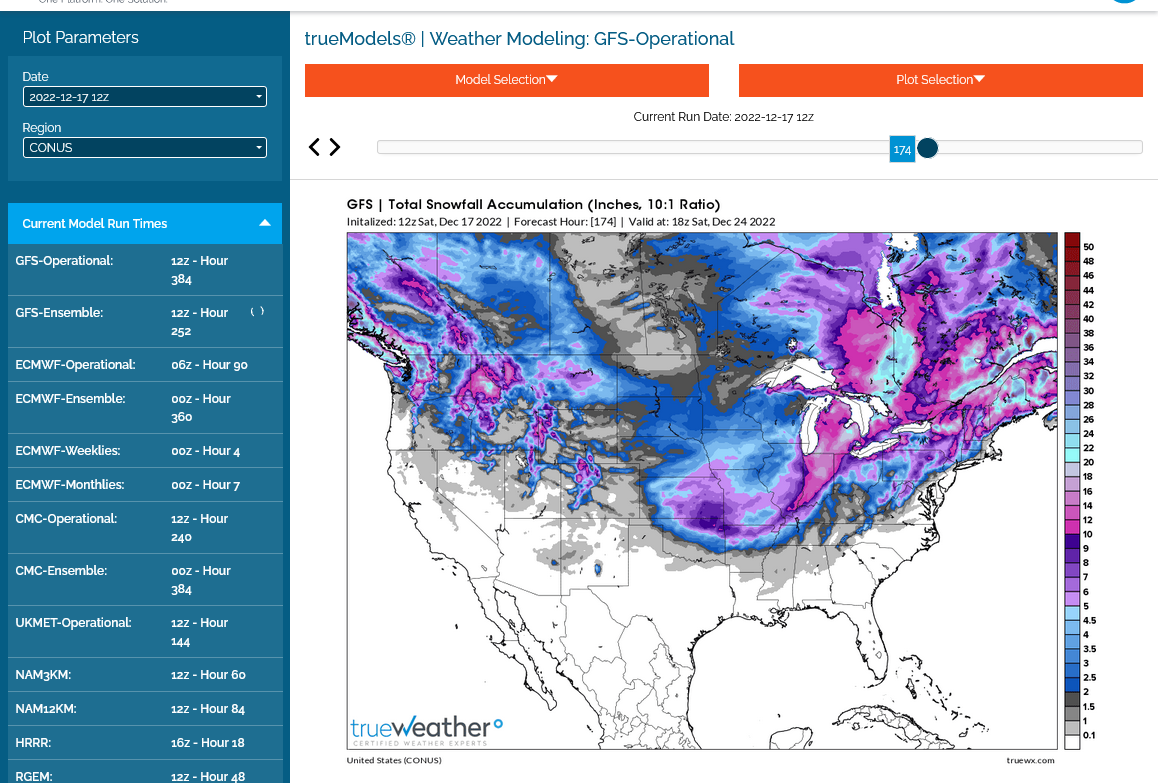
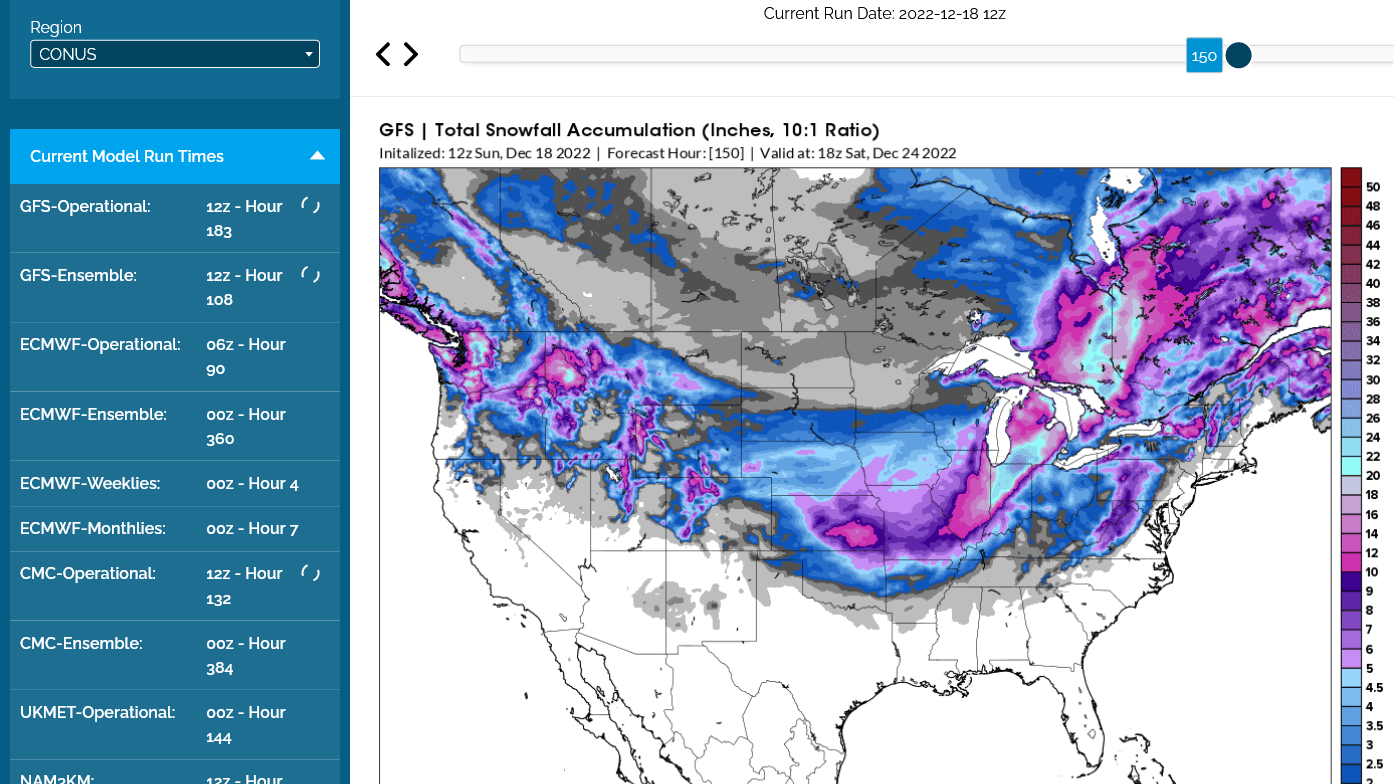
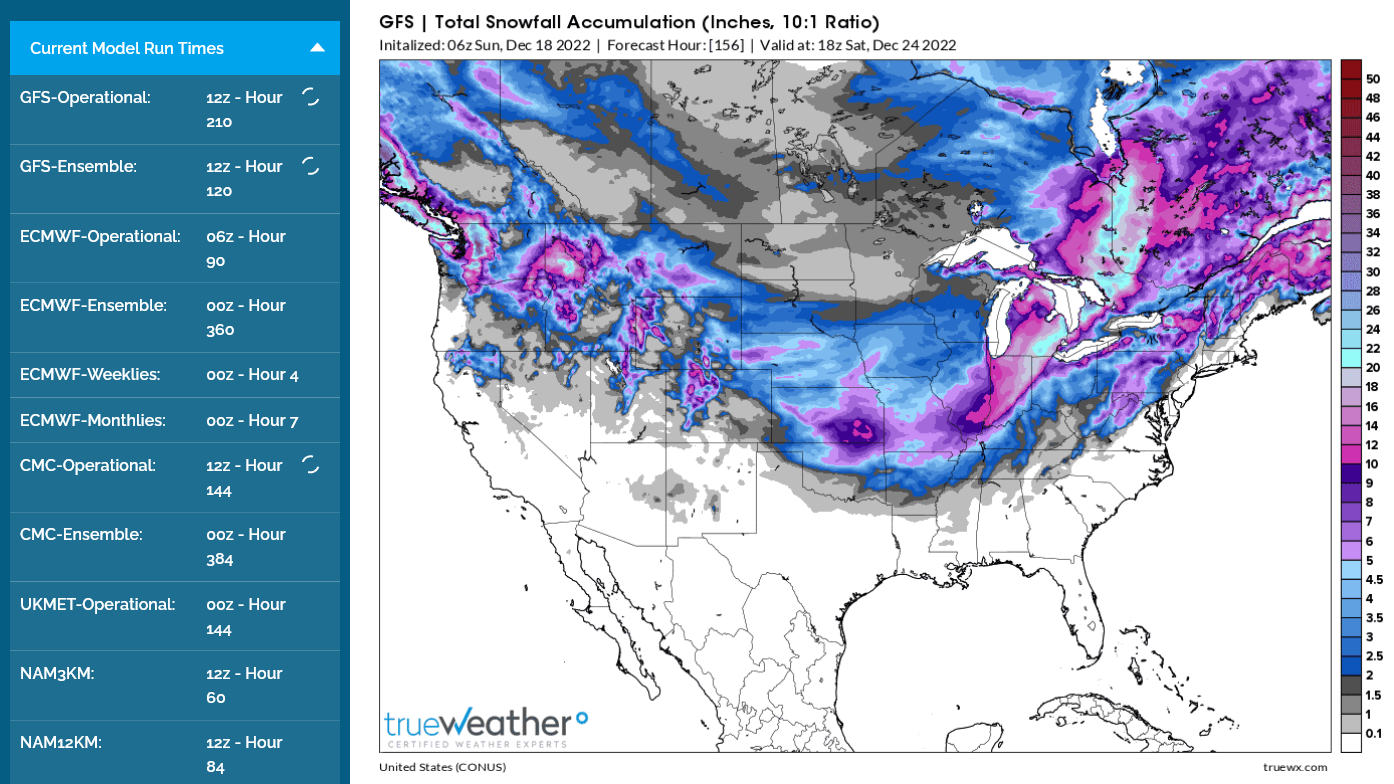
This was the just out 12z run of the GFS operational model with snow amounts thru 12-24-22.
The snow would start late Thursday in Evansville and end late Friday. The pink shade, that includes Evansville is 10+ of snow. The light blue shade by Flint, MI is 20+ inches!
The exact track of the storm is way uncertain and will change so this is just a potential snow forecast from 1 model.
However, with 100% certainty SOMEWHERE in this part of the country there will be a major, even historic Winter storm that looks much like the one from January 1978(University of Michigan shut down for the first time in history and I went streaking, running around our all mens dorm several times, where everybody was hunkered down but with their windows opened, cheering for the guy wearing only a pair of boots).
With 100% certainty temps will drop below 0 behind the system with howling winds creating extremely dangerous wind chills and huge snow drifts where the snow is heavy, especially since it will be light, fluffy/powdery, easily blown snow.
Winds will likely be gusting above 50 mph is many places.
Salt and chemicals on roadways are NOT very effective when temperatures turn bitter cold after the storm passes. Travelers late next week......stay tuned for the latest on this extremely dangerous Winter storm and cold.
The map below is just a snapshot from 1 model,
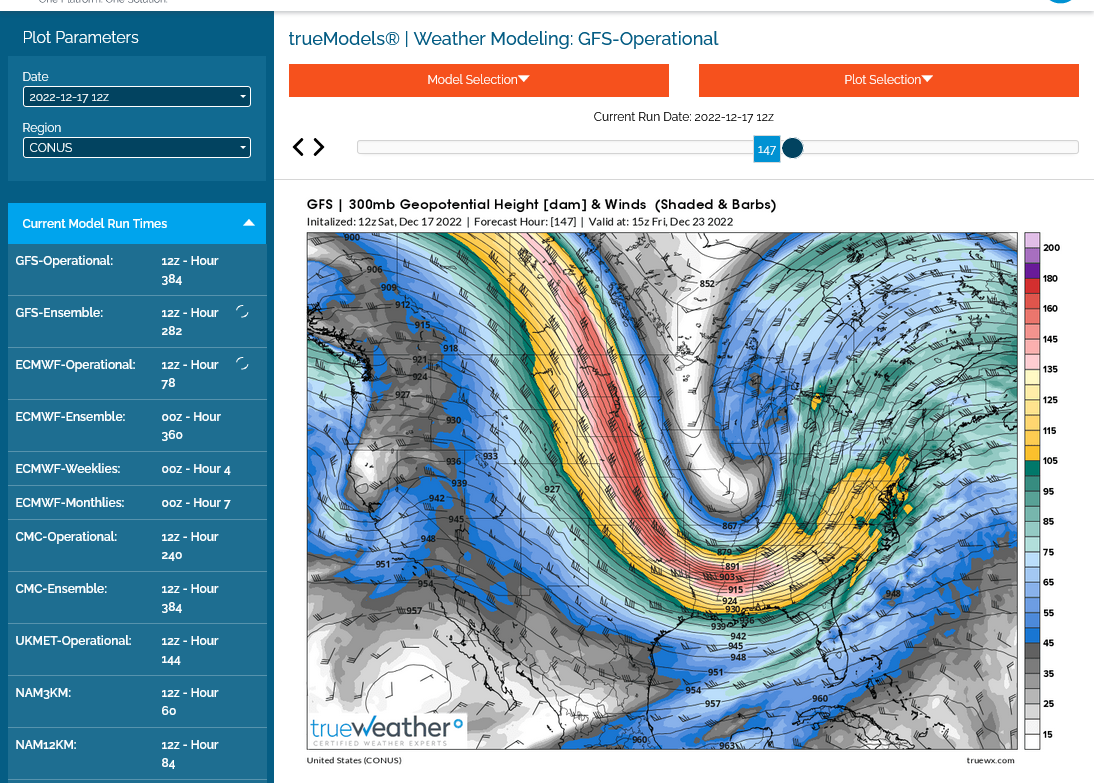
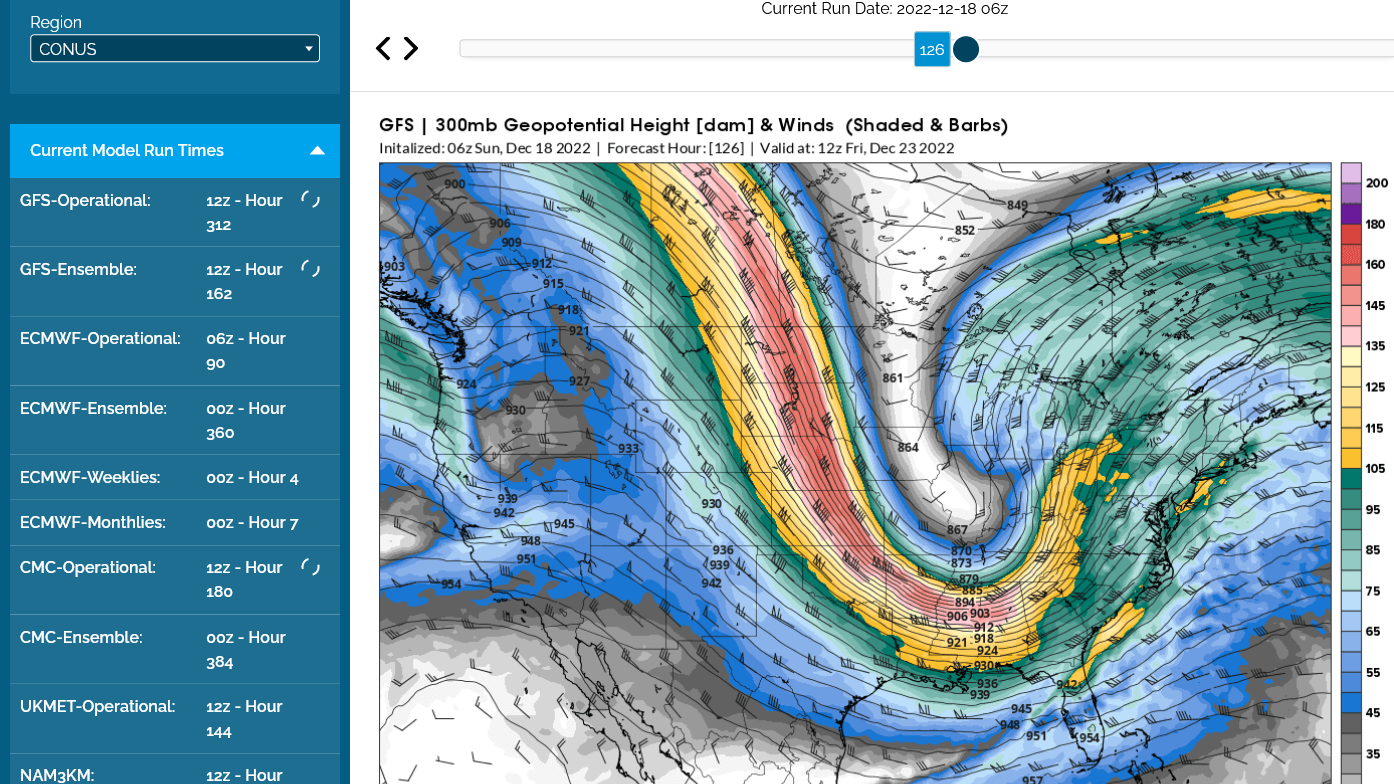
Check out this extremely powerful jet stream at 300 mb, which is around 30,000 feet/6 miles up on Friday, when the storm is strengthening rapidly.
The wind is in knots. 5 knots/hr = 6 mph.
So the jet max, 175 knot wind contour, dark red is ROARING at almost 200 mph! There is a"jet streak" imbedded within that jet stream where the highest winds are located.
Some other key forecasting tips, applying meteorological principles.
1. When the strongest jet stream (with its jet streak) is digging into the base of an upper level trough(approaching it) the dynamics create lift from the ground up and it strengthens storms(lowers surface pressure from the rising air). It deepens the upper level trough simultaneously.
This snap shot below for nextn Friday morning shows upper level dynamics extremely favorable for the storm to rapidly strengthen based on the bright red/greatest wind contours still approaching the base of the trough.
2. Additional tricky concept. A negatively tilted trough like this one is also favorable for intense storm development.
More on that below the image.
3. It's a physical impossibility that a jet stream pattern like this will not produce a monster storm. Since there is incredible amounts of extreme Arctic cold well entrenched, there will be extremely heavy snow amounts along the favored path below the area that features the GREATEST RISING MOTION(from the jet stream lifting the air below).
That atmosphere ahead of the jet stream and jet max will have certain powerful dynamics imposed on it as seen, from the perspective of the actual air movement traveling along the jet stream (not necesarily from the viewing screen).
For instance: Our left looking at the computer screen is the West Coast but that's to the RIGHT from the jet streams perspective. OK, more than you wanted to know, which is probably just........"Hey Mike, just tell us how much snow will fall!" (-:
Even better for you will be to learn some things about the weather/atmosphere while finding out what the weather will be!
+++++++++++++++++++++++++++++++++++++++
WHAT IS A "NEGATIVELY TILTED TROUGH"?
http://www.theweatherprediction.com/habyhints/127/
+++++++++++
Reality check: I'm just showing you SOME model output, especially to explain concepts and understanding.
The GFS Operational model shown on the previous page has much more snow dumping in some places right now that might not get that much snow.
Please do not confuse this with a forecast for a specific location. Technology and models have greatly advanced, with more accurate forecasting the past 4+ decades but we still have forecast track errors of hundreds of miles 5 days ahead of a storm like this.
Case in point: The Operational European model for the same time frame looks MUCH different.
If they all agreed from the get go, a week before the event, weather forecasting would not be so challenging and fun. Every model update is like looking into a crystal ball giving new hints about the future.......of the weather, before anybody else knows about it.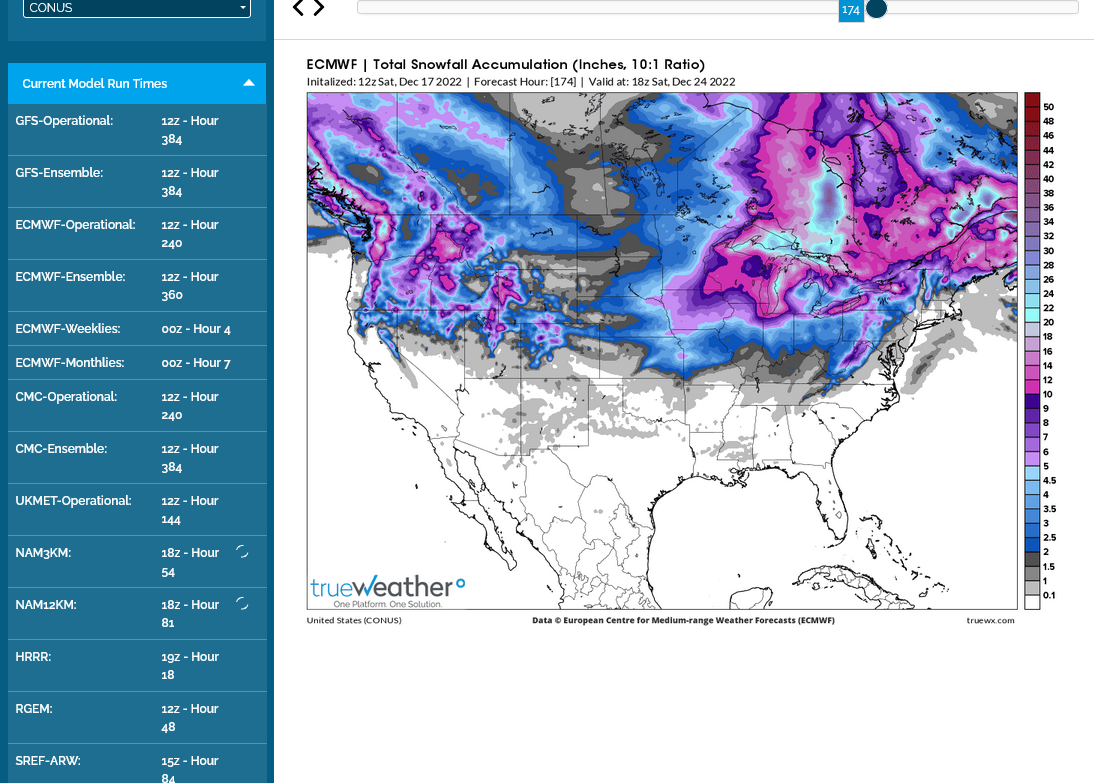
So we have an amazing dichotomy between models right now.
1. The GFS (American model) products are gung ho/bullish on snow for Evansville, IN
2. The European model products have very little snow for Evansville, IN.
What's a forecaster to do in this situation? Wait until the models have much more agreement unless there's something compelling related to certain models doing poorly or better with to lean in one direction. The European model does have better skill overall but can flop just as badly as other models. Orrrrr look at other models:
3. The CMC model ensemble solutions below ALMOST ALL have a 1978 type blizzard. So this, along with the pattern leads me to LEAN in that direction but we need the European model to catch on before gaining more confidence. Note the HUGE BLOB of extremely heavy snow, 20+ inches in the epicenter on EVERY solution. That IS going to happen in the Great Lakes to Northeast......no if's. At least a foot of snow and extremely high winds and sub-zero actual temps without the wind chill.
Will the storm come together soon enough to hit areas farther west/southwest???
If you want to learn anything and everything about weather, this guy is the one for you!
Are you a weather nut/junkie like me? Hit the link below if you want to experience what it's like going to heaven (-:
http://www.theweatherprediction.com/
+++++++++++
Here's examples that apply to or will apply to our current situation:
| PETS & WX |
| KNOWLEDGE OF SNOW COVER FOR SNOW LOVERS |
1. SNOW AND ICE ACCUMULATION (GRASS VERSUS CONCRETE)
2. SNOW AND ICE ACCUMULATION (INFLUENCE OF PREVIOUS WEATHER)
3. SNOW AND ICE ACCUMULATION (DAY VERSUS NIGHT)
4. SNOW ACCUMULATION (INFLUENCE FROM TEMPERATURE PROFILE)
5. SNOW AND ICE ACCUMULATION (INTENSITY AND DURATION)
6. THE RATE OF A SNOWFLAKE MELTING AS IT FALLS
7. MELTING RATE OF A SNOWFLAKE (ON WATER VS. LAND)
8. THE COOLING EFFECTS OF SURFACE SNOW COVER
9. SNOW TO LIQUID EQUIVALENT
10. SNOW AND CLEAR SKIES
+++++++++++++++++
16. CAN IT BE TOO COLD TO SNOW?
17. WHAT CAUSES THUNDERSNOW?
18. WHAT IS DIFFERENCE BETWEEN ICE FOG AND FREEZING FOG?
22. CONVERSIONS USING THE DOMINANT TEMPERATURE SCALES
23. DEFINING A "VORT MAX" AND A "VORT LOBE"
24. KNOTS, PLUS OTHER WIND INFORMATION
25. WHAT CAUSES GIANT SNOWFLAKES?
26. WHAT IS A "NEGATIVELY TILTED TROUGH"?
27. WAA VS. LOCAL HEATING ON THE 850 MB FORECAST MODELS
28. USING PERCENTAGES IN FORECASTS
33. TYPES OF ICE TO SCRAPE OFF THE CAR
42. JET STREAK WIND AND JET STREAK MOVEMENT
44. FORECASTING SURFACE HIGH USING 850-mb TEMP
45. THE TOP 5 REASONS POLAR AREAS ARE COLD
46. WEATHER AND BASEBALL FLIGHTI added this one for extra fun-no baseball in cold!
47. INSIDE RH AS A FUNCTION OF OUTSIDE WEATHER
+++++++++++++++++++++
we have had below average temps in our area for more than 2 months now. each time they predict that temps will go up then we get revised lower.
for nov we had about 18 days below norm, and only 5 days above normal. the above norm temps were just 2 or 3 degrees above. the below norm temps were 4,5,6 or 7 degress below. (or more).
Thanks bear!
For others here, bear lives in Tucson, AZ. These were the average temperatures the last 30 days and 90 days. The 2nd map is the anomaly(departure from average).
Sure enough bear, you're exactly right about how cool its been in Arizona!
https://www.cpc.ncep.noaa.gov/products/tanal/temp_analyses.php

++++++++++++++++++++++++

This may be the coldest air mass in a decade or longer if we have a deep snow pack in place.
From the NWS serving Evansville, IN, their forecast high next Friday is 14 degrees, which is the coldest high in 18 years. If we get deep snow, I predict that it will be even colder than that during the day and also on Saturday/Christmas Eve.
I'm confident that the high for Friday, December 23rd WILL BE AT MIDNIGHT and temperature will fall into the single digits or even below 0 during the day. Then below 0 on Friday night with high confidence and a wicked wind chill waaay below 0.
With temperatures plunging as the day goes on.
Wind chills could be down to -20 Deg. F for awhile before the wind eases up.
Time to be prepared to keep pipes from freezing. 10 inches of snow will insulate the ground and keep subzero temps from freezing most pipes buried beneath the snow.
Not much snow and temps this cold, with pipes vulnerable to freeze.....you better keep the water trickling out of the kitchen sink, starting when the threat hits! Or take other actions to protect pipes and other property/life that doesn't do well with this kind of weather.
If we get the deep snow and subzero cold, birds, squirrels and wild life will have an extremely hard time toughing it out.
They love black oil sunflower seeds.
.CLIMATE...
High temperatures in the teens to lower 20s are pretty rare in December across our region. Our current forecast high of 17 in Paducah on December 23 would be the coldest December high temperature since 2004. Similar rarity at Evansville, where the forecast high of 14 would also be the coldest December high temperature since 2004. High temperatures may remain below freezing for more than 3 consecutive days, which hasn`t happened in December since 2010 in Paducah.
For a wx history lover like me, the highest Montana/N Wyoming SLP next Thursday morning 12/22 will be fun to track. That's because the model consensus is progging near all-time (back to late 1800s) record lower 48 US high barometric pressure there!
Today's 12Z model progged highest SLP along with change since yesterday's 12Z in millibars:
GFS 1068 (+3)
JMA 1068 (+7)
ICON 1065 (-2)
Euro 1064 (-1)
CMC 1063 (+3)
UKMET 1053 (+3)
AVG 1063.5 (+2)
Record 1064 (set in Miles City, MT, on 12/24/1983. The 2nd highest is 1063.3 mb, which was at Helena, MT, on 1/10/1962.)
This shows we're headed to a very highly anomalous setup next week.
Link that includes highest on record SLP in lower 48:
Wonderful contribution, Larry!
I actually remember that air mass in late December 1983, including what it did to Florida, which is a state with weather that you track very closely and have made hundreds of great posts about in recent years. I never know that was the all time record high US barometer reading.
https://www.tandfonline.com/doi/abs/10.1080/00431672.1984.9933264?journalCode=vwws20
https://www.orlandosentinel.com/news/os-xpm-1989-12-22-8912222663-story.html
+++++++++++++++++++++++++
Here's a great article from the Dodge City, KS NWS that I included because it shows the surface map on the morning of that all time high barometric pressure reading. The actual temperature close to the center of the high was as low as -47 Deg. F!
https://www.weather.gov/ddc/December1983ArcticOutbreak
Many other cities had their coldest December and coldest stretch of weather in recorded history during that late December time frame of 1983:
https://www.dfwweather.org/wxblog/?p=74
++++++++++++++++
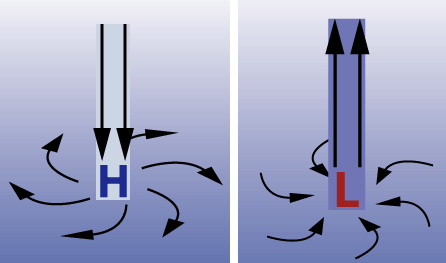
One reason for extremely high pressure readings with cold is that the air is sinking from aloft and piling up(then spreading out) at the surface. Because of gravity the air has weight. Colder air is also more dense. The colder the air, the higher the barometer reading, all other things being equal.
https://sciencing.com/temperature-affect-barometric-pressure-5013070.html
THIS WEATHER PUTS ME IN MIND OF THE WINTER OF 2019, WHEN W/O SNOW COVER AND THE TEMPS GOT SO BITTER...THE COUNTRYSIDE SEWER LINES FROZE, ALONG WITH MANY BASEMENT WALL CRACKING.... INCLUDING MY RENTAL HOUSE!
IT'S ALSO PUTS ME IN MIND OF 1978.
NOT THAT I'M WANTIN' ANOTHER BLIZZARD, BUT... I'D SURE APPRECIATE 6-9 INCHES OF SNOW COVER BEFORE THE GROUND FREEZES SOLID!
Jean,
In N.Ohio, you have a pretty good chance to get that heavy snow!
Here's the just out 0z Canadian ensembles surface forecast for next Thursday morning's potential record breaking high barometric pressure event that Larry alerted us to:
https://weather.gc.ca/ensemble/charts_e.html?Hour=108&Day=0&RunTime=00&Type=pnm
Here's the same product 36 hours later.
Look at the crazy deep low pressure forecasts!
The pressure gradient between that and the robust surface high farther west is going to whip up some very powerful winds!
https://weather.gc.ca/ensemble/charts_e.html?Hour=144&Day=0&RunTime=00&Type=pnm
THANKS, MIKE
I USE WUNDERGROUND, THEY KEPT CHANGING THE WIND & SNOW FORECAST, BUT...THEY'RE MOSTLY HOLDING ON TO THAT LAST 24 HR. FORECAST. 25-30 MPH NW STEADY WINDS WITH 8" OF SNOW, FOR THURS & FRI.
16 FOR THE LOW ON THURS NIGHT...HIGH OF 29 & LOW OF 4 FOR FRIDAY >>>>>>
SAT IS A HIGH OF 8... A LOW OF 3. 13H & 7 LOW FOR SUNDAY
THOSE MAPS ARE ALMOST SCARY!!!!!
I JUST CHECKED THE WEATHER FORECAST FOR ST. LOUIS!! BRRRRRRRRRR
THE SITE FOR FNMOC HAS CERTAINLY BEEN REDESIGNED ~ MERCY SAKES ~
TALK ABOUT A MAZE!!
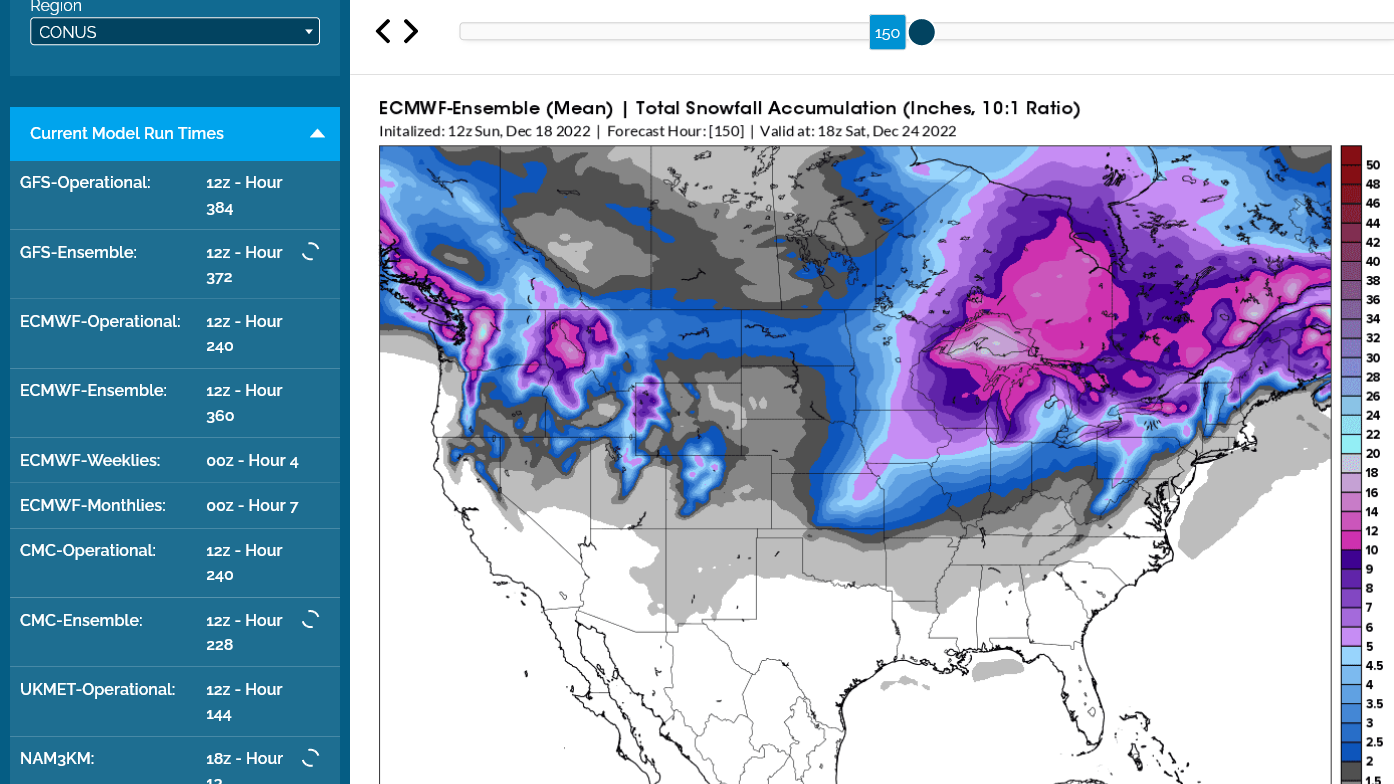
Snow amounts on ALL the models went UP overnight. So we can be more confident in the snowier forecasts at this point.
This was the solution for the last 2 GFS operational model runs. The event will start in 4 days, so we're getting close enough to be more confident and detailed/specific. Evansville is right on the greatest snow gradient right now, so small changes in the track mean a difference between 5 inches and 15+ inches of snow.
Same thing for my family in Detroit being on the edge of the steep snowfall gradient(we're driving up there on 12-26 after they've cleared the main highways). This looks extremely similar to the blizzard of January 1978!
Just out 12z run.......that's 30 inches along the IN/MI border! Evansville gets around 6 inches, previous run was double that.
+++++++++++++++++++++++++++++++++
Previous, 6z run below. Evansville gets 12+ inches because everything was farther southeast by around 50-100 miles.
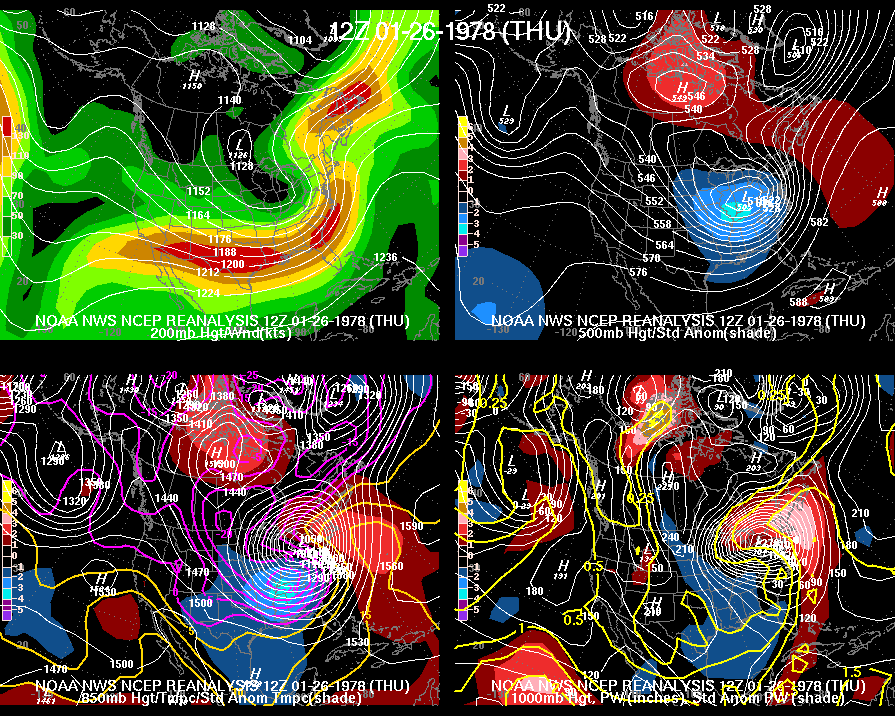
Because the surface level and snow amounts for this storm are similar to the Blizzard of 1978, I was thinking these storms are similar.
Looking back, this one has a MUCH different jet stream configuration....much more powerful!
january 1978 below. Top left is the jet stream.
https://www.weather.gov/images/ind/blizz78/reanal_1978012612.gif
Look at the difference with the jet stream coming up late this week. WOW! The orientation and strength are much different than 1978 and are a sight to behold.
+++++++++++++++++++++++++++++++++++++++
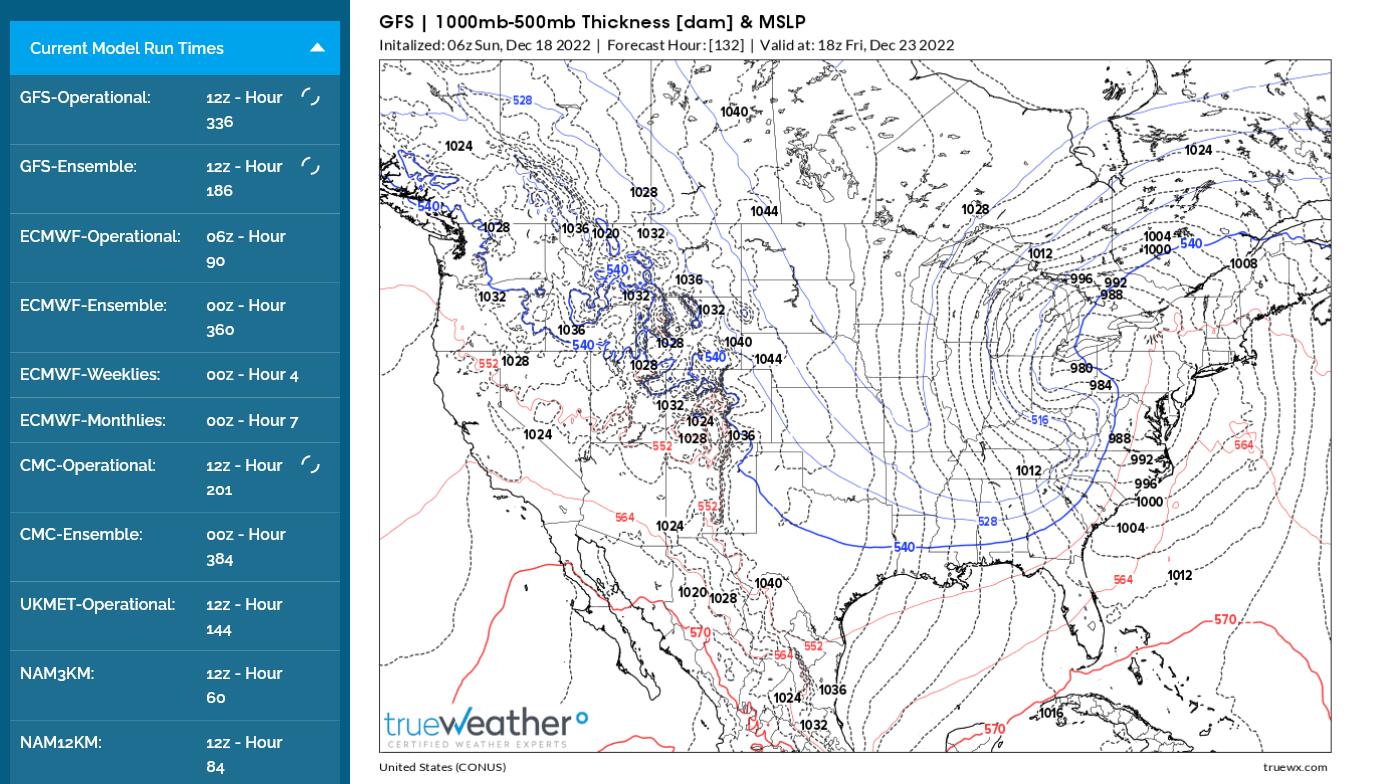
Here's the 850 map for temps(around 1 mile up) at that time, Friday morning. The heaviest snows will likely be just northwest of the 0 Deg. C isotherm.
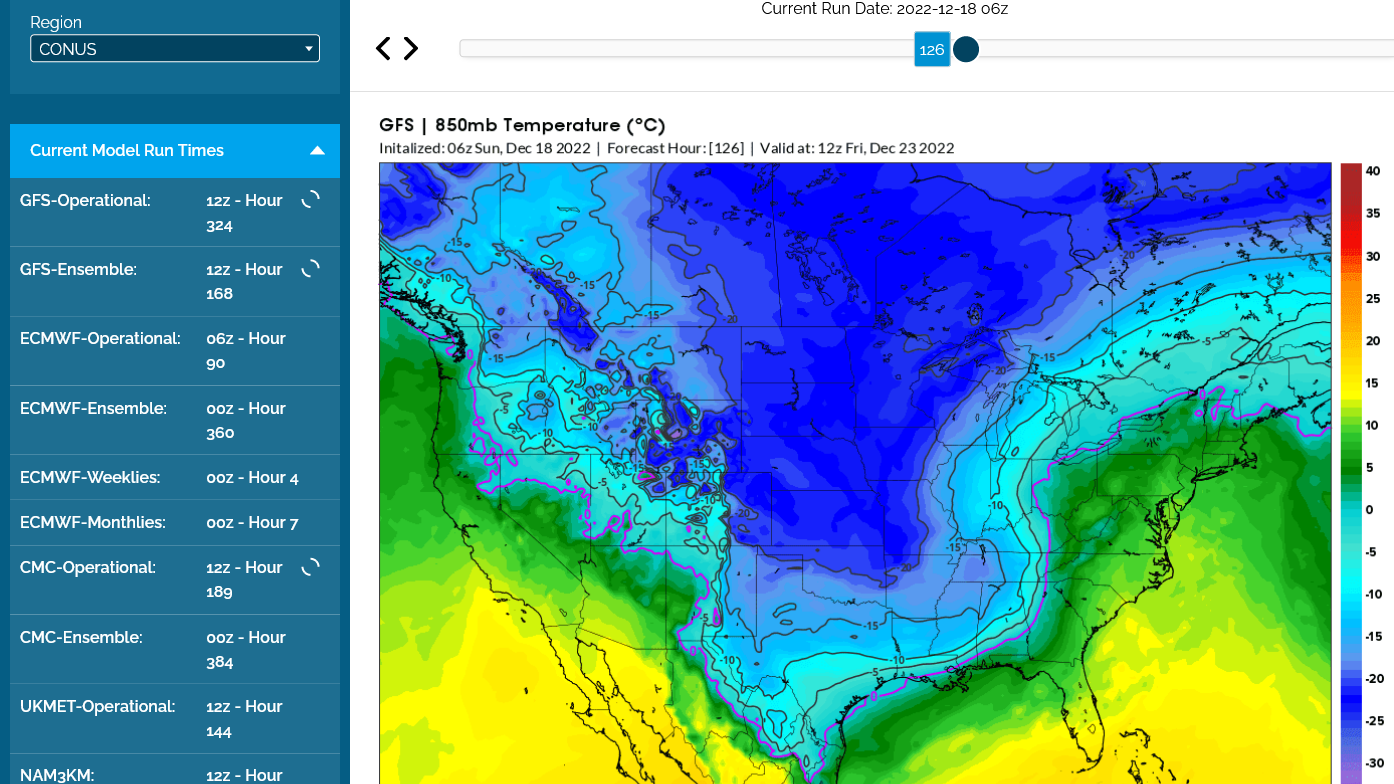
The incredibly powerful jet stream digging into the trough above will cause this to be one of the fastest intensifying storms in history! Quickly creating an off the charts pressure gradient with the high to the west. I'm thinking that a few wind gusts, could potentially exceed 70 mph, with widespread wind gusts of 55 mph+!
This will create one of the biggest life threatening Winter storms in history when you dial in the widespread brutal cold across so much of the country, even 1,500+ miles west of the Low!
This WILL cause some power outages. A damaging, severe thunderstorm wind is 58 mph. Winds will be gusting to or above that across several ENTIRE STATES for numerous hours.....not just a batch of counties in a severe thunderstorm warning that lasts less than 30 minutes.
Trees having no foliage will help lessen the number of trees that fall and limbs that break.
You don't want a power outage with an air mass that will, with certainty drop the temperature below 0 and cause wind chills to plunge to -25 Deg. F or colder. Some places -50 Deg. F farther west in the N.Plains that won't have winds as high.
After a severe thunderstorm takes out your power, you might not have AC for awhile along with the other no power problems but when its 0 outside, you MUST HAVE HEAT IN YOUR HOUSE or it becomes life threatening in some cases.
Power crews repairing outages will have brutal conditions, with wind chills in the double digits below 0. The pace to fix them could be hampered.
Homes unable to be heated during this extreme cold because of a power outage will be vulnerable to frozen pipes and the residents will be challenged to stay warm. House plants could be killed and other issues.
This will also create monster sized, widespread snow drifts, in places that are perpendicular to the wind, where the greatest amounts fall especially since much of the snow will be light/fluffy and easily blown in the colder air.
https://www.seacoastonline.com/story/lifestyle/2013/02/13/snow-drifts-explained/49103015007/
+++++++++++++++++++
As mentioned at the top, we will need to start additional threads to continue the analysis, discussion, forecasting, education and advising on this extremely dangerous Winter Storm and bitter cold outbreak that's just over 4 days away now.
The European ensemble model is back to only 1.5" of snow for Evansville, IN.
I'M 40 MILES FROM BOTH INDIANA & MICHIGAN.
OUR SNOWFALL GUESS JUST GOT UPPED TO 10" / STILL AT 25-30 MPH WINDS
OTHER THAN HAVING POWER OUTAGES OR DAMAGE... I'M EXCITED. LOL
WEEEEEEEEEEEEEEEE
Update for 12Z model runs today for the highest SLP in mb in the lower 48 on 12/22 vs runs from 24 hours ago:
GFS 1067 (-1)
ICON 1065 (0)
JMA 1064 (-4)
Euro 1061 (-3)
CMC 1058 (-5)
UKMET 1051 (-2)
AVG 1060.5 (-3)
Record 1064
So, although it came down 3 mb today, it still averages near a whopping 1060 mb and 3 of the 6 models still have a record (tied or new).
Thanks Larry,
This will be an historic weather event FOR SOME PLACES! If you hadn't pointed out the extreme barometric pressure element to it, I would have completely missed that! Extremely appreciated!!
Most of the 0z models have shifted the track of the storm and heavy snow .much farther west of the previous track, something like 200 miles.
This means adjusting the most likely amount of snow in Evansville down to 3 inches or less with the heavy amounts looking most likely north and west of a line from St. Louis to Chicago.
Last night, the models increased snow amounts, now its just the opposite.
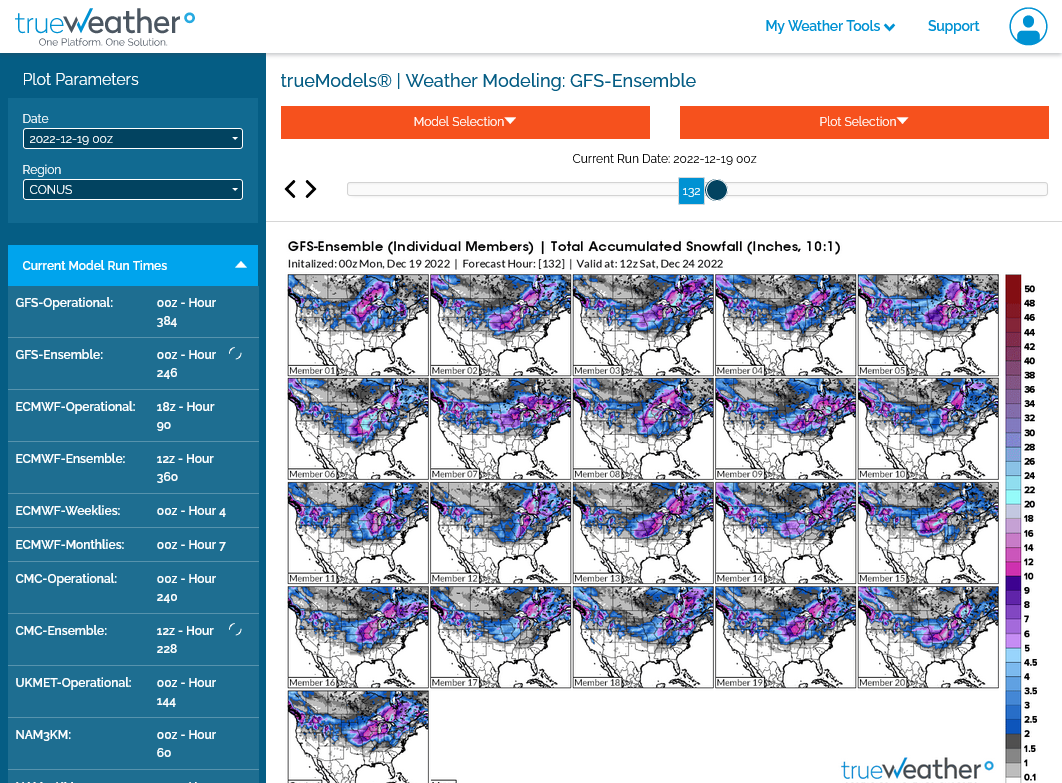
Here's a sample of some of the GEFS ensemble solutions:
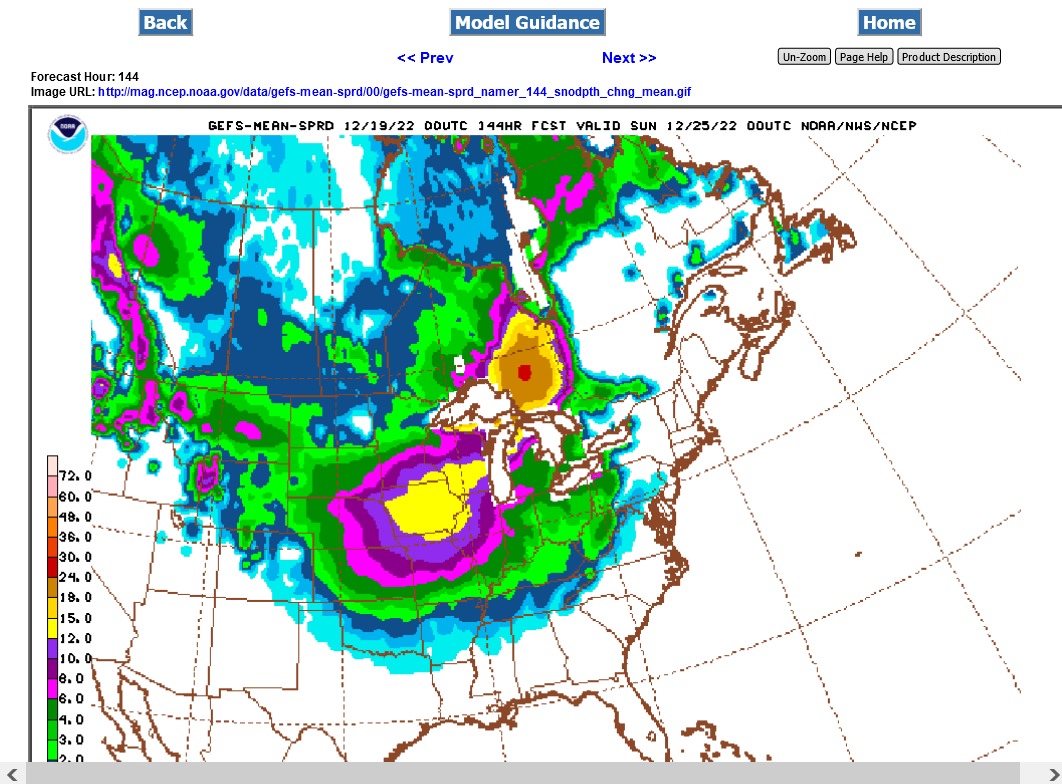
Here's a look at the average of all of them combined from a different site that you can get without paying. TrueWeather charges for the products that I've been showing.
The GEFS below shows IA at the center of the heaviest snow now (over a foot) with Evansville almost 4" the result of a small minority of the ensembles have 10+ inches that boosts the average of the vast majority that are less than 3" .
https://mag.ncep.noaa.gov/Image.php
The just updated 6z GEFS and products continue the previous trend of tracking the storm and heaviest snows farther northwest.
when back in my office, I’ll post maps and stet a new thread…. Evansville continues to be positioned to get 3 inches or less of total accumulation Which is now what my forecast is.
this will be adjusted if need be based on model output as we get closer.
the bitter cold can’t be dodged like the heaviest snow.
however this farther west track will allow the coldest air to moderate more and with less northerly component in the wind direction…….more westerly when the cold is hitting….so temperatures will not be quite as cold and winds not quite as strong for Indiana.
deep Snow cover causes air temperatures to be as much as 10 degrees colder in some situations Compared to bare ground..
areas Receiving less snow from this dangerous winter storm will not be quite as cold…..but can still drop to just below 0 and have wind chills in the double digits below zero ……life threatening cold!
THEY'VE GOT ME BACK DOWN TO LESS THAN 6" & A LITTLE STRONGER WINDS
MIDNIGHT 38 DEGREES & RAIN UNTIL 2-3 AM ON FRI. MORNING....
32 DEGREES @ 4AM ~ SNOW UNTIL LATE EVENING ON FRI.
10 DEGREES @ 8AM ~~ 30 MPH SW WINDS
__________________________
LOL HARD TELLIN' WHAT SHOWS UP... MIGHT EVEN GET SOME THUNDER IN THAT SNOW
This thread is being continued here:
12-19-22: Bitter Cold Coming!