Been an extraordinarily unique time to discuss weather the past 2 weeks.
Previous weather discussions:
12-21-22-Showtime! Tracking the Storm/Cold
https://www.marketforum.com/forum/topic/91626/
12-19-22: Bitter Cold Coming!
https://www.marketforum.com/forum/topic/91552/
12-12-22 ALERT: Bitter cold coming!!
https://www.marketforum.com/forum/topic/91423/
Also related: Arctic Amplification or just natural weather?
Everything caused by the climate crisis
https://www.marketforum.com/forum/topic/91691/
+++++++++++++++++++++++++++
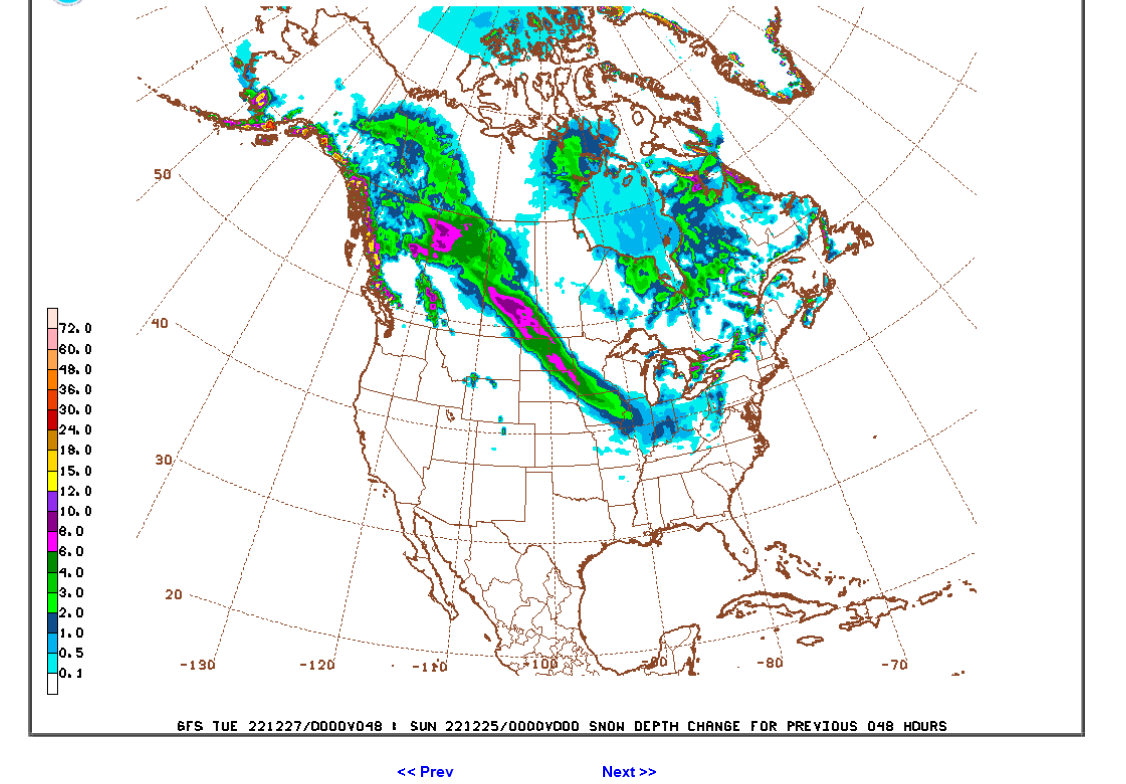
A perturbation in the upper level flow will be dropping down on the backside of this upper level trough as it departs early next week which will cause some light snow, maybe an inch or 2 on Monday, the 26th.
This one is a keeper for Winter Weather interests. Press your mouse on the image to enlarge/get more.
Winter Weather Forecasts
https://www.wpc.ncep.noaa.gov/wwd/winter_wx.shtml
Snowfall Probability Forecasts
The following charts depict the probability of snowfall reaching or exceeding the specified amount.
Preliminary Forecasts
Current issuance cycle: 12Z (updated 1411Z, December 19, 2022)
All viewing options are available through the links below.
|
| Specific accumulation thresholds for Days 1-3: | All accumulation thresholds for: | |
| ≥ 1 inch | ≥ 8 inches | Day 1 |
| ≥ 2 inches | ≥ 12 inches | Day 2 |
| ≥ 4 inches | ≥ 18 inches | Day 3 |
| ≥ 6 inches | ||
Current issuance cycle: 12Z (updated 0828Z, December 19, 2022)
| Day 1 | Day 2 | Day 3 |
≥ 4 inches | ≥ 4 inches | ≥ 4 inches |
≥ 8 inches | ≥ 8 inches | ≥ 8 inches |
≥ 12 inches | ≥ 12 inches | ≥ 12 inches |
24-, 48-, and 72-Hour Snowfall Percentile Accumulation Forecasts for Days 1-3
Day 4-7 Outlook
Current issuance cycle: 12Z (updated 0445Z, December 19, 2022)
|
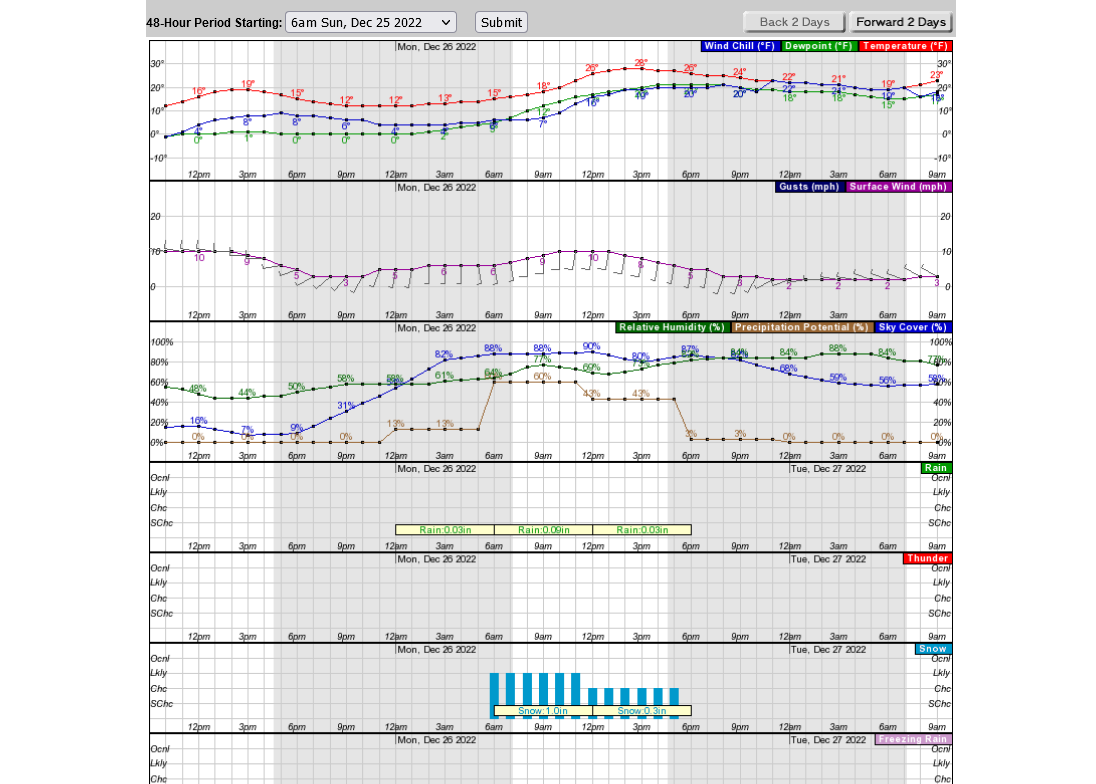
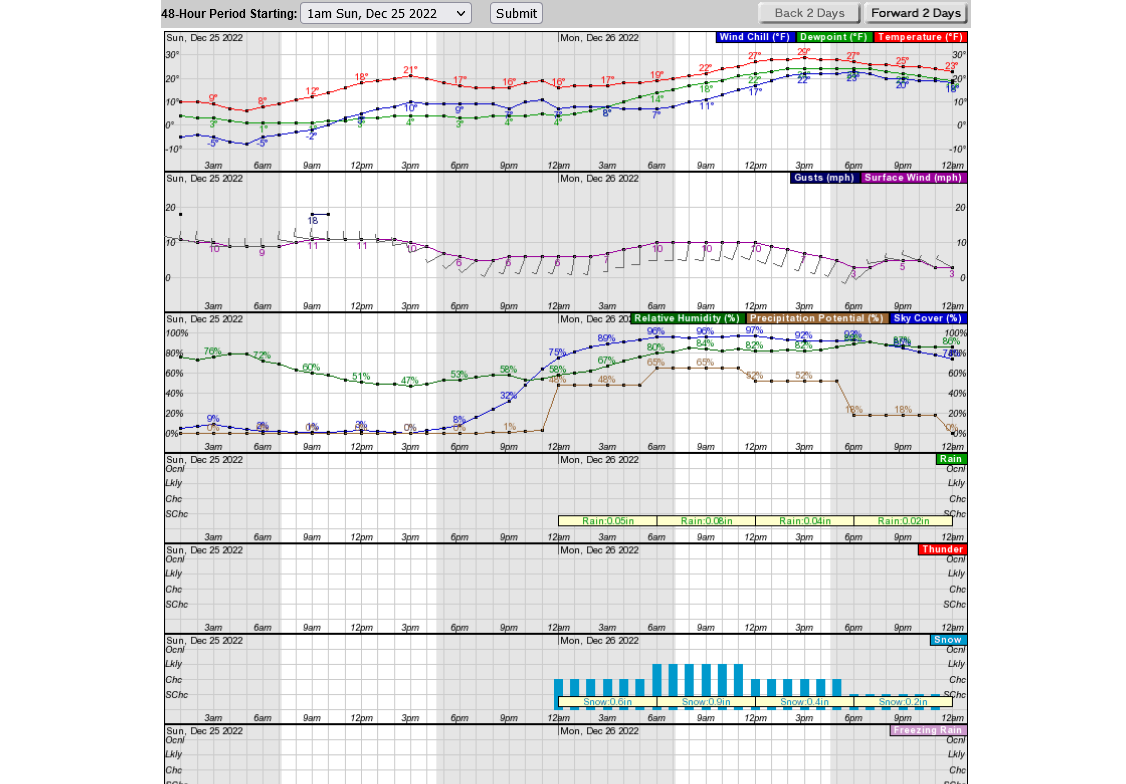
Here's the Evansville Merry Christmas and day after Christmas forecast from the NWS numerical computer generated guidance.
Starts 10am on 12-25-22 and goes out 48 hours. 1.3" inches of snow on Monday.
That WON'T be something that continues next week. Just the opposite. Temps will go well above average by late in the week as we hit the 50's!
++++++++++++++++++++++++
You can get high/low temperature forecasts that are updated a couple times/day automatically here:
https://www.marketforum.com/forum/topic/83844/#83851
Highs for days 3-7:
https://www.wpc.ncep.noaa.gov/medr/medr_max.shtml


+++++++++++++++++++++++++++++++++++++++++++++++
Lows days 3-7 below:
https://www.wpc.ncep.noaa.gov/medr/medr_min.shtml
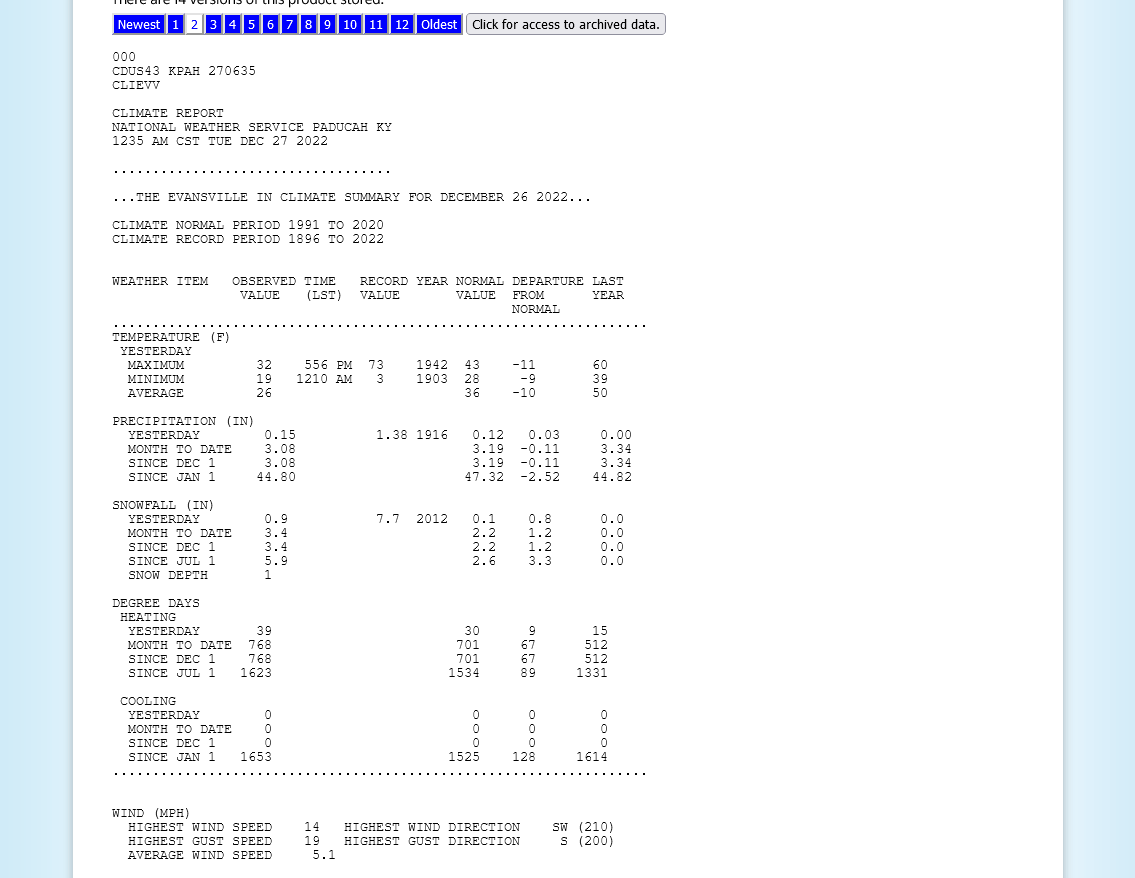
WUNDERGROUND WAS CORRECT ON OUR SNOW AMOUNT < 3"
NEXT THURS. - SUNDAY ... WUNDERGROUND HAS US IN THE 50'S & 1" RAIN OVER THAT PERIOD
AT DAYBREAK THIS MORNING, WE WERE -7 DEGREE... THE HIGH TODAY WAS -0.4
WE'RE NOW AT -3
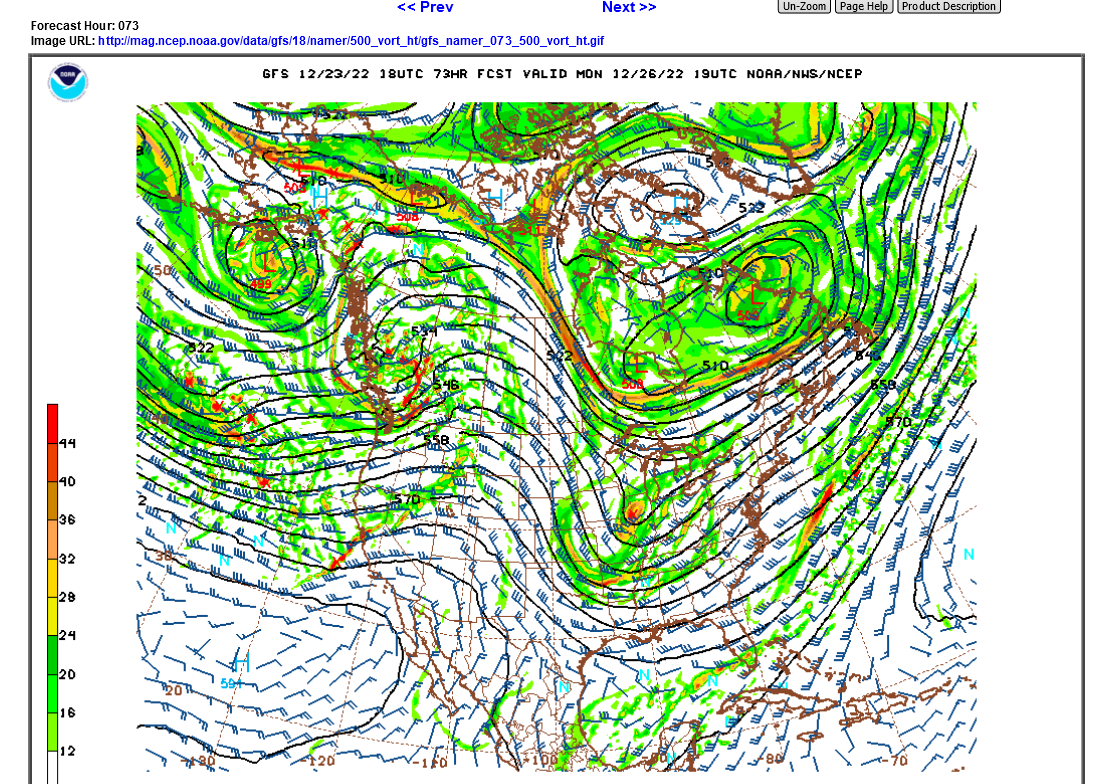
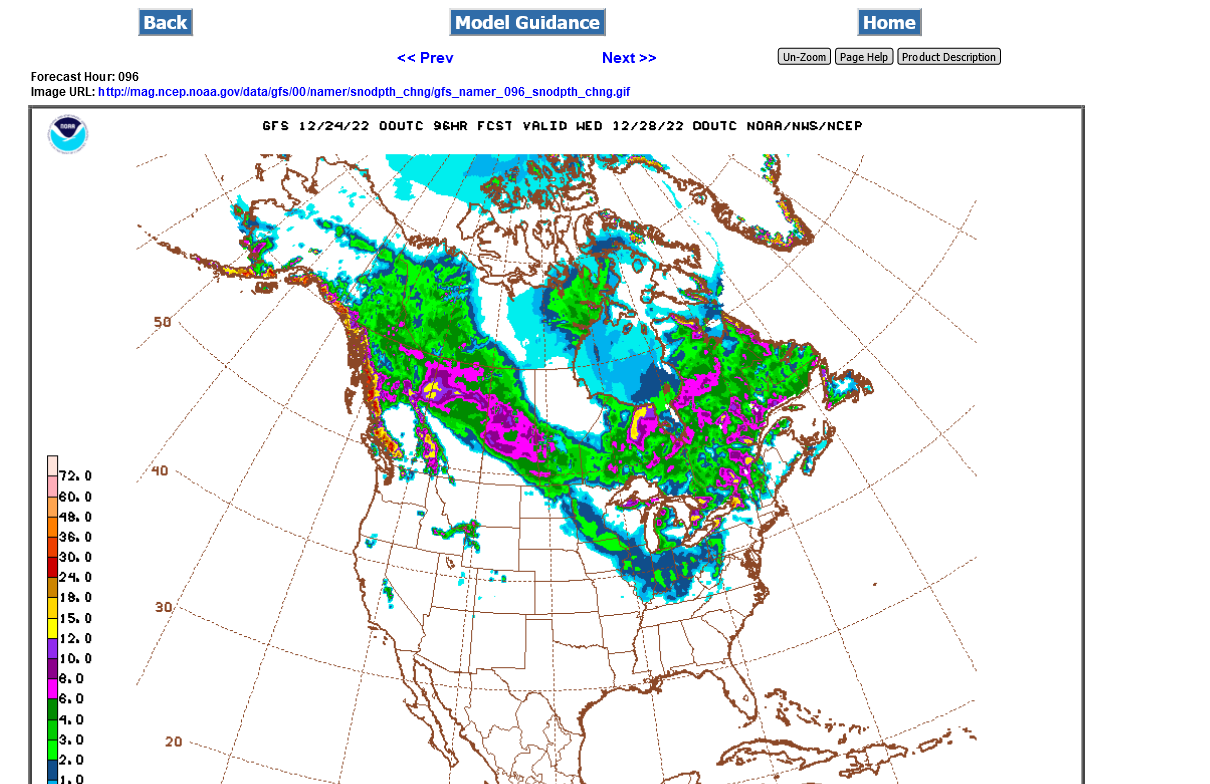
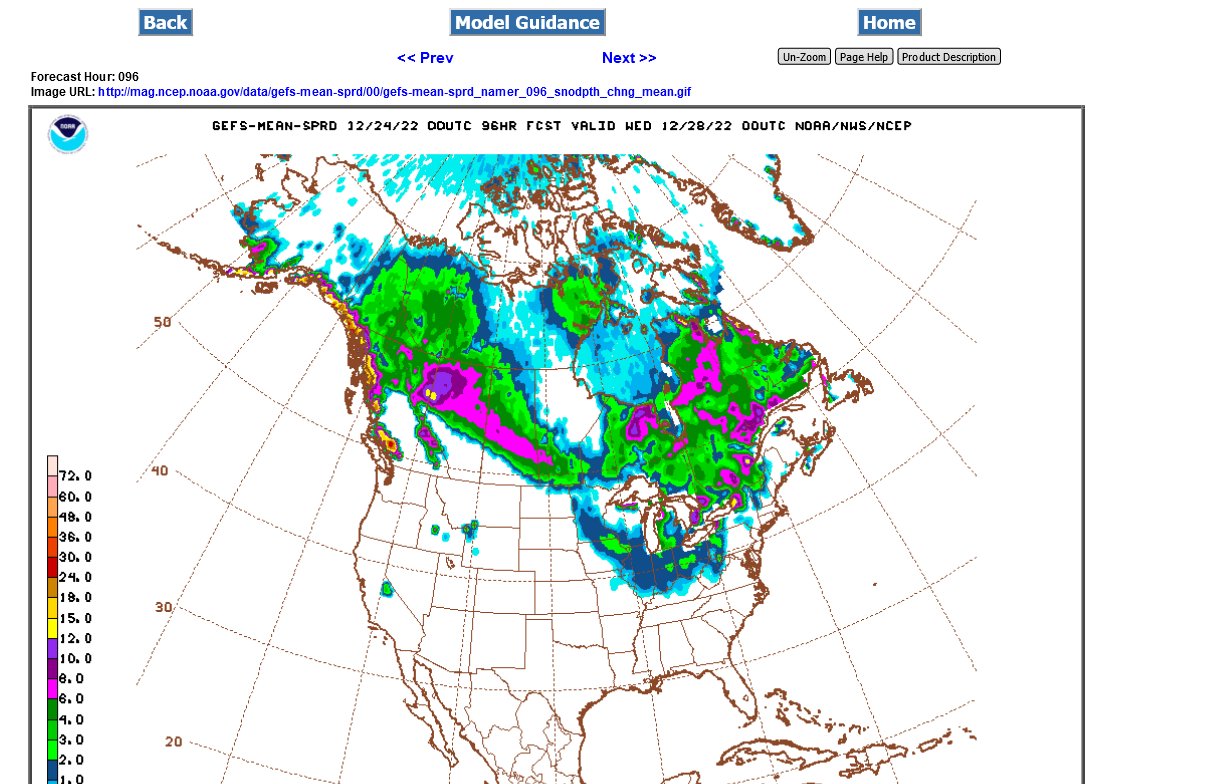
Latest 0z GFS and GEFS (ensemble) snow total forecast for the Monday event. Light accumulation, maybe an inch, 2 at the most:
We've been knocked off the internet for most of the past 24 hours, possibly by an attack from an entity that doesn't like my posts on the fake climate crisis or Ukraine.
Not much change in the very minor snow event of the huge warm up that follows.
The snow on the ground early in the week will be melted away at the end of the week.
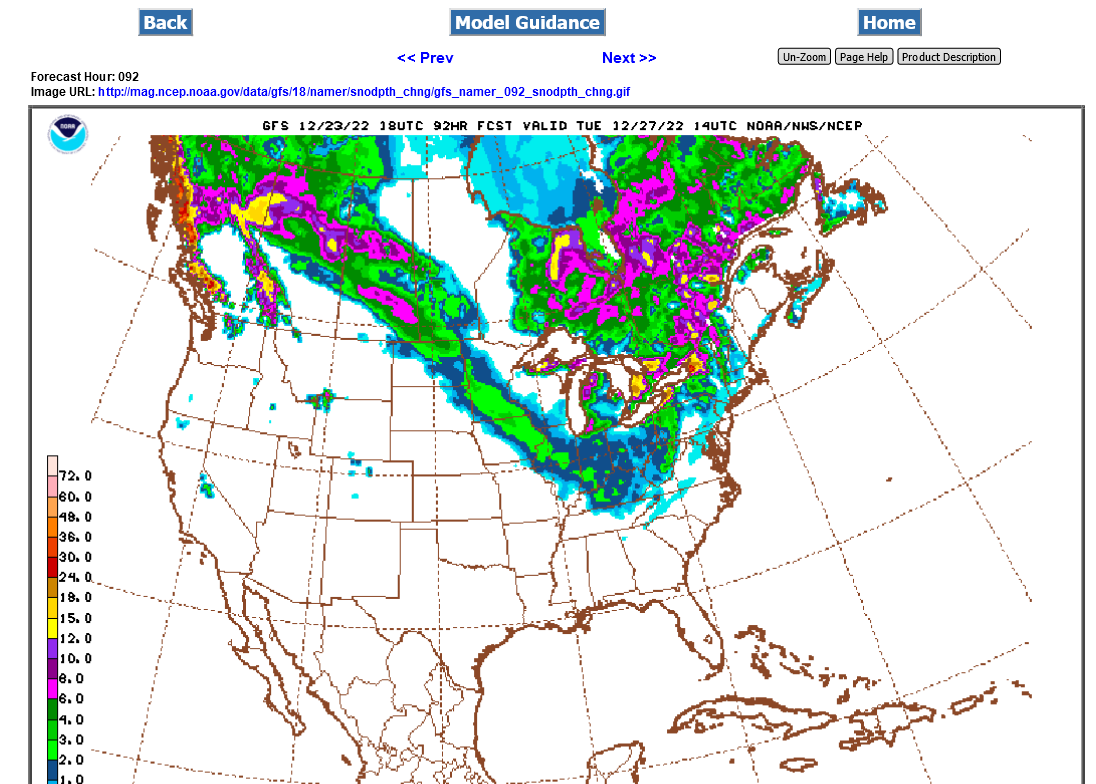
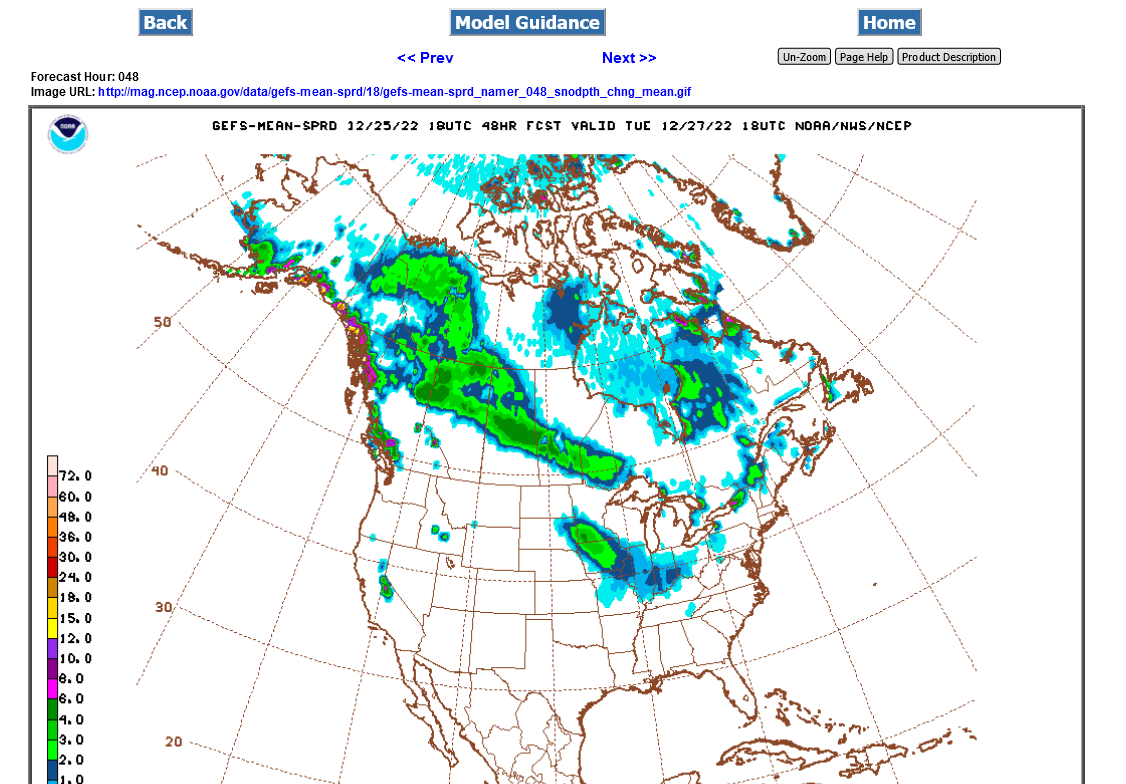
Total snow accumulation from the just updated 0z GFS:
Computer generated amount from the NWS. Quite a bit more generous than most sources with 2 inches total snow.
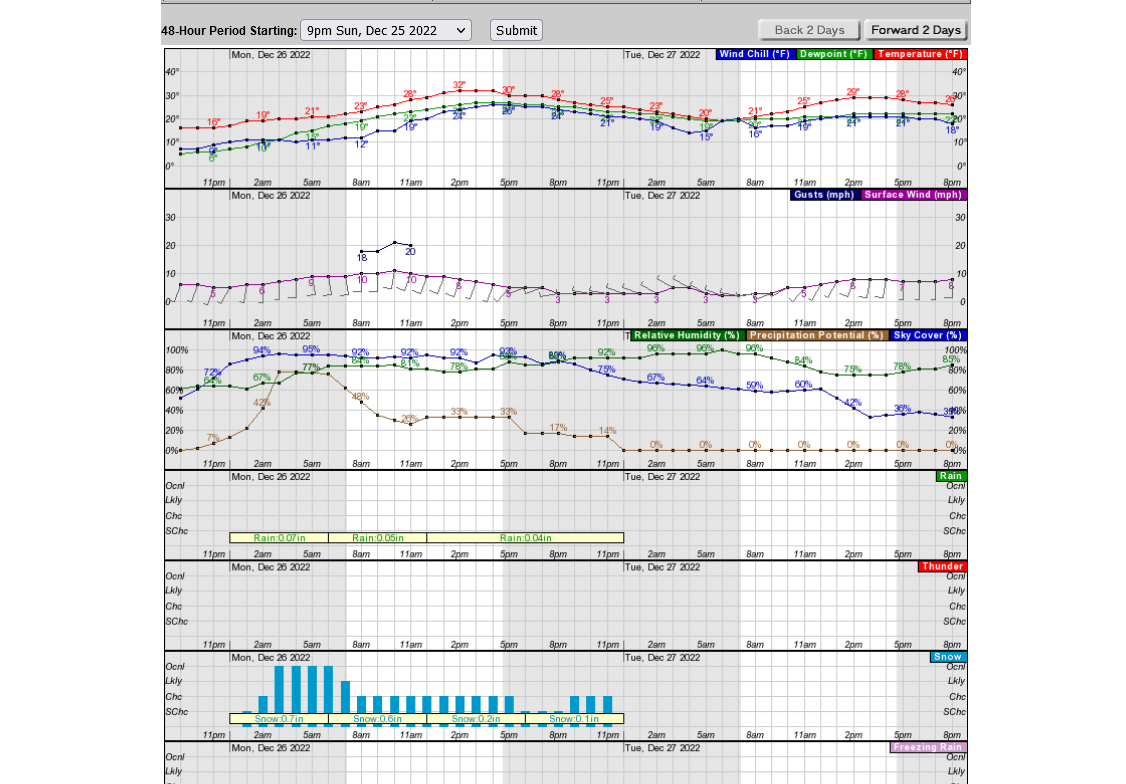
Last 18z GFS model run:
Latest NWS info for Evansville. Maybe an inch of snow. Very light!
Current Hazards at the link below.
Go to the link below, hit hazards box in the top right hand corner(it will also define all the color codes), if its not already in the hazards mode when you load the link.
Then you can hit any spot on the map, including where you live and it will go to that NWS with all the comprehensive local weather information for that/your county.

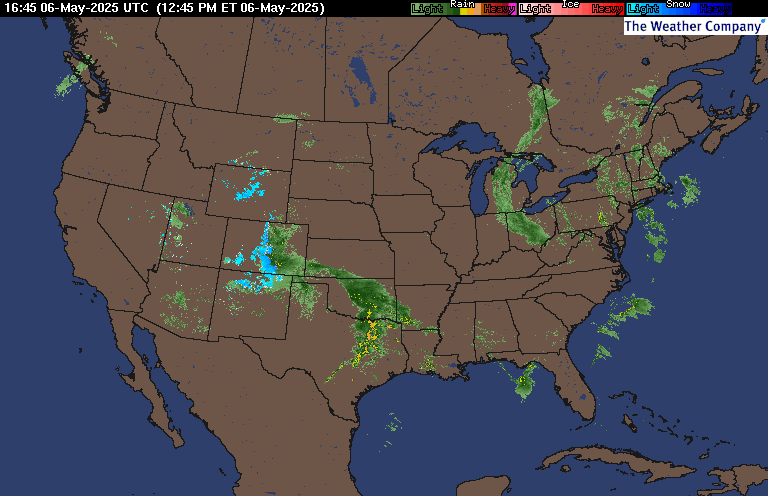
Latest National radar images
https://www.wunderground.com/maps/radar/current
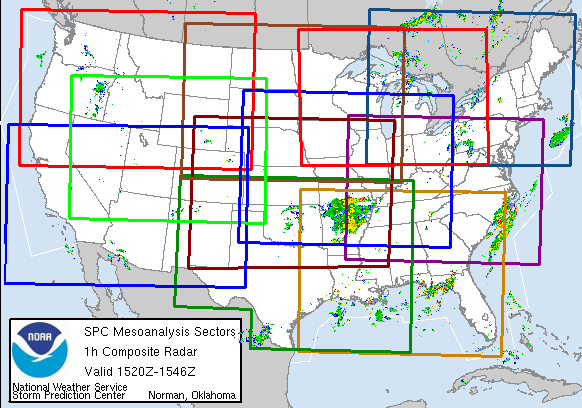
This link below provides some great data. After going to the link, hit "Mesoanalysis" then, the center of any box for the area that you want, then go to observation on the far left, then surface observations to get constantly updated surface observations or hit another of the dozens of choices.
 |
Current Conditions below updated every few minutes.
LOWER MIDWEST
https://www.spc.noaa.gov/exper/mesoanalysis/new/viewsector.php?sector=20

https://www.spc.noaa.gov/exper/mesoanalysis/new/viewsector.php?sector=20#

https://www.spc.noaa.gov/exper/mesoanalysis/new/viewsector.php?sector=20# 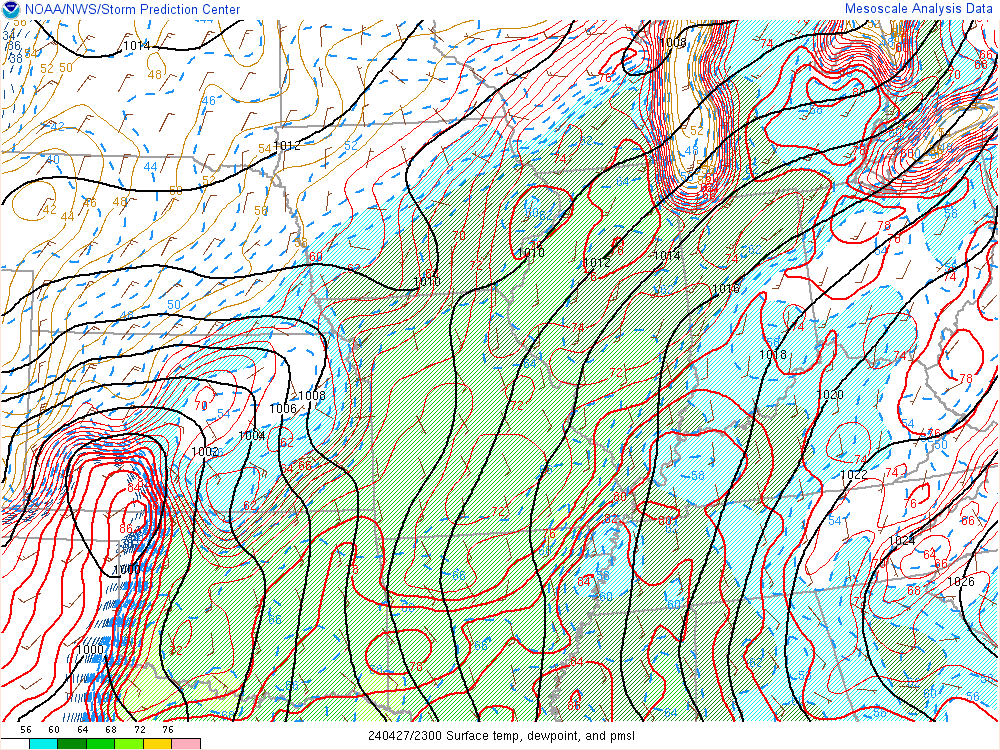
More comprehensive weather links:
We got a bit MORE than 2 inches here!
Hey Mike,
It is now snowing lightly to moderately in Atlanta and nearby areas from this clipper.
Thanks Larry(who lives in the Atlanta area),
We just got to Detroit.
The drive here went from over 2 inches in Evansville to quickly tapering to near nothing an hour later. Then an area with light snow then, then no snow. Then snow covered roads, then no snow.
It was like that the entire way.
Even a surprising hour of freezing drizzle.
How the heck did freezing rain happen with a well below freezing vertical temp profile for hundreds of miles south of there and a surface temp of 23 degrees???
I've never seen this. There had to be a small pocket of warmer air aloft for some reason that was unseen by the observations/models.
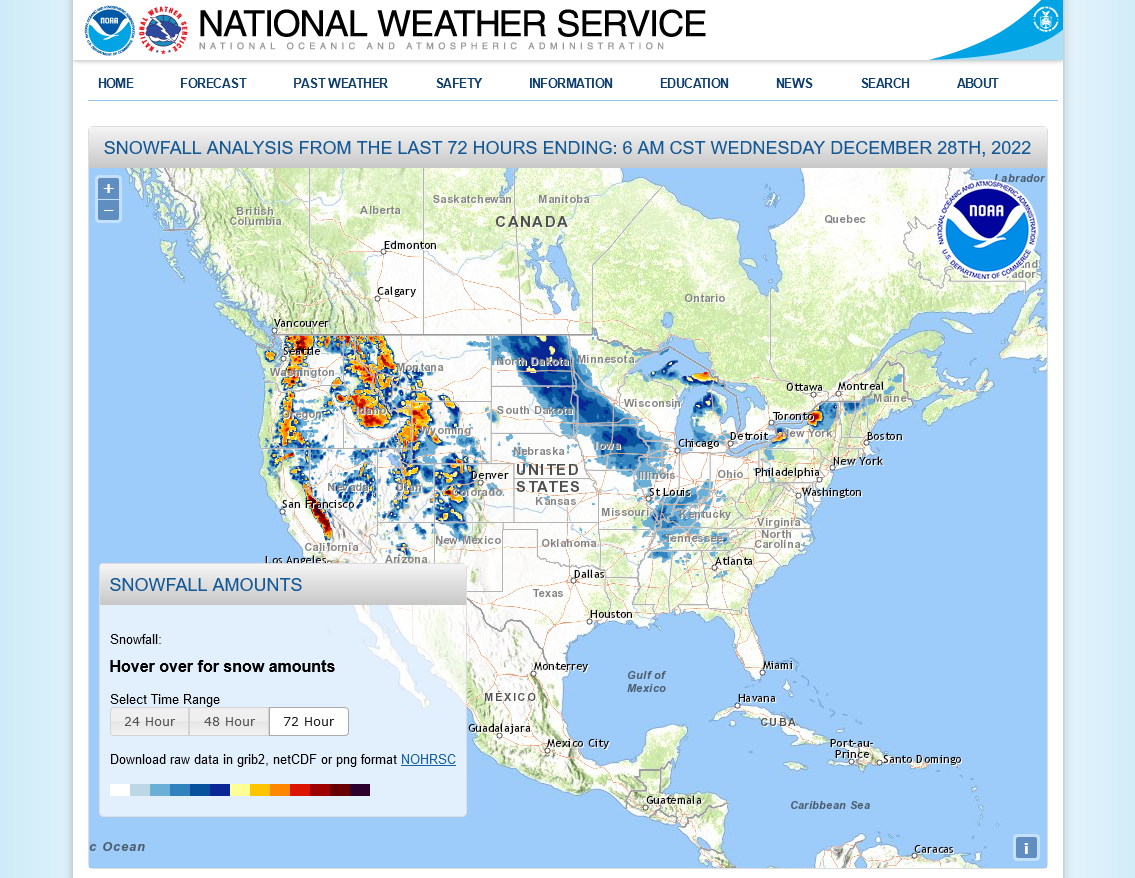
Here's a new site that I found which shows snow totals for the nation going back as long as 72 hours. You can see the tiny area of 2+ inches in SW Indiana. Hover over the area with your mouse to get it.
https://www.weather.gov/crh/snowfall
The NWS 3 miles south of us reported just .9 inches of snow for the event. That seems too light. Snow depth at the time was 1 inch, including the snow from the earlier event. No way. They must be using automated instruments(its an automated station) that don't properly capture/measure snow metrics.