KEY EVENTS TO WATCH FOR:
Friday, December 30, 2022
8:30 AM ET. U.S. Weekly Export Sales
9:45 AM ET. December Chicago Business Barometer - ISM-Chicago Business Survey -
Chicago PMI PMI-Adj (expected 40.5; previous 37.2)
3:00 PM ET. November Agricultural Prices
Farm Prices, M/M% (previous -2.7%)
Monday, January 2, 2023
N/A U.S.: New Year's Day holiday observed. Financial markets closed
The STOCK INDEXES? http://quotes.ino.com/ex?changes/?c=indexes
The Dow closed sharply higher on Thursday as it extends the trading range of the past two-weeks. The high-range close sets the stage for a steady to higher opening when Friday's day session begins trading. Stochastics and the RSI are neutral signaling that sideways trading is possible near-term. Closes below last-Thursday's low 32,573.43 would mark a resumption of the decline off December's high while opening the door for a possible test of November's low crossing at 31,727.05. Closes above the 20-day moving average crossing at 33,500.30 would signal that a short-term low has been posted. First resistance is the 20-day moving average crossing at 33,500.30. Second resistance is December's high crossing at 34,712.28. First support is last-Thursday's low crossing at 32,573.43. Second support is November's low crossing at 31,727.050.
The March NASDAQ 100 closed sharply higher on Thursday as it consolidates some of the decline off December's high. The high-range close sets the stage for a steady to higher opening when Friday's day session begins trading. Stochastics and the RSI are oversold but remain neutral to bearish signaling sideways to lower prices are possible. If March extends the aforementioned decline, November's low crossing at 10,746.75 is the next downside target. Closes above the 50-day moving average crossing at 11,544.67 would signal that a short-term low has been posted. First resistance is the 10-day moving average crossing at 11,135.27. Second resistance is the 50-day moving average crossing at 11,544.67. First support is November's low crossing at 10,746.75. Second support is October's low crossing at 10,595.25.
The March S&P 500 closed higher on Thursday as it extends the trading range of the past two-weeks. The high-range close sets the stage for a steady to higher opening when Friday's day session begins trading. Stochastics and the RSI are oversold but remain neutral to bearish signaling that sideways to lower prices are possible near-term. If March extends the aforementioned decline, November's low crossing at 3735.00 is the next downside target. Closes above the 20-day moving average crossing at 3947.20 would confirm that a short-term low has been posted. First resistance is the 50-day moving average crossing at 3932.28. Second resistance is the 20-day moving average crossing at 3947.20. First support is the November 9th low crossing at 3782.75. Second support is November's low crossing at 3735.00.
INTEREST RATES? http://quotes.ino.com/ex?changes/?c=interest ""
March T-bonds closed up 20-pts. at 125-17.
March T-bonds closed higher on Thursday as it consolidates some of the decline off December's high.The high-range close sets the stage for a steady to higher opening when Friday's day session begins trading. Stochastics and the RSI are oversold but remain neutral to bearish signaling that sideways to lower prices are possible near-term. If March extends the decline off last-Thursday's high, the 62% retracement level of the October-December rally crossing at 123-06 is the next downside target. Closes above the 20-day moving average crossing at 129-06 would signal that a short-term low has been posted. First resistance is the 20-day moving average crossing at 129-06. Second resistance is December's high crossing at 132-15. First support is the 50% retracement level of the October-December rally crossing at 124-31. Second support is the 62% retracement level of the October-December rally crossing at 123-06.
March T-notes closed up 90-pts. at 112.150.
March T-notes closed higher on Thursday as it consolidates some of the decline off December's high. The mid-range close sets the stage for a steady to higher opening when Friday's day session begins trading. Stochastics and the RSI are oversold but remain neutral to bearish signaling that sideways to lower prices are possible near-term. If March extends the decline off December's high, the 62% retracement level of the October-December rally crossing at 111.174 is the next downside target. Closes above the 20-day moving average crossing at 113.304 would signal that a short-term low has been posted. First resistance is the 10-day moving average crossing at 113.144. Second resistance is the 20-day moving average crossing at 113.304. First support is Wednesday's low crossing at 112.040. Second support is the 62% retracement level of the October-December rally crossing at 111.174.
ENERGY MARKETS? http://quotes.ino.com/ex?changes/?c=energy ""
February crude oil closed lower on Thursday as it consolidates some of the rally off December's low. The high-range close sets the stage for a steady to slightly lower opening when Friday's day session begins. Stochastics and the RSI are overbought but remain neutral to bullish signaling that sideways to higher prices are possible near-term. If February extends the aforementioned rally, December's high crossing at $83.27 is the next upside target. Closes below the 20-day moving average crossing at $76.41 would signal that a short-term top has been posted. First resistance is the 50-day moving average crossing at $80.60. Second resistance is December's high crossing at $83.27. First support is the December 16th low crossing at $73.40. Second support is the December 9thlow crossing at $70.31.
February heating oil closed lower on Thursday as it consolidates some of the rally off December's low but remains above the 50-day moving average crossing at $3.2398. The high-range close sets the stage for a steady to slightly lower opening when Friday's day trading session begins. Stochastics and the RSI are overbought but remain neutral to bullish signaling that sideways to higher prices are possible near-term. If February extends the rally off the December 9th low, the November 15th high crossing at $3.4722 is the next upside target. Closes below the 20-day moving average crossing at $3.0732 would confirm that a short-term top has been posted. First resistance is Tuesday's high crossing at $3.3543. Second resistance is the November 15th high crossing at $3.4722. First support is the 20-day moving average crossing at $3.0732. Second support is the December 20th low crossing at $3.9682.
February unleaded gas closed slightly higher on Thursday as it consolidates above the 50-day moving average crossing at $2.3553. The high-range close sets the stage for a steady to higher opening when Friday's day session begins trading. Stochastics and the RSI are overbought but remain neutral to bullish signaling that sideways to higher prices are possible near-term. If February extends this month's rally, the November 14th high crossing at $2.5783 is the next upside target. Closes below the 20-day moving average crossing at 2.2265 would signal that a short-term top has been posted. First resistance is Tuesday's high crossing at $2.4241. Second resistance is the November 14th high crossing at $2.5783. First support is the 20-day moving average crossing at $2.2265. Second support is the December 16th low crossing at 2.1157.
February Henry natural gas closed lower on Thursday as it extends the decline off November's high. The mid-range close sets the stage for a steady to lower opening when Friday's day session begins trading. Stochastics and the RSI are oversold but remain neutral to bearish signaling that sideways to lower prices are possible near-term. If February extends the aforementioned decline, the 75% retracement level of the 2020-2022 rally crossing at 4.332 is the next downside target. Closes above the 20-day moving average crossing at 5.696 would signal that a short-term low has been posted. First resistance is the 10-day moving average crossing at 5.336. Second resistance is the 20-day moving average crossing at 5.696. First support is today's low crossing at 4.422. Second support is the 75% retracement level of the 2020-2022 rally crossing at 4.332.
CURRENCIES? http://quotes.ino.com/ex?changes/?c=currencies ""
The March Dollar closed lower on Thursday as it extends the trading range of the past three-weeks. The low-range close sets the stage for a steady to lower opening when Friday's day session begins trading. Stochastics and the RSI are neutral to bullish signaling that sideways to higher prices are possible near-term. Closes above the December 7th high crossing at $105.445 would signal that a short-term low has been posted. If March renews the decline off September's high, the 75% retracement level of the January-September rally crossing at $101.331 is the next downside target. First resistance is the December 7th high crossing at $105.445. Second resistance is the November 30thhigh crossing at $106.775. First support is the December 15th low crossing at $102.875. Second support is 75% retracement level of the January-September rally crossing at $101.331.
The March Euro closed higher on Thursday as it extends the extends the trading range of the past three-weeks. The high-range close sets the stage for a steady to higher opening when Friday's day session begins trading. Stochastics and the RSI are turning neutral to bullish signaling that sideways to higher prices are possible near-term. If March resumes the rally off September's low, the March 31st high crossing at $1.09680 is the next upside target. Closes below last-Thursday's low crossing at 1.06340 would signal that a short-term top has been posted. First resistance is the 25% retracement level of the 2018-2022 decline crossing at $1.07982. Second resistance is the March 31st high crossing at $1.09680. First support is last-Thursday's low crossing at $1.06340. Second support is the December 7th low crossing at $1.05210.
The March British Pound posted an inside day with a slightly higher close on Thursday. The mid-range close sets the stage for a steady to higher opening when Friday's day session begins trading. Stochastics and the RSI are oversold but remain neutral to bearish signaling sideways to lower prices are possible near-term. If March extends the decline off December's high, the 50-day moving average crossing at 1.1894 is the next downside target. Closes above the 20-day moving average crossing at 1.2208 would signal that a short-term low has been posted. If March renews the rally off September's low, the 62% retracement level of the May-September decline crossing at 1.2770 is the next upside target. First resistance is December's high crossing at 1.2479. Second resistance is the 62% retracement level of the May-September decline crossing at 1.2770. First support is the November 30th low crossing at 1.1937. Second support is the 50-day moving average crossing at 1.1894.
The March Swiss Franc closed higher on Thursday. The high-range close sets the stage for a steady to higher opening when Friday's day session begins trading. Stochastics and the RSI have turned neutral to bullish signaling that sideways to higher prices are possible near-term. If March renews the rally off September's low, the 62% retracement level of the 2018-2022 decline crossing at 1.10351 is the next upside target. Closes below last-Friday's low crossing at 1.07930 would signal that a short-term top has been posted. First resistance is December's high crossing at 1.09665. Second resistance is the 62% retracement level of the 2018-2022 decline crossing at 1.10351. First support is last-Friday's low crossing at 1.07930. Second support is the November 30th low crossing at 1.06060.
The March Canadian Dollar closed higher on Thursday as it extends the trading range of the past four-weeks. The high-range close sets the stage for a steady to higher opening when Friday's day session begins trading. Stochastics and the RSI are neutral to bullish signaling that sideways to higher prices are possible near-term. Closes above the December 12th crossing at 74.06 would confirm that a short-term low has been posted while opening the door for additional short-term gains. If March renews the decline off November's high, the November 3rd low crossing at 72.58 is the next downside target. First resistance is the December 5th high crossing at 74.82. Second resistance is the November 25thhigh crossing at 75.16. First support is the December 16th low crossing at 73.04. Second support is the November 3rd low crossing at 72.58.
The March Japanese Yen closed higher on Thursday following a five-day decline. The high-range close sets the stage for a steady to higher opening when Friday’s day session begins trading. Stochastics and the RSI are neutral to bearish signaling that sideways to lower prices are possible near-term. Closes below the 20-day moving average crossing at 0.074905 would confirm that a short-term top has been posted. If March renews the rally off October's low, August's high crossing at 0.078135 is the next upside target. First resistance is last-Tuesday's high crossing at 0.077470. Second resistance is August's high crossing at 0.078135. First support is the 20-day moving average crossing at 0.074905. Second support is the December 15th crossing at 0.073210.
PRECIOUS METALS? http://quotes.ino.com/ex?changes/?c=metals ""
February gold closed higher on Thursday as it extends this month's trading range. The high-range close sets the stage for a steady to higher opening when Friday's day session begins trading. Stochastics and the RSI are neutral to bullish signaling that sideways to higher prices are possible near-term. If February extends the rally off November's low, the 50% retracement level of the March-October decline crossing at $1861.40 is the next upside target. Closes below the 20-day moving average crossing at $1806.60 would signal that a short-term top has been posted while opening the door for additional weakness near-term. First resistance is Tuesday's high crossing at $1841.90. Second resistance is the 50% retracement level of the March-October decline crossing at $1861.40. First support is the 20-day moving average crossing at $1806.60. Second support is the December 15th low crossing at $1782.00.
March silver posted an inside day with a higher close on Thursday as it extended the trading range of the past two-weeks. The high-range close sets the stage for a steady to higher opening when Friday's day session begins trading. Stochastics and the RSI are neutral signaling that sideways trading is possible near-term. Closes below the 20-day moving average crossing at 23.515 would signal that a short-term top has been posted while opening the door for additional weakness near-term. If March extends the rally off October's low, the 75% retracement level of the March-August decline crossing at 24.779 is the next upside target. First resistance is last-Wednesday's high crossing at 24.525. Second resistance is the 75% retracement level of the March-September decline crossing at 24.779. First support is the 20-day moving average crossing at 23.515. Second support is the December 16th low crossing at 22.735.
March copper closed slightly lower on Thursday. The mid-range close sets the stage for a steady to lower opening when Friday's day session begins trading. Stochastics and the RSI have turned neutral to bullish signaling that sideways to higher prices are possible near-term. If March renews the rally off September's low, the 50% retracement level of the March-July decline crossing at 4.0343 is the next upside target. Closes below last-Tuesday's low crossing at 3.7230 would confirm that a short-term top has been posted. First resistance is November's high crossing at 3.9470. Second resistance is the 50% retracement level of the March-July decline crossing at 4.0343. First support is last-Tuesday's low crossing at 3.7230. Second support is the 50-day moving average crossing at 3.6800.
GRAINS? http://quotes.ino.com/ex?changes/?c=grains "
March Corn closed down $0.03 1/4-cents at $6.79 1/2.
March corn posted an inside day with a lower close on Thursday. The mid-range close sets the stage for a steady to lower opening when Friday's day session begins trading. Stochastics and the RSI are overbought but remain neutral to bullish signaling that sideways to higher prices are possible near-term. If March extends the rally off December's low, October's downtrend line crossing near $6.85 1/2 is the next upside target. Closes below the 10-day moving average crossing at $6.63 would signal that a short-term top has been posted. First resistance is Wednesday's high crossing at $6.83 1/2. Second resistance is October's downtrend line crossing near $6.85 1/2. First support is the 50-day moving average crossing at $6.68 1/2. Second support is the 10-day moving average crossing at $6.63.
March wheat closed down $0.11 1/2-cents at $7.74.
March wheat closed lower on Thursday on expectations of a big wheat crop out of Russia. The mid-range close sets the stage for a steady to lower opening when Friday's day session begins trading. Stochastics and the RSI are overbought but remain neutral to bullish signaling that sideways to higher prices are possible near-term. If March extends this month's rally, the 50-day moving average crossing at $8.08 is the next upside target. Closes below the 20-day moving average crossing at $7.57 1/4 would signal that a short-term top has been posted. First resistance is Wednesday's high crossing at $7.87 1/2. Second resistance is the 50-day moving average crossing at $8.08. First support is the 20-day moving average crossing at $7.57 1/4. Second support is the 75% retracement level of the 2018-2022 rally crossing at $7.24 1/4.
March Kansas City Wheat closed down $0.15 3/4-cents at $8.66 1/2.
March Kansas City wheat closed lower on Thursday. The low-range close sets the stage for a steady to lower opening when Friday's day session begins trading. Stochastics and the RSI are turning neutral to bearish signaling that sideways to lower prices are possible near-term. If March renews the decline off October's high, August's low crossing at $8.18 3/4 is the next downside target. If March extends this month's rally, the 50-day moving average crossing at $9.03 3/4. First resistance is Tuesday's high crossing at $8.94 3/4. Second resistance is the 50-day moving average crossing at $9.03 3/4. First support is the 19th low crossing at $8.30 3/4. Second support is the December 6th low crossing at $8.21 3/4.
March Minneapolis wheat closed down $0.20-cents at $9.14.
March Minneapolis wheat closed sharply lower on Thursday and below the 20-day moving average crossing at $9.17 signaling that sideways to lower prices are possible near-term. The low-range close sets the stage for a steady to lower opening when Friday's day session begins trading. Stochastics and the RSI are overbought and are turning neutral to bearish signaling that sideways to lower prices are possible near-term. If March renews the decline off November's high, August's low crossing at $8.75 3/4 is the next downside target. Closes above the 50-day moving average crossing at $9.43 1/4 would open the door for additional short-term gains. First resistance is the 50-day moving average crossing at $9.43 1/4. Second resistance is the November 15th high crossing at $9.91 1/4. First support is last-Monday's low crossing at $9.00 3/4. Second support is the December 6th low crossing at $8.90.
SOYBEAN COMPLEX? http://quotes.ino.com/ex?changes/?c=grains "
March soybeans closed up $0.02-cents at $15.16 1/4.
March soybeans closed higher on Thursday as it extends the rally off October's low. The mid-range close sets the stage for a steady to higher opening when Friday's day trade begins. Stochastics and the RSI have turned neutral to bullish signaling that sideways to higher prices are possible near-term. If March extends the rally off October's low, the 87% retracement level of the June-July decline crossing at $15.37 1/2 is the next upside target. Closes below last-Tuesday's low crossing at $14.62 1/4 would signal that a short-term top has been posted.First resistance is today's high crossing at $15.24 1/4. Second resistance is the 87% retracement level of the June-July decline crossing at $15.37 1/2. First support is last-Tuesday's low crossing at $14.62 1/4. Second support is the 50-day moving average crossing at $14.52 1/2.
March soybean meal closed down $2.80 at $458.50.
March soybean meal posted an inside day with a lower close on Thursday as it extends this month's trading range. The low-range close sets the stage for a steady to lower opening when Friday's day session begins trading. Stochastics and the RSI have turned neutral to bullish signaling that sideways to higher prices are possible near-term. If March renews the rally off October's low, monthly resistance on the continuation chart crossing at $478.60 is the next upside target. Closes below the December 19th low crossing at $443.40 would confirm a downside breakout of the aforementioned trading range. First resistance is the December 9th high crossing at $469.30. Second resistance is monthly resistance crossing at $478.60. First support is the December 19th low crossing at $443.40. Second support is the 38% retracement level of the 2021-2022 rally crossing at $433.00.
March soybean oil closed up 139-pts. At 66.36.
March soybean oil posted an inside day with a higher close on Thursday. The high-range close sets the stage for a steady to higher opening when Friday's day session begins trading. Stochastics and the RSI are overbought but remain neutral to bullish signaling that sideways to higher prices are possible near-term. Closes above the 50-day moving average crossing at 67.03 would open the door for additional gains near-term. Closes below the 20-day moving average crossing at 63.31 would signal that a short-term top has been posted. First resistance is the 50-day moving average crossing at 67.03. Second resistance is the November 29th high crossing at 72.49. First support is last-Thursday's low crossing at 63.50. Second support is the December 16th crossing at 61.47.
LIVESTOCKhttp://quotes.ino.com/exchanges/?c=livestock
February hogs closed down $2.03 at $88.78.
February hogs closed lower on Thursday as it consolidates some of the rally off December's low. The low-range close sets the stage for a steady to lower opening when Friday's day session begins trading. Stochastics and the RSI are overbought but remain neutral to bullish signaling that sideways to higher prices are possible near-term. If February extends this month's rally, December's high crossing at $91.90 is the next upside target. Closes below the 20-day moving average crossing at $86.89 would signal that a short-term top has been posted. First resistance is Tuesday's high crossing at $91.60 Second resistance is December's high crossing at $91.90. First support is the 20-day moving average crossing at $86.89. Second support is last-Wednesday's low crossing at $83.90.
February cattle closed up $0.83 at $158.63.
February cattle closed higher on Thursday as it extends the rally off December's low. The high-range close sets the stage for a steady to higher opening on Friday. Stochastics and the RSI are overbought but remain neutral to bullish signaling that sideways to higher prices are possible near-term. If February extends this month's rally, the 87% retracement level of the monthly continuation chart crossing at $159.54 is the next upside target. Closes below the 20-day moving average crossing at $156.06 would signal that a short-term top has been posted. First resistance is today's high crossing at $159.18. Second resistance is the 87% retracement level of the monthly continuation chart crossing at $159.54. First support is the 10-day moving average crossing at $156.93. Second support is the 20-day moving average crossing at $156.06.
March Feeder cattle closed up $0.58 at $186.78.
March Feeder cattle closed higher on Thursday. The high-range close sets the stage for a steady to higher opening when Friday's day session begins trading. Stochastics and the RSI are neutral to bullish signaling that sideways to higher prices are possible near-term. If March extends the rally off the September 20th high crossing at $188.23 is the next upside target. Closes below the 20-day moving average crossing at $185.27 would signal that a short-term top has been posted while opening the door for additional weakness near-term. First resistance is today's high crossing at $187.30. Second resistance is the 75% retracement level of the August-October decline crossing at $188.29. First support is the 20-day moving average crossing at $185.27. Second support is the 50-day moving average crossing at $183.41.
FOOD & FIBERhttp://quotes.ino.com/ex changes/?c=food
March coffee posted an inside day with a lower close on Thursday. The low-range close sets the stage for a steady to lower opening on Friday. Stochastics and the RSI are turning neutral to bearish signaling sideways to lower prices are possible near-term. If March renews the decline off August's high, November's low crossing at $15.41 is the next downside target. Closes above the December 16th high crossing at $17.38 would open the door for additional gains near-term. First resistance is the December 16th high crossing at $17.38. Second resistance is November's high crossing at $17.82. First support is November's low crossing at $15.41. Second support is the 75% retracement level of the 2020-2022 rally crossing at $14.74.
March cocoa closed lower on Thursday following yesterday's key reversal down. The low-range close sets the stage for a steady to lower opening on Friday. Stochastics and the RSI are turning neutral to bearish signaling sideways to lower prices are possible near-term. Closes below the 20-day moving average crossing at 25.35 would signal that a short-term top has been posted while opening the door for additional weakness near-term. If March extends the rally off September low, the March-2022 high on the weekly continuation chart crossing at 27.10 is the next upside target.
March sugar posted an inside day with a higher close on Thursday. The mid-range close sets the stage for a steady to higher opening on Friday. Stochastics and the RSI have turned neutral to bearish signaling that sideways to lower prices are possible near-term. Closes below the 20-day moving average crossing at 20.02 would signal that a short-term top has been posted. If March resumes the rally off September's low, weekly resistance on the weekly continuation chart crossing at 26.46 is the next upside target.
March cotton closed lower on Thursday. The low-range close sets the stage for a steady to lower opening on Friday. Stochastics and the RSI are neutral to bearish signaling that sideways to lower prices are possible near-term. Closes below the 50-day moving average crossing at 81.86 would signal that a short-term top has been posted. If March extends the rally off October's low, the 50% retracement level of the August-October decline crossing at 93.31 is the next upside target.
Thanks tallpine!
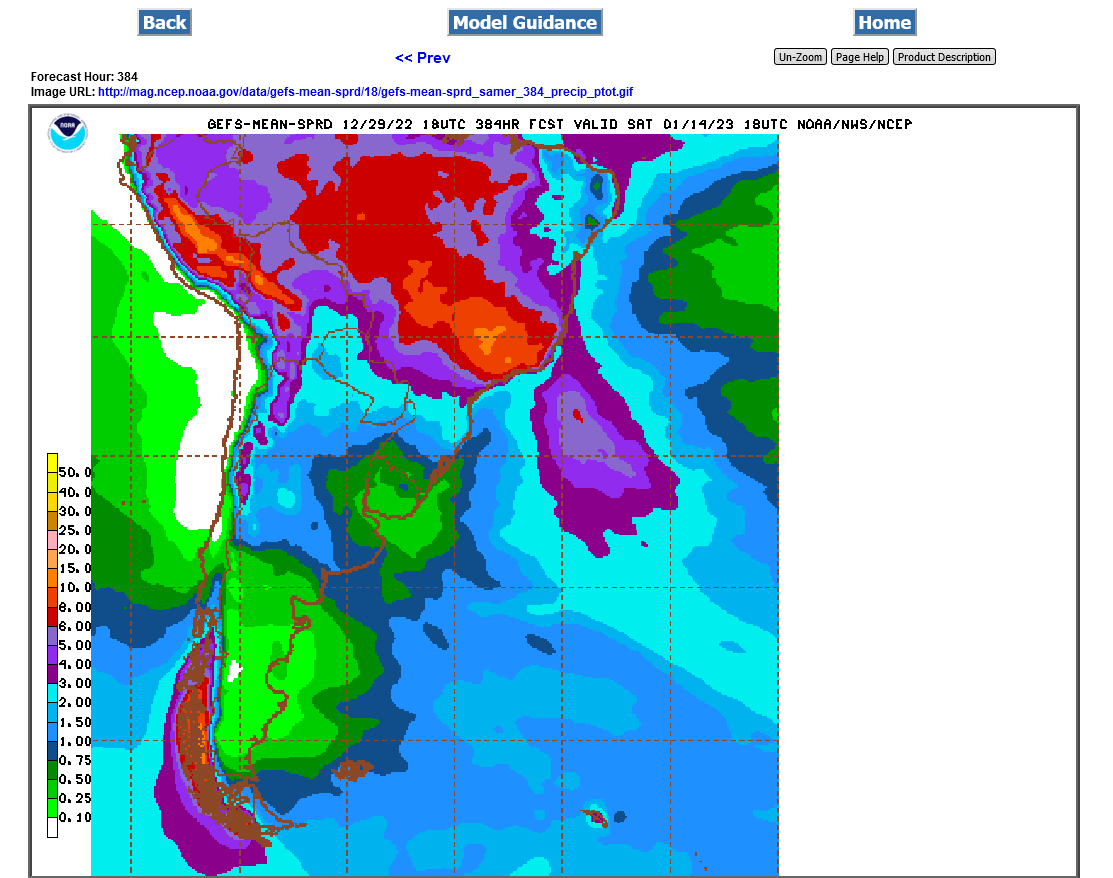
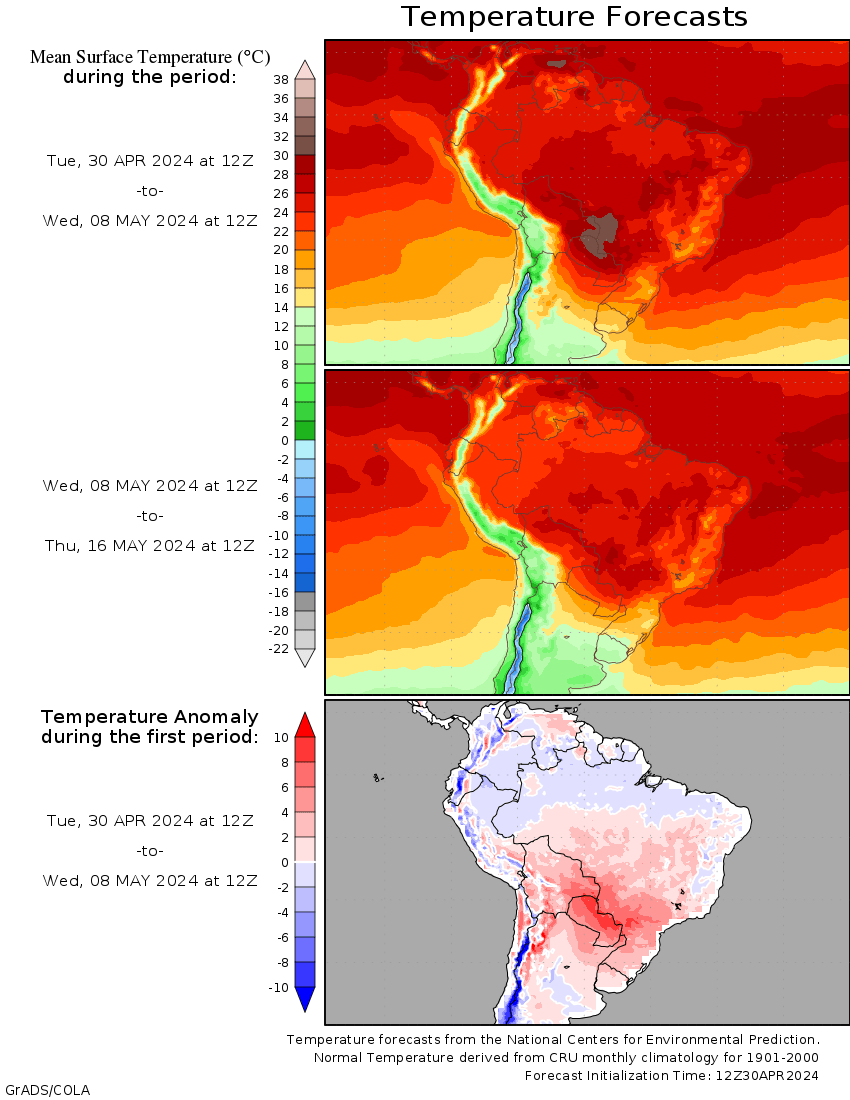
Hot and dry in Argentina is very bullish beans
2 week rains below from the 18z GEFS.
+++++++++++++++++++++++
La Nina's take many months to gradually end and this one will start doing that AFTER the growing season has already ended in Argentina.
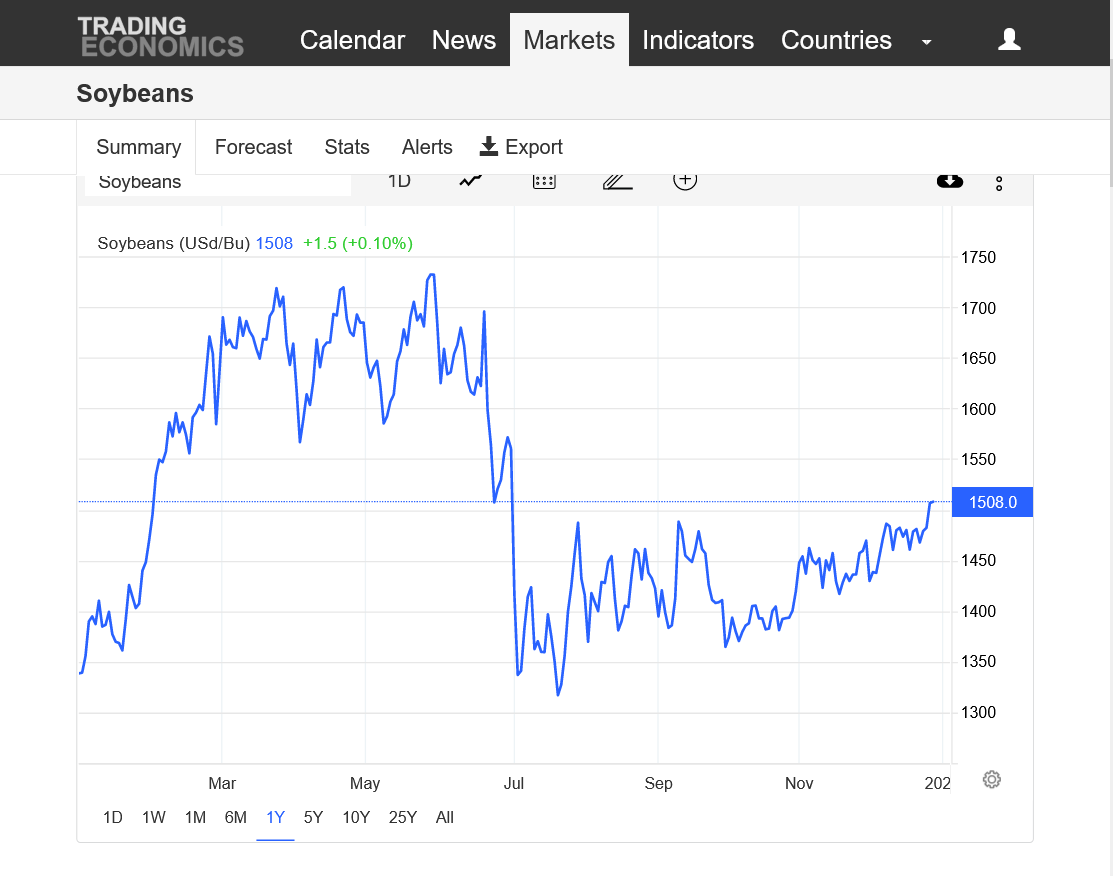
Beans breaking out to the upside from the drought continuing in key global producer, Argentina.
2 week rains below from the 6z GEFS.
Brazil weather is outstanding except for the extreme south.
Drought on 30-90 day maps and soybean growing areas of south America:
https://www.marketforum.com/forum/topic/91772/#91776
Heat building back in for Argentina and remaining
https://www.psl.noaa.gov/map/images/ens/t850anom_sh_alltimes.html
http://wxmaps.org/outlooks.php
Last 12z GEFS total precip for 384 hours(2+ weeks).
Southeast half of Argentina bean crop has extremely light rains with near record heat (from the current La Nina).
No place in that country has favorable weather.
Brazil has great weather except the far south is affected by the same feature hurting all of Argentina.
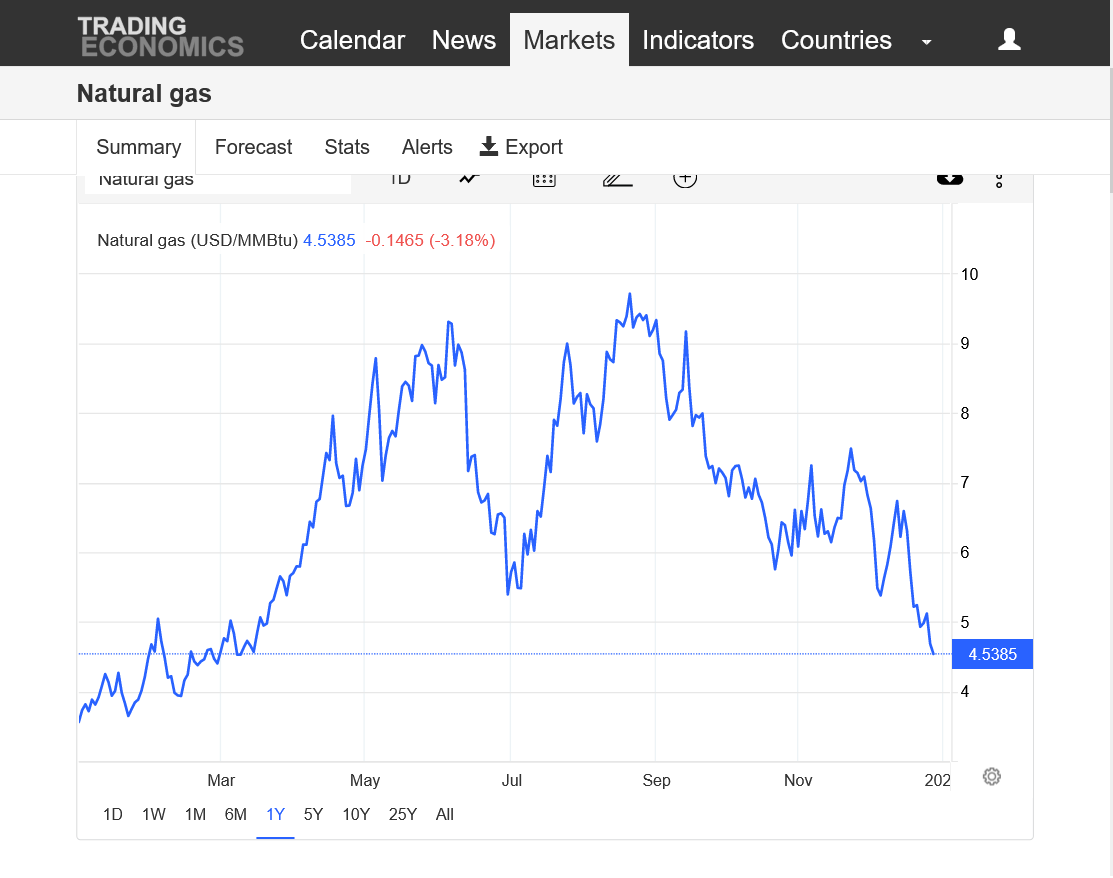
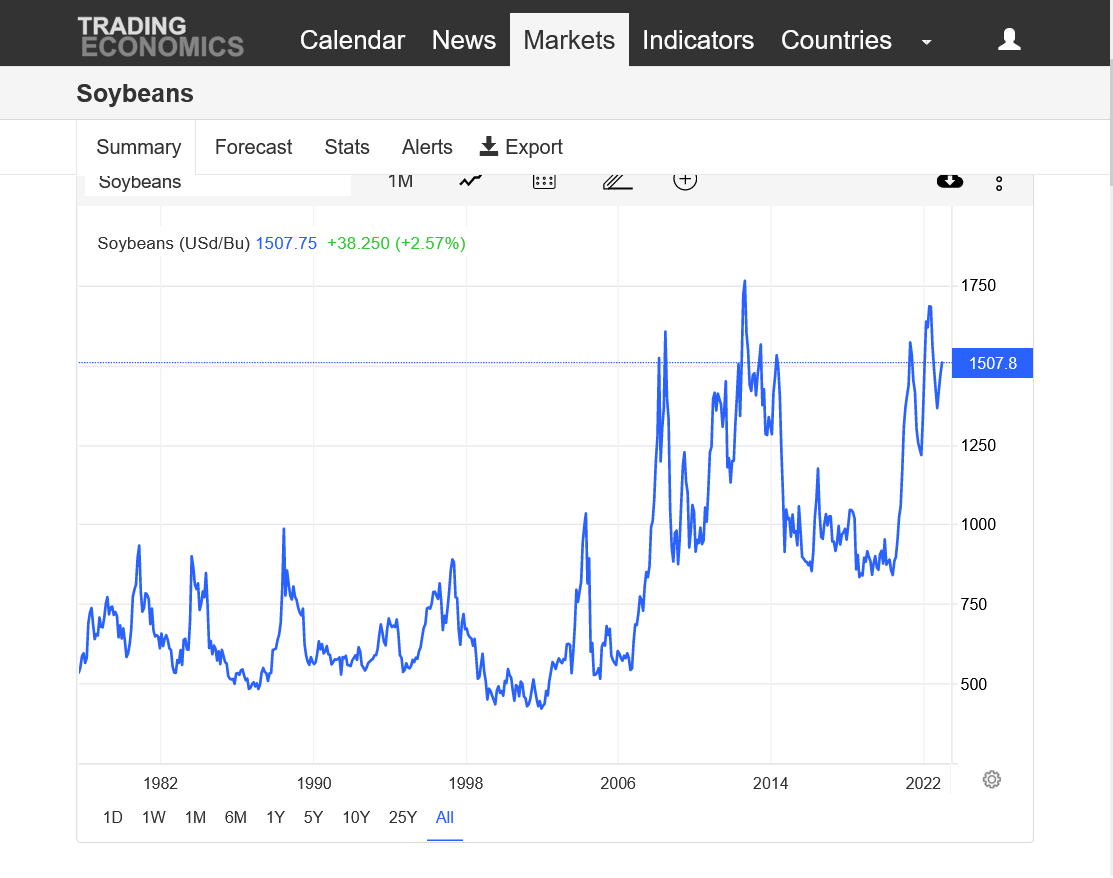
https://tradingeconomics.com/commodity/soybeans
1. 1 year
2. 45 years
Upside break out above resistance:
 !
!
Extremely bearish weather coming up for NG after a huge drawdown.
https://www.marketforum.com/forum/topic/83844/#83851
Highs for days 3-7:
https://www.wpc.ncep.noaa.gov/medr/medr_max.shtml


+++++++++++++++++++++++++++++++++++++++++++++++
Lows days 3-7 below:
https://www.wpc.ncep.noaa.gov/medr/medr_min.shtml
Extended weather.
https://www.cpc.ncep.noaa.gov/products/predictions/610day/ | |||||||||
| 6 to 10 day outlooks | |||||||||
| Click below for information about how to read 6-10 day outlook maps Temperature Precipitation | |||||||||
| Click below for archives of past outlooks (data & graphics), historical analogs to todays forecast, and other formats of the 6-10 day outlooks ArchivesAnalogsLines-Only FormatGIS Data | |||||||||
Temperature Probability | |||||||||
Precipitation Probability | |||||||||
In an eye-opening indication of the impact Winter Storm Elliott had on the natural gas market, the U.S. Energy Information Administration (EIA) on Thursday reported a stunning 213 Bcf withdrawal from storage for the week ending Dec. 23. The triple-digit draw was near the high end of most major surveys and pumped the brakes on…
+++++++++++++++++=
Weather forecast still mild, with no sign for below average temperatures the next 2 weeks.
Last weeks temps were pretty extreme and that continued into the early part of the EIA report for next week, so next weeks EIA will be on the high side(much lower).
Then we see a couple of tiny withdrawals vs average from the current mild spell.
4 consecutive 200+ withdrawals in Jan/Feb and late Winter withdrawals, dropped inventory to very low levels which continued until September of this year, when we had massive supplies gushing in (a record smashing 100+ BCF injections on 6 occasions)
These were the withdrawals last Winter:
| Release Date | Time | Actual | Forecast | Previous |
|---|
| Mar 31, 2022 | 09:30 | 26B | 21B | -51B | |
| Mar 24, 2022 | 09:30 | -51B | -56B | -79B | |
| Mar 17, 2022 | 09:30 | -79B | -73B | -124B | |
| Mar 10, 2022 | 10:30 | -124B | -117B | -139B | |
| Mar 03, 2022 | 10:30 | -139B | -138B | -129B | |
| Feb 24, 2022 | 10:30 | -129B | -134B | -190B | |
| Feb 17, 2022 | 10:30 | -190B | -193B | -222B | |
| Feb 10, 2022 | 10:30 | -222B | -222B | -268B | |
| Feb 03, 2022 | 10:30 | -268B | -216B | -219B | |
| Jan 27, 2022 | 10:30 | -219B | -216B | -206B | |
| Jan 20, 2022 | 10:30 | -206B | -194B | -179B | |
| Jan 13, 2022 | 10:30 | -179B | -173B | -31B | |
| Jan 06, 2022 | 10:30 | -31B | -54B | -136B | |
| Dec 30, 2021 | 10:30 | -136B | -125B | -55B | |
| Dec 23, 2021 | 10:30 | -55B | -56B | -88B |
| Dec 16, 2021 | 10:30 | -88B | -86B | -59B | |
| Dec 09, 2021 | 10:30 | -59B | -54B | -59B | |
| Dec 02, 2021 | 10:30 | -59B | -57B | -21B |
+++++++++++++++++++++++
| Nov 10, 2022 | 10:30 | 79B | 84B | 107B | |
| Nov 03, 2022 | 09:30 | 107B | 97B | 52B | |
| Oct 27, 2022 | 09:30 | 52B | 59B | 111B | |
| Oct 20, 2022 | 09:30 | 111B | 105B | 125B | |
| Oct 13, 2022 | 09:30 | 125B | 123B | 129B | |
| Oct 06, 2022 | 09:30 | 129B | 113B | 103B | |
| Sep 29, 2022 | 09:30 | 103B | 94B | 103B | |
| Sep 22, 2022 | 09:30 | 103B | 93B | 77B | |
| Sep 15, 2022 | 09:30 | 77B | 73B | 54B | |
| Sep 08, 2022 | 09:30 | 54B | 54B | 61B |
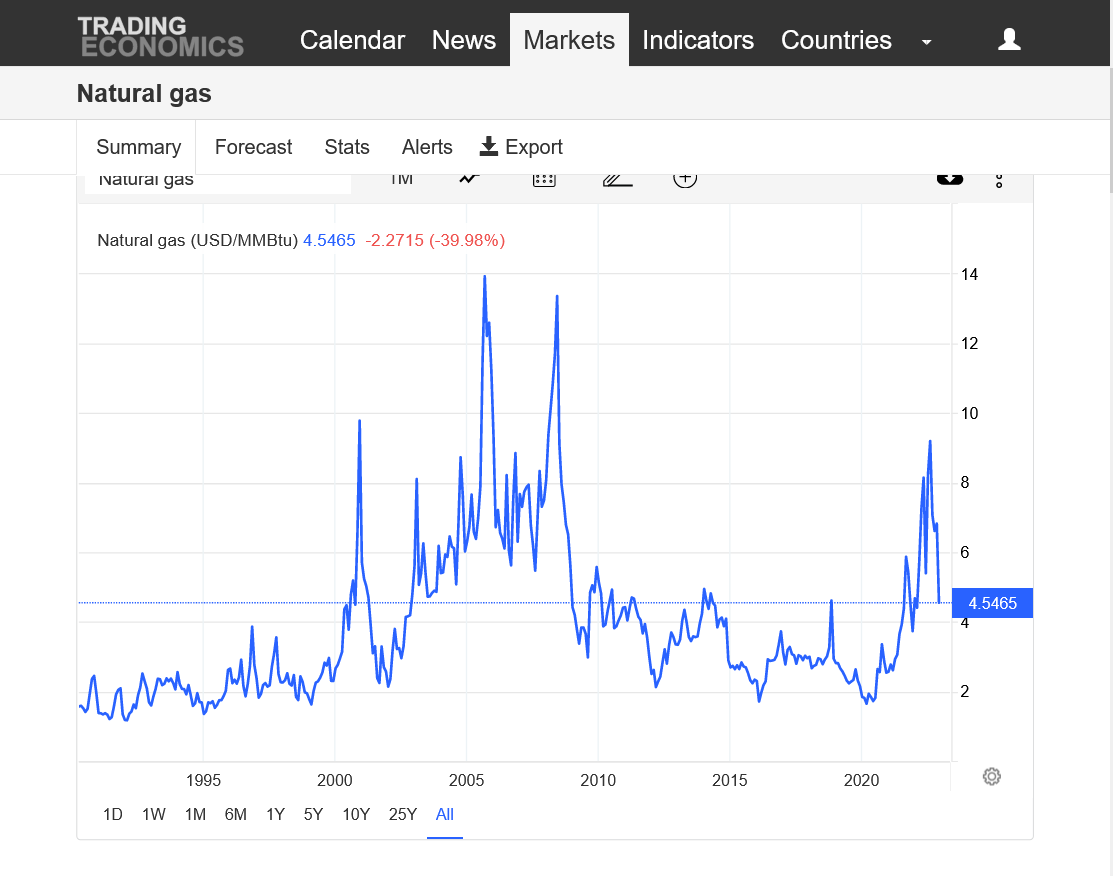
https://tradingeconomics.com/commodity/natural-gas
1. 1 year
2. 30 years
Downside break out below key support!