KEY EVENTS TO WATCH FOR:
Monday, January 2, 2023
N/A U.S.: New Year's Day holiday observed. Financial markets closed
The STOCK INDEXES? http://quotes.ino.com/ex?changes/?c=indexes
The Dow closed lower on Friday as it extends the trading range of the past two-weeks. The high-range close sets the stage for a steady to slightly lower opening when Tuesday's day session begins trading. Stochastics and the RSI are neutral signaling that sideways trading is possible near-term. Closes below last-Thursday's low 32,573.43 would mark a resumption of the decline off December's high while opening the door for a possible test of November's low crossing at 31,727.05. Closes above the 20-day moving average crossing at 33,500.30 would signal that a short-term low has been posted. First resistance is the 20-day moving average crossing at 33,423.01. Second resistance is December's high crossing at 34,712.28. First support is last-Thursday's low crossing at 32,573.43. Second support is November's low crossing at 31,727.050.
The March NASDAQ 100 closed lower on Friday. The high-range close sets the stage for a steady to slightly lower opening when Tuesday's day session begins trading. Stochastics and the RSI are oversold but remain neutral to bearish signaling sideways to lower prices are possible. If March extends the aforementioned decline, November's low crossing at 10,746.75 is the next downside target. Closes above the 50-day moving average crossing at 11,537.46 would signal that a short-term low has been posted. First resistance is the 10-day moving average crossing at 11,080.08. Second resistance is the 50-day moving average crossing at 11,537.46. First support is November's low crossing at 10,746.75. Second support is October's low crossing at 10,595.25.
The March S&P 500 closed lower on Friday as it extends the trading range of the past two-weeks. The high-range close sets the stage for a steady to slightly lower opening when Tuesday's day session begins trading. Stochastics and the RSI are oversold but remain neutral to bearish signaling that sideways to lower prices are possible near-term. If March extends the aforementioned decline, November's low crossing at 3735.00 is the next downside target. Closes above the 20-day moving average crossing at 3934.05 would confirm that a short-term low has been posted. First resistance is the 50-day moving average crossing at 3934.05. Second resistance is the 62% retracement level of the August-October crossing at 4045.36. First support is the November 9th low crossing at 3782.75. Second support is November's low crossing at 3735.00.
INTEREST RATES? http://quotes.ino.com/ex?changes/?c=interest ""
March T-bonds closed down 25-pts. at 124-23.
March T-bonds closed lower on Friday as it extends the decline off December's high.The low-range close sets the stage for a steady to lower opening when Tuesday's day session begins trading. Stochastics and the RSI are oversold but remain neutral to bearish signaling that sideways to lower prices are possible near-term. If March extends the decline off last-Thursday's high, the 62% retracement level of the October-December rally crossing at 123-06 is the next downside target. Closes above the 20-day moving average crossing at 128-30 would signal that a short-term low has been posted. First resistance is the 10-day moving average crossing at 127-10. Second resistance is the 20-day moving average crossing at 128-30. First support is the 50% retracement level of the October-December rally crossing at 124-31. Second support is the 62% retracement level of the October-December rally crossing at 123-06.
March T-notes closed down 90-pts. at 112.055.
March T-notes closed lower on Friday as it extends the decline off December's high. The low-range close sets the stage for a steady to lower opening when Tuesday's day session begins trading. Stochastics and the RSI are oversold but remain neutral to bearish signaling that sideways to lower prices are possible near-term. If March extends the decline off December's high, the 62% retracement level of the October-December rally crossing at 111.174 is the next downside target. Closes above the 20-day moving average crossing at 113.265 would signal that a short-term low has been posted. First resistance is the 10-day moving average crossing at 113.056. Second resistance is the 20-day moving average crossing at 113.265. First support is today's low crossing at 111.280. Second support is the 62% retracement level of the October-December rally crossing at 111.174.
ENERGY MARKETS? http://quotes.ino.com/ex?changes/?c=energy ""
February crude oil closed higher on Friday as it renewed the rally off December's low. The high-range close sets the stage for a steady to slightly lower opening when Tuesday's day session begins. Stochastics and the RSI are overbought but remain neutral to bullish signaling that sideways to higher prices are possible near-term. If February extends the aforementioned rally, December's high crossing at $83.27 is the next upside target. Closes below the 20-day moving average crossing at $76.37 would signal that a short-term top has been posted. First resistance is the 50-day moving average crossing at $80.56. Second resistance is December's high crossing at $83.27. First support is the December 16th low crossing at $73.40. Second support is the December 9thlow crossing at $70.31.
February heating oil closed higher on Friday as it consolidates above the 50-day moving average crossing at $3.2384. The high-range close sets the stage for a steady to higher opening when Tuesday's day trading session begins. Stochastics and the RSI are overbought but remain neutral to bullish signaling that sideways to higher prices are possible near-term. If February extends the rally off the December 9th low, the November 15th high crossing at $3.4722 is the next upside target. Closes below the 20-day moving average crossing at $3.0763 would confirm that a short-term top has been posted. First resistance is Tuesday's high crossing at $3.3543. Second resistance is the November 15th high crossing at $3.4722. First support is the 20-day moving average crossing at $3.0763. Second support is the December 20th low crossing at $3.9682.
February unleaded gas closed sharply higher on Friday as it extends the rally off December's low. The high-range close sets the stage for a steady to higher opening when Monday's day session begins trading. Stochastics and the RSI are overbought but remain neutral to bullish signaling that sideways to higher prices are possible near-term. If February extends this month's rally, the November 14th high crossing at $2.5783 is the next upside target. Closes below the 20-day moving average crossing at 2.2329 would signal that a short-term top has been posted. First resistance is today's high crossing at $2.4866. Second resistance is the November 14th high crossing at $2.5783. First support is the 20-day moving average crossing at $2.2329. Second support is the December 16th low crossing at 2.1157.
February Henry natural gas closed lower on Friday as it extends the decline off November's high. The low-range close sets the stage for a steady to lower opening when Tuesday's day session begins trading. Stochastics and the RSI are oversold but remain neutral to bearish signaling that sideways to lower prices are possible near-term. If February extends the aforementioned decline, the 75% retracement level of the 2020-2022 rally crossing at 4.332 is the next downside target. Closes above the 20-day moving average crossing at 5.585 would signal that a short-term low has been posted. First resistance is the 10-day moving average crossing at 5.119. Second resistance is the 20-day moving average crossing at 5.585. First support is today's low crossing at 4.378. Second support is the 75% retracement level of the 2020-2022 rally crossing at 4.332.
CURRENCIES? http://quotes.ino.com/ex?changes/?c=currencies ""
The March Dollar closed lower on Friday as it extends the trading range of the past three-weeks. The low-range close sets the stage for a steady to lower opening when Tuesday's day session begins trading. Stochastics and the RSI are turning neutral to bearish signaling that sideways to lower prices are possible near-term. If March renews the decline off September's high, the 75% retracement level of the January-September rally crossing at $101.331 is the next downside target. Closes above the December 7th high crossing at $105.445 would signal that a short-term low has been posted. First resistance is the December 7th high crossing at $105.445. Second resistance is the November 30thhigh crossing at $106.775. First support is the December 15th low crossing at $102.875. Second support is 75% retracement level of the January-September rally crossing at $101.331.
The March Euro closed higher on Friday as it extends the extends the trading range of the past three-weeks. The high-range close sets the stage for a steady to higher opening when Tuesday's day session begins trading. Stochastics and the RSI are turning neutral to bullish signaling that sideways to higher prices are possible near-term. If March resumes the rally off September's low, the March 31st high crossing at $1.09680 is the next upside target. Closes below last-Thursday's low crossing at 1.06340 would signal that a short-term top has been posted. First resistance is the 25% retracement level of the 2018-2022 decline crossing at $1.07982. Second resistance is the March 31st high crossing at $1.09680. First support is last-Thursday's low crossing at $1.06340. Second support is the December 7th low crossing at $1.05210.
The March British Pound closed slightly higher on Friday. The mid-range close sets the stage for a steady to slightly higher opening when Tuesday's day session begins trading. Stochastics and the RSI are oversold but remain neutral to bearish signaling sideways to lower prices are possible near-term. If March extends the decline off December's high, the 50-day moving average crossing at 1.1912 is the next downside target. Closes above the 20-day moving average crossing at 1.2199 would signal that a short-term low has been posted. If March renews the rally off September's low, the 62% retracement level of the May-September decline crossing at 1.2770 is the next upside target. First resistance is December's high crossing at 1.2479. Second resistance is the 62% retracement level of the May-September decline crossing at 1.2770. First support is the November 30th low crossing at 1.1937. Second support is the 50-day moving average crossing at 1.1912.
The March Swiss Franc closed lower on Friday. The mid-range close sets the stage for a steady to lower opening when Tuesday's day session begins trading. Stochastics and the RSI are neutral to bullish signaling that sideways to higher prices are possible near-term. If March renews the rally off September's low, the 62% retracement level of the 2018-2022 decline crossing at 1.10351 is the next upside target. Closes below last-Friday's low crossing at 1.07930 would signal that a short-term top has been posted. First resistance is December's high crossing at 1.09665. Second resistance is the 62% retracement level of the 2018-2022 decline crossing at 1.10351. First support is last-Friday's low crossing at 1.07930. Second support is the November 30th low crossing at 1.06060.
The March Canadian Dollar closed slightly higher on Friday as it extends the trading range of the past four-weeks. The high-range close sets the stage for a steady to higher opening when Tuesday's day session begins trading. Stochastics and the RSI are neutral to bullish signaling that sideways to higher prices are possible near-term. Closes above Tuesday's high crossing at 74.22 would confirm that a short-term low has been posted while opening the door for additional short-term gains. If March renews the decline off November's high, the November 3rd low crossing at 72.58 is the next downside target. First resistance is the December 5th high crossing at 74.82. Second resistance is the November 25thhigh crossing at 75.16. First support is the December 16th low crossing at 73.04. Second support is the November 3rd low crossing at 72.58.
The March Japanese Yen closed sharply higher on Friday and posted a new high close for the rally off October's low. The high-range close sets the stage for a steady to higher opening when Tuesday’s day session begins trading. Stochastics and the RSI are turning neutral to bullish signaling that sideways to higher prices are possible near-term. If March renews the rally off October's low, August's high crossing at 0.078135 is the next upside target. Closes below the 20-day moving average crossing at 0.075015 would confirm that a short-term top has been posted. First resistance is last-Tuesday's high crossing at 0.077470. Second resistance is August's high crossing at 0.078135. First support is the 20-day moving average crossing at 0.075015. Second support is the December 15th crossing at 0.073210.
PRECIOUS METALS? http://quotes.ino.com/ex?changes/?c=metals ""
February gold closed higher on Friday as it extends this month's trading range. The high-range close sets the stage for a steady to higher opening when Tuesday's day session begins trading. Stochastics and the RSI are neutral to bullish signaling that sideways to higher prices are possible near-term. If February extends the rally off November's low, the 50% retracement level of the March-October decline crossing at $1861.40 is the next upside target. Closes below the 20-day moving average crossing at $1807.40 would signal that a short-term top has been posted while opening the door for additional weakness near-term. First resistance is Tuesday's high crossing at $1841.90. Second resistance is the 50% retracement level of the March-October decline crossing at $1861.40. First support is the 20-day moving average crossing at $1807.40. Second support is the December 15th low crossing at $1782.00.
March silver closed slightly lower on Friday as it extended the trading range of the past two-weeks. The high-range close sets the stage for a steady to higher opening when Tuesday's day session begins trading. Stochastics and the RSI are neutral signaling that sideways trading is possible near-term. If March extends the rally off October's low, the 75% retracement level of the March-August decline crossing at 24.779 is the next upside target. Closes below the 20-day moving average crossing at 23.583 would signal that a short-term top has been posted while opening the door for additional weakness near-term.First resistance is last-Wednesday's high crossing at 24.525. Second resistance is the 75% retracement level of the March-September decline crossing at 24.779. First support is the 20-day moving average crossing at 23.583. Second support is the December 16th low crossing at 22.735.
March copper closed slightly lower on Friday. The mid-range close sets the stage for a steady to lower opening when Tuesday's day session begins trading. Stochastics and the RSI have turned neutral to bearish signaling that sideways to lower prices are possible near-term. Closes below last-Tuesday's low crossing at 3.7230 would confirm that a short-term top has been posted. If March renews the rally off September's low, the 50% retracement level of the March-July decline crossing at 4.0343 is the next upside target. First resistance is November's high crossing at 3.9470. Second resistance is the 50% retracement level of the March-July decline crossing at 4.0343. First support is last-Tuesday's low crossing at 3.7230. Second support is the 50-day moving average crossing at 3.6899.
GRAINS? http://quotes.ino.com/ex?changes/?c=grains "
March Corn closed down $0.01-cent at $6.78 1/2.
March corn closed lower on Friday. The low-range close sets the stage for a steady to lower opening when Tuesday's day session begins trading. Stochastics and the RSI are overbought but remain neutral to bullish signaling that sideways to higher prices are possible near-term. Closes above the October downtrend line crossing near $6.85 would open the door for a possible test of the 75% retracement level of the October-December decline crossing at $6.92 1/2. Closes below the 10-day moving average crossing at $6.65 1/2 would signal that a short-term top has been posted. First resistance is October's downtrend line crossing near $6.85. Second resistance is the 75% retracement level of the October-December decline crossing at $6.92 1/2. First support is the 50-day moving average crossing at $6.68 1/4. Second support is the 10-day moving average crossing at $6.65 1/2.
March wheat closed up $0.18-cents at $7.92.
March wheat closed higher on Friday as it extends the rally off December's low. The high-range close sets the stage for a steady to higher opening when Tuesday's day session begins trading. Stochastics and the RSI are overbought but remain neutral to bullish signaling that sideways to higher prices are possible near-term. If March extends this month's rally, the 50-day moving average crossing at $8.06 1/2 is the next upside target. Closes below the 20-day moving average crossing at $7.57 1/2 would signal that a short-term top has been posted. First resistance is today's high crossing at $7.99. Second resistance is the 50-day moving average crossing at $8.06 1/2. First support is the 20-day moving average crossing at $7.57 1/2. Second support is the 75% retracement level of the 2018-2022 rally crossing at $7.24 1/4.
March Kansas City Wheat closed up $0.21 1/2-cents at $8.88.
March Kansas City wheat closed higher on Friday. The high-range close sets the stage for a steady to higher opening when Tuesday's day session begins trading. Stochastics and the RSI are turning neutral to bullish signaling that sideways to higher prices are possible near-term. If March extends this month's rally, the 50-day moving average crossing at $9.02 3/4. Closes below the 20-day moving average crossing at $8.58 would signal that a short-term top has been posted.First resistance is Tuesday's high crossing at $8.94 3/4. Second resistance is the 50-day moving average crossing at $9.02 3/4. First support is the 19th low crossing at $8.30 3/4. Second support is the December 6th low crossing at $8.21 3/4.
March Minneapolis wheat closed up $0.24 3/4-cents at $9.38 3/4.
March Minneapolis wheat closed sharply higher on Friday. The high-range close sets the stage for a steady to higher opening when Tuesday's day session begins trading. Stochastics and the RSI are turning neutral to bullish signaling that sideways to higher prices are possible near-term. Closes above the 50-day moving average crossing at $9.42 3/4 would open the door for additional short-term gains. If March renews the decline off November's high, August's low crossing at $8.75 3/4 is the next downside target. First resistance is the 50-day moving average crossing at $9.42 3/4. Second resistance is the November 15th high crossing at $9.91 1/4. First support is last-Monday's low crossing at $9.00 3/4. Second support is the December 6th low crossing at $8.90.
SOYBEAN COMPLEX? http://quotes.ino.com/ex?changes/?c=grains "
March soybeans closed up $0.07 3/4-cents at $15.24.
March soybeans closed higher on Friday as it extends the rally off October's low. Early gains filled June's low crossing at $15.28 1/2. The mid-range close sets the stage for a steady to higher opening when Tuesday's day trade begins. Stochastics and the RSI are neutral to bullish signaling that sideways to higher prices are possible near-term. If March extends the rally off October's low, June's high crossing at $15.72 1/4 is the next upside target. Closes below the 20-day moving average crossing at $14.81 1/2 would signal that a short-term top has been posted. First resistance is the 87% retracement level of the June-July decline crossing at $15.37 1/2. Second resistance is June's high crossing at $15.72 1/4. First support is the 10-day moving average crossing at $14.91. Second support is the 20-day moving average crossing at $14.81 1/2.
March soybean meal closed up $12.50 at $471.00.
March soybean meal closed sharply higher on Friday as it closed above the upper boundary of this month's trading range to renew the rally off November's low. The high-range close sets the stage for a steady to higher opening when Tuesday's day session begins trading. Stochastics and the RSI have turned neutral to bullish signaling that sideways to higher prices are possible near-term. If March renews the rally off October's low, monthly resistance on the continuation chart crossing at $478.60 is the next upside target. Closes below the December 19th low crossing at $443.40 would confirm a downside breakout of the aforementioned trading range. First resistance is today's high crossing at $476.10. Second resistance is monthly resistance crossing at $478.60. First support is the December 19th low crossing at $443.40. Second support is the 50-day moving average crossing at $422.90.
March soybean oil closed down 229-pts. At 64.07.
March soybean oil posted a key reversal down on Friday due to profit taking. The low-range close sets the stage for a steady to lower opening when Tuesday's day session begins trading. Stochastics and the RSI are overbought but remain neutral to bullish signaling that sideways to higher prices are possible near-term. Closes above the 50-day moving average crossing at 67.00 would open the door for additional gains near-term. Closes below the 20-day moving average crossing at 63.23 would signal that a short-term top has been posted. First resistance is the 50-day moving average crossing at 67.00. Second resistance is the November 29th high crossing at 72.49. First support is the 20-day moving average crossing at 63.23. Second support is the December 16th crossing at 61.47.
LIVESTOCKhttp://quotes.ino.com/exchanges/?c=livestock
February hogs closed down $0.70 at $87.98.
February hogs closed lower on Friday as it consolidates some of the rally off December's low. The mid-range close sets the stage for a steady to lower opening when Tuesday's day session begins trading. Stochastics and the RSI are overbought but remain neutral to bullish signaling that sideways to higher prices are possible near-term. If February renews this month's rally, December's high crossing at $91.90 is the next upside target. Closes below the 20-day moving average crossing at $86.82 would signal that a short-term top has been posted. First resistance is Tuesday's high crossing at $91.60 Second resistance is December's high crossing at $91.90. First support is the 20-day moving average crossing at $86.82. Second support is last-Wednesday's low crossing at $83.90.
February cattle closed down $0.93 at $157.93.
February cattle posted an inside day with a lower close on Friday as it consolidated some of the rally off December's low. The low-range close sets the stage for a steady to lower opening on Tuesday. Stochastics and the RSI are overbought but remain neutral to bullish signaling that sideways to higher prices are possible near-term. If February extends this month's rally, the 87% retracement level of the monthly continuation chart crossing at $159.54 is the next upside target. Closes below the 20-day moving average crossing at $156.20 would signal that a short-term top has been posted. First resistance is Thursday's high crossing at $159.18. Second resistance is the 87% retracement level of the monthly continuation chart crossing at $159.54. First support is the 10-day moving average crossing at $157.26. Second support is the 20-day moving average crossing at $156.20.
March Feeder cattle closed down $0.75 at $186.03.
March Feeder cattle closed lower on Friday. The low-range close sets the stage for a steady to lower opening when Tuesday's day session begins trading. Stochastics and the RSI are neutral to bullish signaling that sideways to higher prices are possible near-term. If March extends the rally off the September 20th high crossing at $188.23 is the next upside target. Closes below Wednesday's low crossing at $184.80 would signal that a short-term top has been posted while opening the door for additional weakness near-term. First resistance is Thursday's high crossing at $187.30. Second resistance is the 75% retracement level of the August-October decline crossing at $188.29. First support is Wednesday's low crossing at $184.80. Second support is the 50-day moving average crossing at $183.48.
FOOD & FIBERhttp://quotes.ino.com/ex changes/?c=food
March coffee closed lower on Friday. The low-range close sets the stage for a steady to lower opening on Tuesday. Stochastics and the RSI are turning neutral to bearish signaling sideways to lower prices are possible near-term. If March renews the decline off August's high, November's low crossing at $15.41 is the next downside target. Closes above Wednesday's high crossing at $17.50 would open the door for additional gains near-term. First resistance is Wednesday's high crossing at $17.50. Second resistance is November's high crossing at $17.82. First support is November's low crossing at $15.41. Second support is the 75% retracement level of the 2020-2022 rally crossing at $14.74.
March cocoa posted an inside day with a higher close on Friday. The high-range close sets the stage for a steady to higher opening on Tuesday. Stochastics and the RSI have turned neutral to bearish signaling sideways to lower prices are possible near-term. Closes below the 20-day moving average crossing at 25.39 would signal that a short-term top has been posted while opening the door for additional weakness near-term. If March extends the rally off September low, the March-2022 high on the weekly continuation chart crossing at 27.10 is the next upside target.
March sugar closed low on Friday as it extended the decline off December's high and is testing support marked by the 20-day moving average crossing at 19.44. The low-range close sets the stage for a steady to lower opening on Tuesday. Stochastics and the RSI are neutral to bearish signaling that sideways to lower prices are possible near-term. Closes below the 20-day moving average crossing at 19.44 would signal that a short-term top has been posted. If March resumes the rally off September's low, weekly resistance on the weekly continuation chart crossing at 26.46 is the next upside target.
March cotton closed higher on Friday. The mid-range close sets the stage for a steady to higher opening on Tuesday. Stochastics and the RSI are neutral to bearish signaling that sideways to lower prices are possible near-term. Closes below the 50-day moving average crossing at 81.97 would signal that a short-term top has been posted. If March extends the rally off October's low, the 50% retracement level of the August-October decline crossing at 93.31 is the next upside target.
Thanks tallpine!
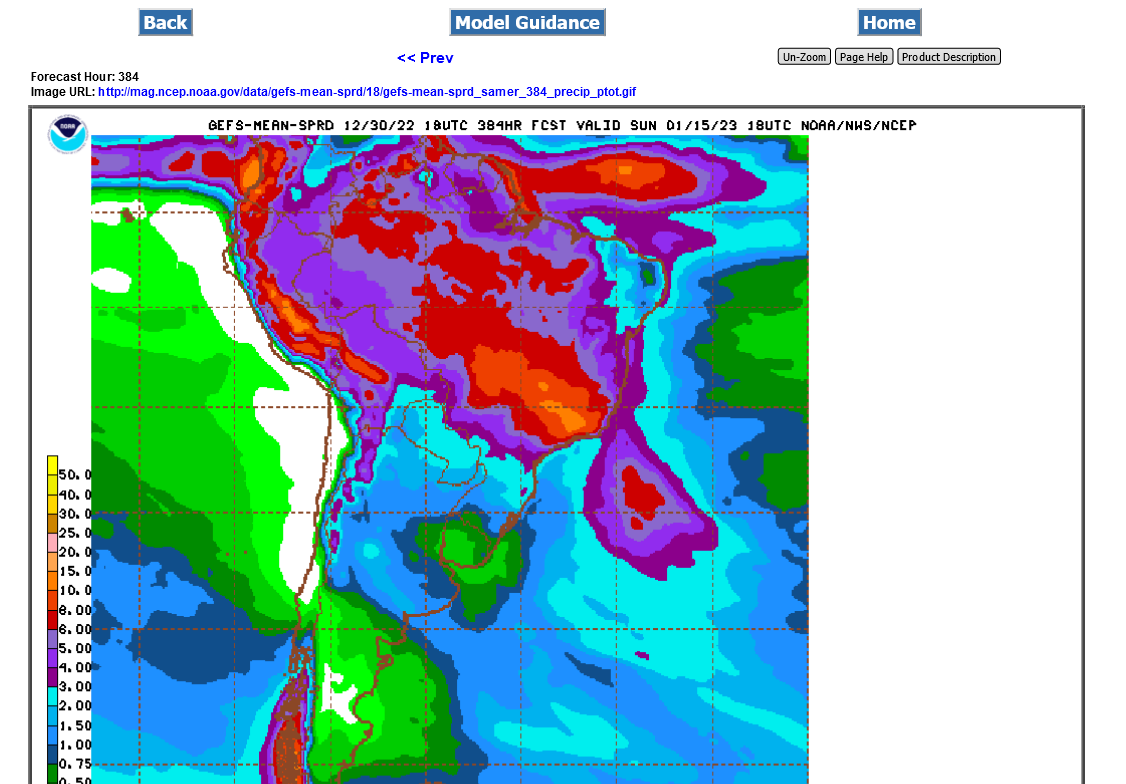
Latest rains from the 18z GEFS for the next 2 weeks.
Not much change. With January starting next week, it's like July in the Northern Hemisphere. Hot and dry weather is resulting in permanent yields losses now.