KEY EVENTS TO WATCH FOR:
Tuesday, January 31, 2023
8:30 AM ET. 4th Quarter Employment Cost Index
ECI, Q/Q% (previous +1.2%)
ECI, Y/Y% (previous +5.0%)
8:55 AM ET. Johnson Redbook Retail Sales Index
Ret Sales Mo-to-Date, Y/Y% (previous +5.0%)
Latest Wk, Y/Y% (previous +4.6%)
9:00 AM ET. November U.S. Monthly House Price Index
9:00 AM ET. November S&P CoreLogic Case-Shiller Indices
10-City Idx, M/M% (previous -0.7%)
10-City Idx, Y/Y% (previous +8.0%)
20-City Idx, M/M% (previous -0.8%)
20-City Idx, Y/Y% (previous +8.6%)
National Idx, M/M% (previous -0.5%)
National Idx, Y/Y% (previous +9.2%)
9:45 AM ET. January Chicago Business Barometer - ISM-Chicago Business Survey -
Chicago PMI
PMI-Adj (previous 44.9)
10:00 AM ET. January Consumer Confidence Index
Cons Conf Idx (previous 108.3)
Expectation Idx
Present Situation Idx (previous 147.2)
10:00 AM ET. 4th Quarter U.S. Housing Vacancies
3:00 PM ET. December Agricultural Prices
Farm Prices, M/M% (previous +4.5%)
4:30 PM ET. API Weekly Statistical Bulletin
Crude Stocks, Net Chg (Bbls) (previous +3.4M)
Gasoline Stocks, Net Chg (Bbls) (previous +0.6M)
Distillate Stocks, Net Chg (Bbls) (previous -1.9M)
N/A U.S. Federal Open Market Committee meeting
Wednesday, February 1, 2023
7:00 AM ET. MBA Weekly Mortgage Applications Survey
Composite Idx (previous 255.3)
Composite Idx, W/W% (previous +7.0%)
Purchase Idx-SA (previous 205.4)
Purchase Idx-SA, W/W% (previous +3.4%)
Refinance Idx (previous 502.3)
Refinance Idx, W/W% (previous +14.6%)
8:15 AM ET. January ADP National Employment Report
Private Sector Jobs, Net Chg (previous +235000)
8:30 AM ET. U.S. Department of the Treasury's quarterly refundingannouncement
9:45 AM ET. January US Manufacturing PMI
PMI, Mfg (previous 46.2)
10:00 AM ET. January ISM Report On Business Manufacturing PMI
Manufacturing PMI (previous 48.4)
Prices Idx (previous 39.4)
Employment Idx (previous 51.4)
Inventories (previous 51.8)
New Orders Idx (previous 45.2)
Production Idx (previous 48.5)
10:00 AM ET. December Construction Spending - Construction Put in Place
New Construction (previous +0.2%)
Residential Construction
10:00 AM ET. December Metropolitan Area Employment & Unemployment
10:00 AM ET. December Job Openings & Labor Turnover Survey
10:30 AM ET. EIA Weekly Petroleum Status Report
Crude Oil Stocks (Bbl) (previous 448.548M)
Crude Oil Stocks, Net Chg (Bbl) (previous +0.533M)
Gasoline Stocks (Bbl) (previous 232.022M)
Gasoline Stocks, Net Chg (Bbl) (previous +1.763M)
Distillate Stocks (Bbl) (previous 115.27M)
Distillate Stocks, Net Chg (Bbl) (previous -0.507M)
Refinery Usage (previous 86.1%)
Total Prod Supplied (Bbl/day) (previous 19.447M)
Total Prod Supplied, Net Chg (Bbl/day) (previous -0.867M)
11:00 AM ET. January Global Manufacturing PMI
PMI, Mfg (previous 48.6)
2:00 PM ET. U.S. interest rate decision
Federal Funds Rate
Federal Funds Rate Change (Pts)
Fed Funds Rate-Range High (previous 4.50)
Fed Funds Rate-Range Low (previous 4.25)
FOMC Vote For Action (previous 12)
FOMC Vote Against Action (previous 0)
Discount Rate (previous 4.50)
Discount Rate Change (Pts) (previous +0.50)
Discount Rate-Range High
Discount Rate-Range Low
4:00 PM ET. January Domestic Auto Industry Sales
The STOCK INDEXES? http://quotes.ino.com/ex?changes/?c=indexes
The Dow ended a six-day rally on Monday as it consolidated some of the rally off the January 20th low. The low-range close sets the stage for a steady to lower opening when Tuesday's day session begins trading. Stochastics and the RSI are neutral to bullish signaling that sideways to higher prices are possible near-term. If the Dow extends the rally off the January 20th low, January's high crossing at 34,342.32 is the next upside target. If the Dow renews the decline off January's high, the December 22nd low crossing at 32,573.43 is the next downside target. First resistance is January's high crossing at 34,342.32. Second resistance is the December 13th high crossing at 34,712.28. First support is the January 5th low crossing at 32,812.33. Second support is the December 22nd low crossing at 32,573.43.
The March NASDAQ 100 closed sharply lower on Monday as it consolidated some of the rally off January's low. The low-range close sets the stage for a steady to lower opening when Tuesday's day session begins trading. Stochastics and the RSI are overbought but remain neutral to bullish signaling sideways to higher prices are possible. If March extends the rally off January's low, the 62% retracement level of the August-October decline crossing at 12,624.66 is the next upside target. Closes below the 20-day moving average crossing at 11,508.49 would signal that a short-term top has been posted. First resistance is last-Friday's high crossing at 12,278.75. Second resistance is the 62% retracement level of the August-October decline crossing at 12,624.66. First support is the 10-day moving average crossing at 11,818.25. Second support is the 20-day moving average crossing at 11,508.49.
The March S&P 500 closed lower on Monday as it consolidated some of the rally off December's low. The low-range close sets the stage for a steady to lower opening when Tuesday's day session begins trading. Stochastics and the RSI are overbought but remain neutral to bullish signaling that sideways to higher prices are possible near-term. If March extends the rally off December's low, the 75% retracement level of the August-October decline crossing at 4154.88 is the next upside target. Closes below the 20-day moving average crossing at 3967.64 would signal that a short-term top has been posted. First resistance is last-Friday's high crossing at 4103.25. Second resistance is the 75% retracement level of the August-October decline crossing at 4154.88. First support is the 10-day moving average crossing at 4016.18 Second support is the 20-day moving average crossing at 3967.64.
INTEREST RATES? http://quotes.ino.com/ex?changes/?c=interest ""
March T-bonds closed down 10-pts. at 129-27.
March T-bonds closed lower on Monday. The low-range close sets the stage for a steady to slightly lower opening when Tuesday's day session begins trading. Stochastics and the RSI are neutral to bearish signaling that sideways to lower prices are possible near-term. Closes below the 50-day moving average crossing at 128-24 would signal that a short-term top has been posted. If March resumes the rally off December's low, the 62% retracement level of the August-October decline crossing at 133-30 is the next upside target. First resistance is the January 19th high crossing at 132-31. Second resistance is the 62% retracement level of the August-October-2022 decline crossing at 133-30. First support is the 20-day moving average crossing at 129-15. Second support is the 50-day moving average crossing at 128-24.
March T-notes closed down 75-pts. at 114.120.
March T-notes closed lower on Monday as it extends the decline off January's high. The low-range close sets the stage for a steady to lower opening when Tuesday's day session begins trading. Stochastics and the RSI are neutral to bearish signaling that sideways to lower prices are possible near-term. Closes below the 50-day moving average crossing at 113.308 would signal that a short-term top has been posted. If December renews the rally off December's low, the 62% retracement level of the August-October-2022 decline crossing at 116.235 is the next upside target. First resistance is January's high crossing at 116.080. Second resistance is the 62% retracement level of the August-October-2022 decline crossing at 116.235. First support is the 50-day moving average crossing at 113.308. Second support is the December 30th low crossing at 111.280.
ENERGY MARKETS? http://quotes.ino.com/ex?changes/?c=energy ""
March crude oil closed lower on Monday following last-Friday's key reversal down. Today's closed below the 50-day moving average crossing at $77.86 confirms that a short-term top has been posted while opening the door for additional weakness into early-February. The low-range close sets the stage for a steady to lower opening when Tuesday's day session begins. Stochastics and the RSI have turned neutral to bearish signaling that sideways to lower prices are possible near-term. If March extends today's decline, the December-January uptrend line crossing near $74.88 is the next downside target. If March renews the rally off January's low, December's high crossing at $83.14 is the next upside target. First resistance is December's high crossing at $83.14. Second resistance is the November 14th high crossing at $87.00. First support is today's low crossing at $77.66. Second support is the January 5thlow crossing at $72.74.
March heating oil closed sharply lower on Monday as it extended the decline off last-Tuesday's high. The low-range close sets the stage for a steady to lower opening when Tuesday's day trading session begins. Stochastics and the RSI are neutral to bearish signaling that sideways to lower prices are possible near-term. Today's close below the 50-day moving average crossing at $3.0831 signals that a short-term top has been posted. Closes above the 10-day moving average crossing at $3.2558 would signal that a short-term low has been posted. First resistance is the 10-day moving average crossing at $3.2558. Second resistance is last-Tuesday's high crossing at $3.4664. First support is today's low crossing at $3.0534. Second support is the December-January uptrend line crossing at $2.9899.
March unleaded gas closed sharply lower on Monday as it extended the decline off January's high. The low-range close sets the stage for a steady to lower opening when Tuesday's day session begins trading. Stochastics and the RSI have turned neutral to bearish signaling that sideways to lower prices are possible near-term. Closes below the 20-day moving average crossing at 2.4866 would signal that a short-term top has been posted. If March renews the rally off December's low, the 75% retracement level of 2022's decline crossing at $2.7856 is the next upside target. First resistance is last-Wednesday's high crossing at $2.7186. Second resistance is the 75% retracement level of 2022's decline crossing at $2.7856. First support is the 20-day moving average crossing at 2.4866. Second support is the 50-day moving average crossing at $2.3627.
March Henry natural gas closed lower on Monday as it extended the decline off September's high. The mid-range close sets the stage for a steady to lower opening when Tuesday's day session begins trading. Stochastics and the RSI are oversold but remain neutral to bearish signaling that sideways to lower prices are possible near-term. If March extends the decline off November's high, the March-2020 low crossing at 2.473 is the next downside target. Closes above the 20-day moving average crossing at 3.260 would signal that a short-term low has been posted. First resistance is the 20-day moving average crossing at 3.260. Second resistance is the 50-day moving average crossing at 4.593. First support is today's low crossing at 2.612. Second support is theMarch-2020 low crossing at 2.473.
CURRENCIES? http://quotes.ino.com/ex?changes/?c=currencies ""
The March Dollar closed higher on Monday as it extends January's trading range above the 75% retracement level of the January-September rally crossing at $101.331. The high-range close sets the stage for a steady to higher opening when Tuesday's session begins trading. Stochastics and the RSI are turning neutral to bullish signaling that sideways to higher prices are possible near-term. Closes above the 20-day moving average crossing at $102.483 would signal that a short-term low has been posted. If March renews the decline off September's high, the 87% retracement level of the January-September rally crossing at $99.229 is the next downside target. First resistance is the 20-day moving average crossing at $102.483. Second resistance is the 50-day moving average crossing at $103.852. First support is the 75% retracement level of the January-September rally crossing at $101.331. Second support is the 87% retracement level of the January-September rally crossing at $99.229.
The March Euro closed slightly lower on Tuesday. The low-range close sets the stage for a steady to lower opening when Tuesday's day session begins trading. Stochastics and the RSI are overbought but are turning neutral to bearish signaling that sideways to lower prices are possible near-term. Closes below the 20-day moving average crossing at 1.08171 would signal that a short-term top has been posted. If March extends the rally off September's low, the March 31st -2022 high crossing at $1.09680 is the next upside target. First resistance is last-Monday's high crossing at $1.09625. Second resistance is the March 31st -2022 high crossing at $1.09680. First support is the 20-day moving average crossing at 1.08171. Second support is the 50-day moving average crossing at $1.06762.
The March British Pound closed slightly lower on Monday as it extends the trading range of the past two-weeks. The low-range close sets the stage for a steady to lower opening when Tuesday's day session begins trading. Stochastics and the RSI are overbought but remain neutral to bullish signaling sideways to higher prices are possible near-term. If March extends the rally off January's low, the 62% retracement level of the 2021-2022 decline crossing at 1.2764 is the next upside target. Closes below the 50-day moving average crossing at 1.2182 would signal that a short-term top has been posted while opening the door for a possible test of the January 6th low crossing at 1.1867. First resistance is last-Monday's high crossing at 1.2462. Second resistance is the 62% retracement level of the 2021-2022 decline crossing at 1.2764. First support is the 20-day moving average crossing at 1.2254. Second support is the 50-day moving average crossing at 1.2182.
The March Swiss Franc closed lower on Monday. The low-range close sets the stage for a steady to lower opening when Tuesday's day session begins trading. Stochastics and the RSI are turning neutral to bearish signaling that sideways to lower prices are possible near-term. Closes below the 50-day moving average crossing at 1.08220 would signal that a short-term top has been posted. If March resumes the rally off September's low, the 75% retracement level of the 2018-2022 decline crossing at 1.10351 is the next upside target. First resistance is the 62% retracement level of the 2018-2022 decline crossing at 1.10351. Second resistance is the 75% retracement level of the 2018-2022 decline crossing at 1.10351. First support is the 50-day moving average crossing at 1.08220. Second support is the January 6th low crossing at 1.06915.
The March Canadian Dollar closed lower on Monday leaving last week's upside breakout of this month's trading range unconfirmed. The low-range close sets the stage for a steady to lower opening when Tuesday's day session begins trading. Stochastics and the RSI are overbought and are turning neutral to bearish signaling that a short-term top might have been posted with today's high. Closes below the 50-day moving average crossing at 74.20 would confirm that a short-term top has been posted. If March extends the rally off January's low, November's high crossing at 75.71 is the next upside target. First resistance is today's high crossing at 75.21. Second resistance is November's high crossing at 75.71. First support is the 20-day moving average crossing at 74.52. Second support is the 50-day moving average crossing at 74.20.
The March Japanese Yen closed lower on Monday. The low-range close sets the stage for a steady to lower opening when Tuesday’s day session begins trading. Stochastics and the RSI have turned neutral to bearish signaling that sideways to lower prices are possible near-term. Closes below the January 18th low crossing at 0.076550 would confirm that a short-term top has been posted while opening the door for additional weakness near-term. If March renews the rally off October's low, the May 24th -2021 high crossing at 0.080525 is the next upside target. First resistance is the January 17th high crossing at 0.079190. Second resistance is the May 24th -2021 high crossing at 0.080525. First support is the January 18th low crossing at 0.076550. Second support is the January 6th low crossing at 0.074830.
PRECIOUS METALS? http://quotes.ino.com/ex?changes/?c=metals ""
April gold closed slightly lower on Monday. The low-range close sets the stage for a steady to lower opening when Tuesday's day session begins trading. Stochastics and the RSI are overbought and are turning neutral to bearish signaling that sideways to lower prices are possible near-term. Closes below the 20-day moving average crossing at $1914.10 would signal that a short-term top has been posted while opening the door for additional weakness near-term. If April renews the rally off November's low, the 75% retracement level of the March-October decline crossing at $1978.50 is the next upside target. First resistance is last-Thursday's high crossing at $1966.50. Second resistance is the 75% retracement level of the March-October decline crossing at $1978.50. First support is the 20-day moving average crossing at $1914.10. Second support is the 50-day moving average crossing at $1850.60.
March silver closed slightly higher on Monday while extending the December-January trading range. The low-range close sets the stage for a steady to lower opening when Tuesday's day session begins trading. Stochastics and the RSI are turning neutral to bearish signaling that sideways to lower prices are possible near-term. Closes below the 50-day moving average crossing at 23.228 would confirm a downside breakout of the aforementioned trading range while opening the door for additional weakness near-term. If March renews the rally off October's low, the 87% retracement level of the March-August decline crossing at 25.995 is the next upside target. First resistance is the 75% retracement level of the March-September decline crossing at 24.779. Second resistance is the 87% retracement level of the March-August decline crossing at 25.938. First support is the 50-day moving average crossing at 23.228. Second support is the December 6th low crossing at 22.190.
March copper closed lower on Monday as it consolidates some of the rally off January's rally. The low-range close sets the stage for a steady to lower opening when Tuesday's day session begins trading. Stochastics and the RSI are turning neutral to bearish signaling that sideways to lower prices are possible near-term. Closes below the 20-day moving average crossing at 4.1047 would signal that a short-term top has been posted. If March extends the rally off September's low, the 75% retracement level of the March-July decline crossing at 4.4773 is the next upside target. First resistance is the January 18th high crossing at 4.3550. Second resistance is the 75% retracement level of the March-July decline crossing at 4.4773. First support is the 20-day moving average crossing at 4.1047. Second support is the 50-day moving average crossing at 3.9010.
GRAINS? http://quotes.ino.com/ex?changes/?c=grains "
March Corn closed up $0.00 3/4-cents at $6.83 3/4.
March corn closed fractionally higher on Monday as it extends the rally off the January 23rd low. The high-range close sets the stage for a steady to higher opening when Tuesday's night session begins trading. Stochastics and the RSI are neutral to bullish signaling that sideways to higher prices are possible near-term. If March renews the rally off January's low, the 75% retracement level of the October-December decline crossing at $6.92 1/2 is the next upside target. Closes below the 50-day moving average crossing at $6.63 1/2 would confirm that a short-term top has been posted. First resistance is the January 18th high crossing at $6.88 3/4. Second resistance is the 75% retracement level of the October-December decline crossing at $6.92 1/2. First support is the 50-day moving average crossing at $6.63 1/4. Second support is January's low crossing at $6.48 1/4.
March wheat closed down $0.02 1/2-cents at $7.52 1/2.
March wheat closed higher on Tuesday. The mid-range close sets the stage for a steady to higher opening when Tuesday's day session begins trading. Stochastics and the RSI are neutral to bullish signaling that sideways to higher prices are possible near-term. Closes and above the 50-day moving average crossing at $7.63 would signal that a short-term low has been posted. If March renews this month's decline, the September 6th 2021 low crossing at $6.93 1/2 is the next downside target. First resistance is the 50-day moving average crossing at $7.63. Second resistance is the December 30th high crossing at $7.99. First support is last-Monday's low crossing at $7.12 1/2. Second support is the September 6th 2021 low crossing at $6.93 1/2.
March Kansas City Wheat closed up $0.04 1/2-cents at $8.73 3/4.
March Kansas City wheat closed higher on Monday as it extends the rally off January's low. The low-range close sets the stage for a steady to slightly higher opening when Tuesday's day session begins trading. Stochastics and the RSI are overbought but remain neutral to bullish signaling that sideways to higher prices are possible near-term. If March extends the aforementioned rally, the December 27th high crossing at $8.94 3/4 is the next upside target. Closes below the 20-day moving average crossing at $8.44 1/2 would signal that a short-term top has been posted. If March renews the decline off December's high, the January 10th 2022 low crossing at $7.68 3/4 is the next downside target. First resistance is today's high crossing at $8.83 1/2. Second resistance is the December 27 high crossing at $8.94 3/4. First support is the January 23rd low crossing at $8.11. Second support is the January 10th low crossing at $8.03 1/4.
March Minneapolis wheat closed unchanged crossing at $9.21 1/2.
March Minneapolis wheat closed unchanged on Monday. The low-range close sets the stage for a steady to lower opening when Tuesday's day session begins trading. Stochastics and the RSI are overbought but remain neutral to bullish signaling that sideways to higher prices are possible near-term. Closes above the 50-day moving average crossing at $9.20 3/4 would signal that a short-term low has been posted while opening the door for additional short-term gains. If March renews the decline off November's high, August's low crossing at $8.75 3/4 is the next downside target. First resistance is the 50-day moving average crossing at $9.20 3/4. Second resistance is the January 30th high crossing at $9.40. First support is last-Monday's low crossing at $8.85. Second support is August's low crossing at $8.75 3/4.
SOYBEAN COMPLEX? http://quotes.ino.com/ex?changes/?c=grains "
March soybeans closed down $0.25 3/4-cents at $15.35 1/4.
March soybeans closed higher on Monday due to bullish extended weather forecast for Argentina. The high-range close sets the stage for a steady to higher opening when Tuesday's day trade begins. Stochastics and the RSI are neutral to bullish signaling that sideways to higher prices are possible near-term. If March renews this month's rally. last-June's high crossing at $15.72 1/4 is the next upside target. If March renews the decline off the January 18th high, January's low crossing at $14.65 is the next downside target.First resistance is the January 18th high crossing at $15.48 1/2. Second resistance is last-June's high crossing at $15.72 1/4. First support is the 50-day moving average crossing at $14.82. Second support is January's low crossing at $14.65.
March soybean meal closed up $15.20 at $488.70.
March soybean meal closed sharply higher on Monday and posted a new contract high. The high-range close sets the stage for a steady to higher opening when Tuesday's day session begins trading. Stochastics and the RSI are overbought but remain neutral to bullish signaling that sideways to higher prices are possible near-term. If March extends the rally off Monday's low, the March-21st-high on the monthly continuation chart crossing at $494.70 is the next upside target. Closes below the 20-day moving average crossing at $471.70 would signal that a short-term top has been posted. First resistance is today's high crossing at $490.30. Second resistance is the March-21st-high on the monthly continuation chart crossing at $494.70. First support is the 20-day moving average crossing at $471.70. Second support is January's low crossing at $452.80.
March soybean oil closed up 70-pts. At 61.32.
March soybean oil closed higher on Monday. The high-range close sets the stage for a steady to higher opening when Tuesday's day session begins trading. Stochastics and the RSI are oversold but are turning neutral to bullish signaling that sideways to higher prices are possible near-term. Closes above the 20-day moving a crossing at 62.48 would signal that a short-term low has been posted. If March extends the decline off the December 27th high, December's low crossing at 58.50 is the next downside target. First resistance is the 20-day moving average crossing at 62.48. Second resistance is the 50-day moving average crossing at 64.31. First support is last-Friday's low crossing at 59.90. Second support is December's low crossing at 58.50.
LIVESTOCKhttp://quotes.ino.com/exchanges/?c=livestock
April hogs closed up $0.08 at $86.53.
April hogs closed slightly higher on Monday. The mid-range close sets the stage for a steady to higher opening when Tuesday's day session begins trading. Stochastics and the RSI are neutral to bullish signaling that sideways to higher prices are possible near-term. Closes above the 20-day moving average crossing at $88.34 would signal that a short-term low has been posted. If April resumes the decline off December's high, October's low crossing at $82.63 is the next downside target. First resistance is the 20-day moving average crossing at $88.34. Second resistance is the 50-day moving average crossing at $91.45. First support is last-Thursday's low crossing at $83.70. Second support is October's low crossing at $82.63.
April cattle closed up $2.53 at $163.35.
April cattle closed sharply higher on Monday posted a new contract high as it extends this year's rally. The high-range close sets the stage for a steady to higher opening on Tuesday. Stochastics and the RSI are neutral to bullish signaling that sideways to higher prices are possible near-term. If April extends the rally off January's low, the November-2014 on the monthly continuation chart crossing at $171.65 is the next upside target. Closes below the 50-day moving average crossing at $160.19 would signal that a short-term top has been posted. First resistance is today's high crossing at $163.48. Second resistance is the November-2014 on the monthly continuation chart crossing at $171.65. First support is the 50-day moving average crossing at $163.48. Second support is the January 19th low crossing at $158.55.
March Feeder cattle closed up $0.30 at $183.78.
March Feeder cattle closed higher on Monday as it extends the rally off January's low. The mid-range close sets the stage for a steady to higher opening when Tuesday's day session begins trading. Stochastics and the RSI are neutral to bullish signaling that sideways to higher prices are possible near-term. Closes above the 50-day moving average crossing at $184.24 would signal that a short-term low has been posted while opening the door for additional short-term gains. If March renews the decline off January's high, the October 14th low crossing at $176.28 is the next downside target. First resistance is the 50-day moving average crossing at $184.25. Second resistance is the January 10th high crossing at $187.28. First support is January's low crossing at $179.18. Second support is the October 14th low crossing at $176.28.
FOOD & FIBERhttp://quotes.ino.com/ex changes/?c=food
March coffee closed slightly higher on Monday as it extends the rally off January's low. The high-range close sets the stage for a steady to higher opening on Tuesday. Stochastics and the RSI are overbought but remain neutral to bullish signaling sideways to higher prices are possible near-term. If March extends the rally off January's low, December's high crossing at $17.50 is the next upside target. Closes below the 20-day moving average crossing at $15.86 would signal that a short-term top has been posted. First resistance is today's high crossing at $17.17. Second resistance is December's high crossing at $17.50. First support is the 20-day moving average crossing at $15.86. Second support is the January 11th low crossing at $14.21.
March cocoa posted a key reversal down as it closed lower on Monday. The low-range close sets the stage for a steady to lower opening on Tuesday. Stochastics and the RSI are neutral to bullish signaling that sideways to higher prices are possible near-term. If March extends the aforementioned rally, the January 17th high crossing at 26.75 is the next upside target. Closes below the 50-day moving average crossing at 25.53 would signal that a short-term top has been posted.
March sugar closed high on Monday and posted a new contract high as it extends the rally off January's low. The high-range close sets the stage for a steady to higher opening on Tuesday. Stochastics and the RSI are overbought but remain neutral to bullish signaling that sideways to higher prices are possible near-term. If March extends the rally off January's low, monthly resistance crossing at 21.49 is the next upside target. Closes below the 20-day moving average crossing at 19.86 would signal that a short-term top has been posted.
March cotton closed lower on Monday as it extends the November-January trading range. The low-range close sets the stage for a steady to lower opening on Tuesday. Stochastics and the RSI are turning neutral to bearish signaling that sideways to lower prices are possible near-term. Closes below the 50-day moving average crossing at 83.66 would signal that a short-term top has been posted. If March resumes the rally off October's low, the 50% retracement level of the August-October decline crossing at 93.31 is the next upside target.
Thanks tallpine!
Not a lot of rain coming to Argentina but its getting late in the growing season there:
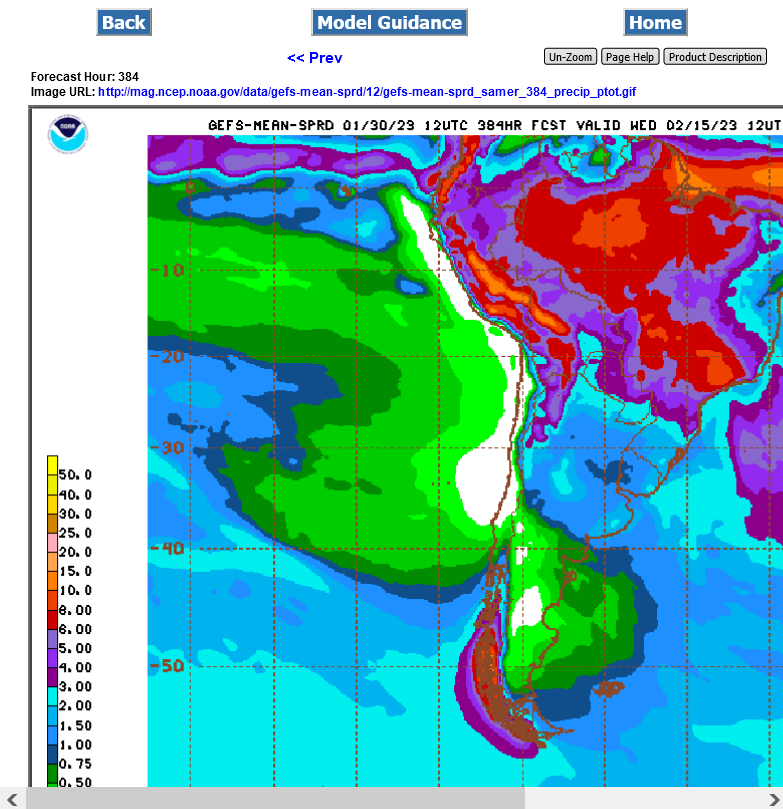
This is what's killing NG prices and caused the gap lower last night.
https://www.marketforum.com/forum/topic/92520/

