
68 entries--time for new thread
LONG
Perhaps an hour too early. Decent recovery from the low.
Too early by an hour?
Ya think?
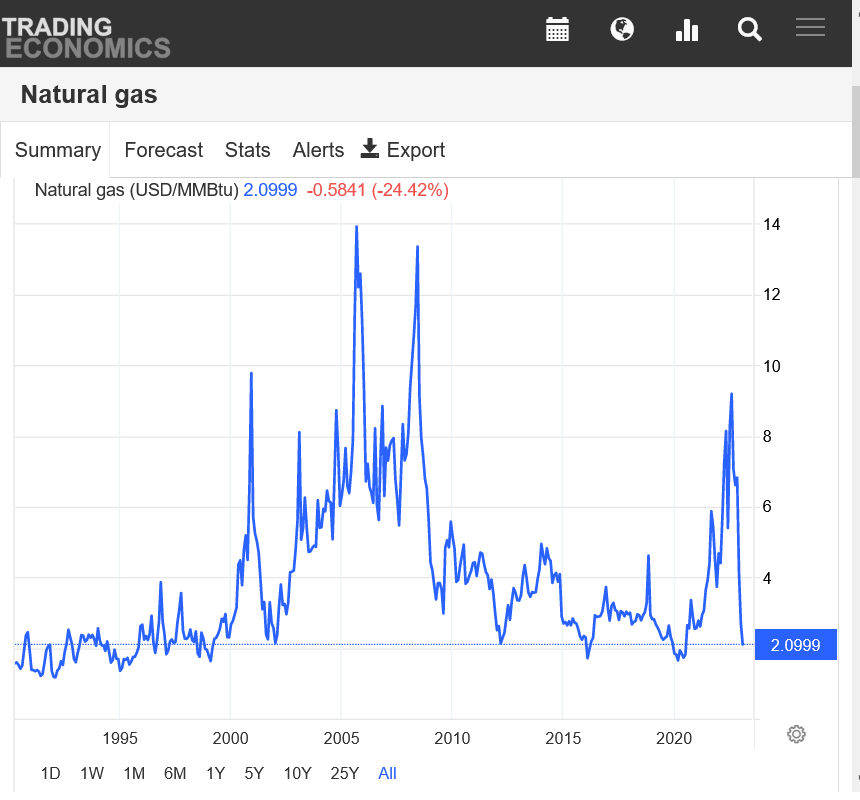
I get why you guys have done nothing but gamble buying/longs the last 2+ months here. So let's have a reality check with the price charts.
It's the shorts during that period that have become wealthy with one of the strongest moves in history, almost straight down for months.
Trying to catch the falling knife this yearin the midst of that has not been kind to the bulls.
Despite that, we really are in a great buying set up for me here, if the models do finally turn much colder(though wx's influence is questionable this late in the heating season)
https://tradingeconomics.com/commodity/natural-gas


Arctic Oscillation Index, North Atlantic Oscillation Index, Pacific North American Index.
AO drops hard with extremely wide spread. Favors high latitude air moving to mid latitudes.
NAO will be pretty -NAO, mainly from the Greenland block below.
Solidly -PNA, causes mid latitude opposition to the cold downstream over the East/Southeast, with upper level ridging in the Southeast more favorable.
https://www.cpc.ncep.noaa.gov/products/precip/CWlink/daily_ao_index/ao.shtml

https://www.cpc.ncep.noaa.gov/products/precip/CWlink/pna/nao.shtml

https://www.cpc.ncep.noaa.gov/products/precip/CWlink/pna/pna.shtml

++++++++++++++++++++++++++++++++++++++++++++
GFS ensemble mean anomalies at 2 weeks. Upper level ridge over Greenland looks like a Greenland block.
https://www.psl.noaa.gov/map/images/ens/z500anom_nh_alltimes.html 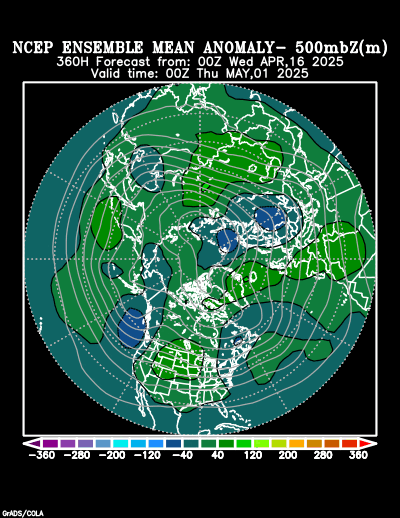
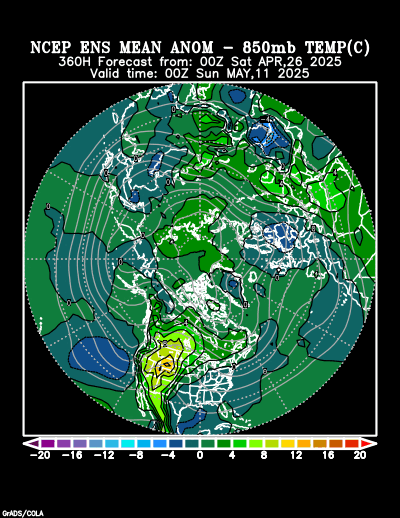
2 week 850 temp for ensemble mean anomaly. This is not cold yet for much of the high population, eastern US.
https://www.psl.noaa.gov/map/images/ens/t850anom_nh_alltimes.html
GEFS was +7 HDDs..........ignored by the collapsing market.
Russia’s yearlong – and ongoing – invasion of Ukraine sparked a reordering of global natural gas supply and demand, igniting record calls for U.S. exports of LNG and amplifying the enduring prominence of fossil fuels in the world’s energy mix. Domestic gas production climbed to record highs in response.
Another very bearish EIA coming up this Thursday. These were the temps:
https://www.cpc.ncep.noaa.gov/products/tanal/temp_analyses.php

Last weeks report:
https://www.marketforum.com/forum/topic/93014/#93164
Look at the unusually large drawdowns from last year that we will be comparing to the next 2 months.
https://www.marketforum.com/forum/topic/92520/#92588
| Release Date | Time | Actual | Forecast | Previous |
|---|
| Apr 28, 2022 | 09:30 | 40B | 38B | 53B | |
| Apr 21, 2022 | 09:30 | 53B | 37B | 15B | |
| Apr 14, 2022 | 09:30 | 15B | 15B | -33B | |
| Apr 07, 2022 | 09:30 | -33B | -26B | 26B | |
| Mar 31, 2022 | 09:30 | 26B | 21B | -51B | |
| Mar 24, 2022 | 09:30 | -51B | -56B | -79B | |
| Mar 17, 2022 | 09:30 | -79B | -73B | -124B | |
| Mar 10, 2022 | 10:30 | -124B | -117B | -139B | |
| Mar 03, 2022 | 10:30 | -139B | -138B | -129B | |
| Feb 24, 2022 | 10:30 | -129B | -134B | -190B | |
| Feb 17, 2022 | 10:30 | -190B | -193B | -222B | |
| Feb 10, 2022 | 10:30 | -222B | -222B | -268B | |
| Feb 03, 2022 | 10:30 | -268B | -216B | -219B | |
| Jan 27, 2022 | 10:30 | -219B | -216B | -206B | |
| Jan 20, 2022 | 10:30 | -206B | -194B | -179B | |
| Jan 13, 2022 | 10:30 | -179B | -173B | -31B | |
| Jan 06, 2022 | 10:30 | -31B | -54B | -136B |
In the last 20 years, NG has only traded lower than this a small % of the time.
The COVID low in March 2020 and previous major low on Feb 29, 2016 were quite a bit lower than this. We're below the significant Mar. 2012 low.
Then you have to go back to Jan 2002 and we're lower than that.
Not as low as Feb 1999, Feb 1997, Jan 1995 or Feb 1992 but prices in the 1990's, mostly stayed below $2.5, often all year.
However, we've never had this much ng supply gushing in and outside of the COVID extreme, never gained so much in storage in 6 months in history, maybe not even then either.
And we have at least 3 more EIA's with big gains in the surplus. And if it doesn't turn much colder in March, more than that.
However, note the dates of all 8 of those significant lows:
2 in Jan, 4 in Feb and 2 in March. 0 during the other 9 months.
spread between march and april and may ..keeps widening,,,,which means even if prices remain steady ..lomgs lose on roll overs
Thanks cc,
Yes, that's the way it usually works in super bear markets as you know. The bear spreads make money.
Back 20 years ago, I studied all the seasonals for each month and the spreads too with the highest probabilities.
The BACK months of NG always bottomed first/earliest, starting with June and May, then April. Those were high probability longs. NOT March and definitely NOT Feb, which was still forming a bottom in too many years.
And bear spreading early in the year, during this current time frame, even before the seasonal bottom was high probability.
So your comment suggests that buying those back months will lose more money on the roll over but actually those back months are your safest bet/least risky right now to be long.
Some of the seasonal bottoms in this time frame have been spikes lower just before contract expiration, just like this one. That's the current potential dynamic for March NG. The bottom could come at any time. In fact, this is probably it.
I highly doubt that the market will be able to push May or June much lower than this no matter what happens. Probably not April either.
There's plenty of options traders that will likely make alot of money selling puts for May and June down here.
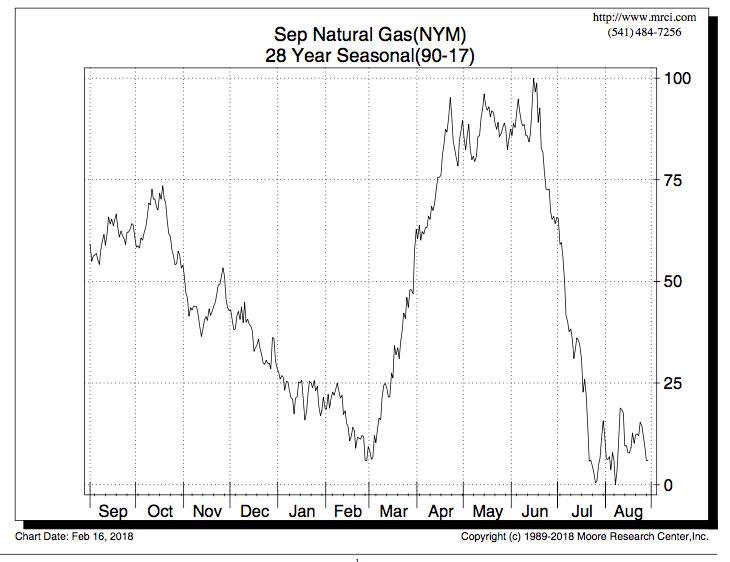
The chart above is an average over 28 years. Some years, the bottom occurs earlier (even January). Some years later, in March. A month from now, there's an extremely high chance, 90% or more that the lows will already be in based on seasonality.
March and April are by far the months most likely to feature rising NG prices. Mid March to Mid April is the epicenter in time for highest probably of the price going up, especially for the May and June contracts.
NGH spiked below $2!
GEFS -7 HDDs. NG continues lower.
EE -5 HDDs
Mike I completely get the dynamic and I also understand it This could be forging a bottom but I'm pointing out how difficult it is after you may have attempted to trade this all the way down unsuccessfully to pony up three points between March and May which is basically 15 pct That in itself discourages lungs
Thanks cc!
that instinctive psyche is counterproductive to success in this environment.
wanting to buy the much cheaper, front month and pass on the higher priced back months because the trader is thinking about relative value when the market is trading TIME.
the dynamics of ng fundamentals become increasingly bullish with TIME, especially after March expires in late Feb, which is the reason for the much higher price.
the extreme reliability of this playing out at the end of every Winter becomes a self fulfilling prophesy.
bulls want to put their money on the contracts trading bullish fundaments. The front month is still trading bearish weather and the extremely bearish increase in storage bs previous years And even shedding remaining risk premium from Winter Threats.
the back months are focusing on the need to refill storage for NEXT Winter and the upcoming Summer and the extremely reliable seasonal pattern.
as such, the spread between the cheaper front month and more expensive back months will increase, instead of converge as is often the case for most markets.
that is not the case when the front month, March has a v shaped bottom ahead of expiration, which could be the case right now.
when that happens, the front months will always have the greatest change And it will be positive.
++++
to be honest, when I was a big trader I was done trading ng on weather at this time of year.. too late in the season to matter and too many times the market ignored it.
the market knows the rapidly dwindling impact that sustained cold will have. Especially when it’s a POTENTIAL pattern change to colder which fires up SPECULATORS. They don’t have much impact when the market is trading 1 bird in hand and ignoring the 2 birds in the bush potential.
The timing and price spike price just below $2 on the front month overnight would look pretty sweet on the charts if we can reverse and close higher today.
the back months have all solidly reversed higher. But it’s erly
My long is April and now profitable
The just out 12z EE was -6 HDDs bearish. Weather is definitely NOT what caused todays reversal.
GEFS about the same.
This is finally the best signal that THE low is in for a long time for all the contracts past March but we need to get past expiration of the March to lessen the threat for another spike lower(which is unlikely to make a new low in the back months).
Natural gas futures strengthened midweek as the ramp-up of full operations at a key export facility combined with the potential for March cold to support the market. With technical trading likely aiding the rally, the March Nymex gas futures contract settled Wednesday at $2.174/MMBtu, up 10.1 cents on the day. April futures climbed 12.1 cents…
++++++++++++++++++
Not much to add. The just out 18z GEFS was -3 HDDs. This powerful reversal, especially on the back months was probably not from a major weather pattern change to colder in the high population density, big ng residential demand areas of the East......during the higher confidence next 2 weeks on most model solutions/ensembles.....though there are signs that we will finally get colder.
Might we finally turn colder in the 2nd half of March? Sure, there is always uncertainty that far out some models have been suggesting much colder for week 3 since early February.........and been wrong. I think we WILL finally turn colder in late week 2 and week 3.
We'll have run out of Winter by then!
It's delusional to think that late March cold will have much impact on supplies in a market that has turned a deficit to a surplus by the greatest 6 month positive change in history.
The market had a selling exhaustion over night based on those extremely bearish fundamentals hammering the market for 6 straight months, dropping the price 80% during that period, from almost $10 to below $2 for the current front month!!!! Wow!
+No assurance that the low is in for the front month with it expiring in a few days. Very likely-90%? that it is for the back months.
Still no cold in the east, thru 2 weeks.
we’ve run out of Winter waiting for it!
gotta love these guys....sell it off on the close yesterday /well off high//have it lower on forecasts this am and then boom lol
Volume on the April is now 6 times vs March.
Analysis: -71 BCF = A tiny bit more than estimates?
2023 storage is now a whopping +395 BCF vs last year(there was a deficit of 300+ last September) This has to be a record
2023 is now a whopping +290 BCF vs the 5 year average and must be close to the highest ever for this date. Larry would know.
This is also why prices close to the lowest in 20 years(other than a few brief spikes lower than this)
for week ending February 17, 2023 | Released: February 23, 2023 at 10:30 a.m. | Next Release: March 2, 2023
| Working gas in underground storage, Lower 48 states Summary text CSV JSN | |||||||||||||||||||||||||
|---|---|---|---|---|---|---|---|---|---|---|---|---|---|---|---|---|---|---|---|---|---|---|---|---|---|
| Historical Comparisons | |||||||||||||||||||||||||
| Stocks billion cubic feet (Bcf) | Year ago (02/17/22) | 5-year average (2018-22) | |||||||||||||||||||||||
| Region | 02/17/23 | 02/10/23 | net change | implied flow | Bcf | % change | Bcf | % change | |||||||||||||||||
| East | 479 | 498 | -19 | -19 | 402 | 19.2 | 427 | 12.2 | |||||||||||||||||
| Midwest | 575 | 601 | -26 | -26 | 457 | 25.8 | 490 | 17.3 | |||||||||||||||||
| Mountain | 106 | 114 | -8 | -8 | 106 | 0.0 | 108 | -1.9 | |||||||||||||||||
| Pacific | 108 | 122 | -14 | -14 | 176 | -38.6 | 187 | -42.2 | |||||||||||||||||
| South Central | 926 | 931 | -5 | -5 | 660 | 40.3 | 693 | 33.6 | |||||||||||||||||
| Salt | 262 | 262 | 0 | 0 | 169 | 55.0 | 197 | 33.0 | |||||||||||||||||
| Nonsalt | 664 | 670 | -6 | -6 | 491 | 35.2 | 496 | 33.9 | |||||||||||||||||
| Total | 2,195 | 2,266 | -71 | -71 | 1,800 | 21.9 | 1,906 | 15.2 | |||||||||||||||||
Totals may not equal sum of components because of independent rounding. | |||||||||||||||||||||||||
Working gas in storage was 2,195 Bcf as of Friday, February 17, 2023, according to EIA estimates. This represents a net decrease of 71 Bcf from the previous week. Stocks were 395 Bcf higher than last year at this time and 289 Bcf above the five-year average of 1,906 Bcf. At 2,195 Bcf, total working gas is within the five-year historical range.
For information on sampling error in this report, see Estimated Measures of Sampling Variability table below.

We blew up the Nordstream pipeline..........then sold them extra gas/made them more dependent on US LNG at a higher price for us because of that terrorist act taking natural gas off the market.
"NICE" rally, mostly after settlement (but not yet closed).
Doubt weather has anything to do with rally. Most likely a 'release' of short pressure due to shorts unwinding before tomorrow expiration of March contract.
Million dollar questions: Do shorts reenter to sell April? Will April test March's low? Will April test April's low?
STOPPED out when ngj made a new low after 730am up 2000
Congrats tjc!
++++++++++++++++++
Week 2 models are interesting. The AO is no longer solidly negative and closer to 0 as in previous days (very wide spread) and the NAO increases back closer to 0. Both those are LESS favorable to high latitude cold to shift to mid latitudes.
However, contrasting with that.
The Greenland block positive anomaly has shifted west and is connecting westward to a new, extensive, elongated strong positive anomaly across all of extreme Northern Canada, Alaska to the Northeast Pacific.
This growing new positive anomaly is helping to shift the -PNA to a LESS negative value/phase which should help reduce the resistance to cold in the East that the solidly -PNA regime is causing in the mid latitudes.
This could lead to the Southeast Ridge breaking down and really allowing the cold to go much farther southeast.
So less forcing for cold from the -NAO/-AO but BETTER for the a less negative/-PNA which modulates mid latitudes more. This equates to much more HDDs overall and deeper penetration of cold in week 2 but the intensity of the cold might be less along the northern tier.
https://www.marketforum.com/forum/topic/93288/#93298
NGH is expiring today though and for the few days ahead of that, there can be spikes in either direction that fight the actual fundamentals or technicals.
12z GEFS was +5 HDDs vs the previous run and +11 HDDs vs the 0z run.
EE was +6 HDDs vs the previous 0z EE.
NG made a major reversal up on Wednesday(new low for the move-higher close) that was solidly confirmed today.
In addition, NG made an extremely powerful weekly reversal higher this week, closing $2,000+ higher for the week.
March expired today which sometimes messes up signals and that caused me to wait until after the close and March went off the board to put in my buy orders...which never got filled because I was at chess practice the last 90 minutes.
Closing on the highs today, leaves us in a position to gap higher on Sunday Night.
Interesting that the falling knife catchers for weeks don't seem interested in being long here when we finally confirm lows with legit signals.
The weather is finally becoming more favorable too after being bearish since December. However, this will be well into March at a time of year when it's physically impossible to have impactful drawdowns, especially in a regime with record supplies gushing in for 6 months. Also, we still have some pretty big drawdowns from 2022 to compare with the next few weeks.
https://www.marketforum.com/forum/topic/93288/#93302
++++++++++++++++++
https://www.cpc.ncep.noaa.gov/products/predictions/WK34/

But with seasonals turning extremely positive in March, this will put a halt to the continuous pressure from bearish weather which has led to the biggest change in history from a deficit to a surplus for such a short period.
It should greatly enhance the positives(exports will be ramping up)
A little resistance just above this level but looking extremely positive for the bulls and for a significant low to be in.
https://tradingeconomics.com/commodity/natural-gas
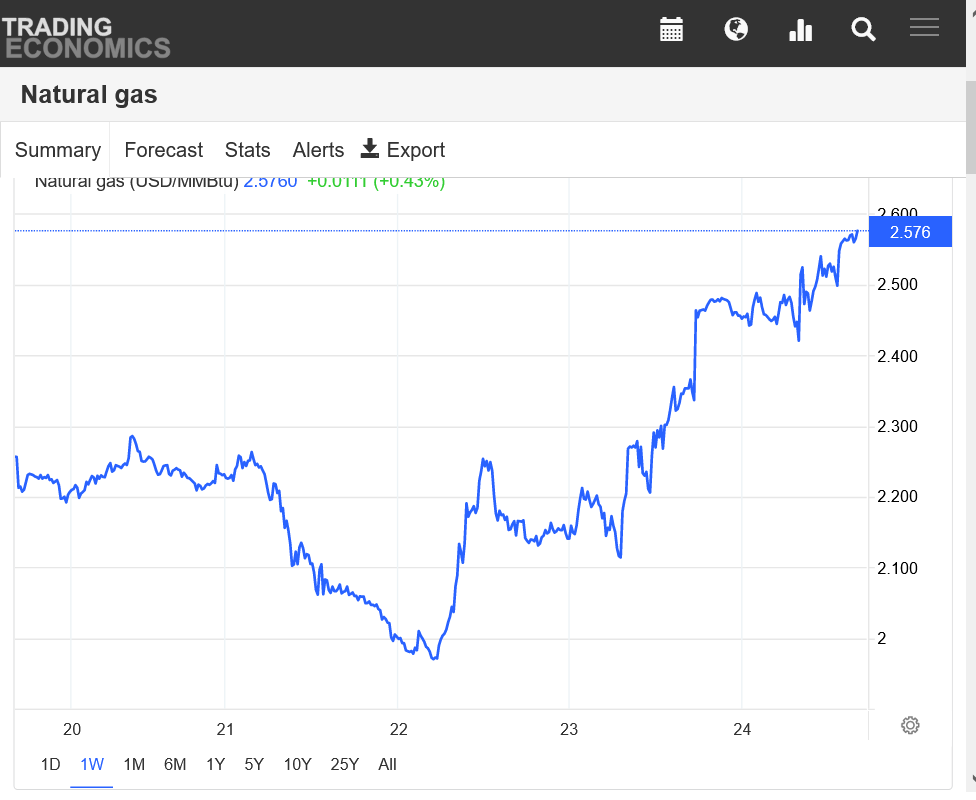
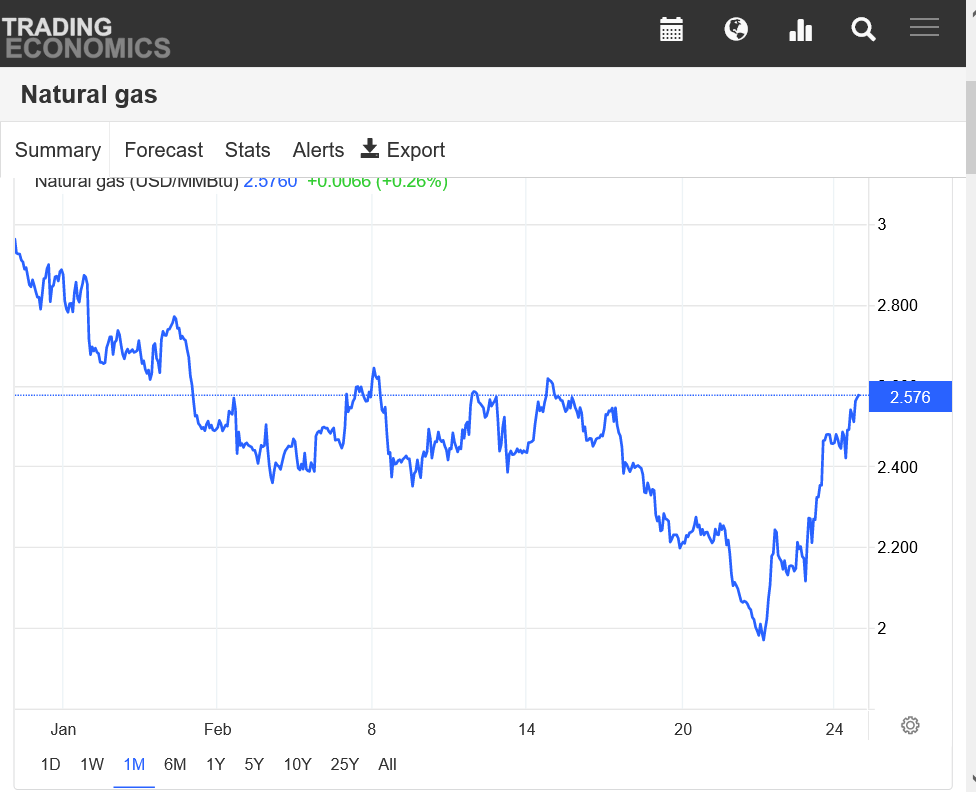
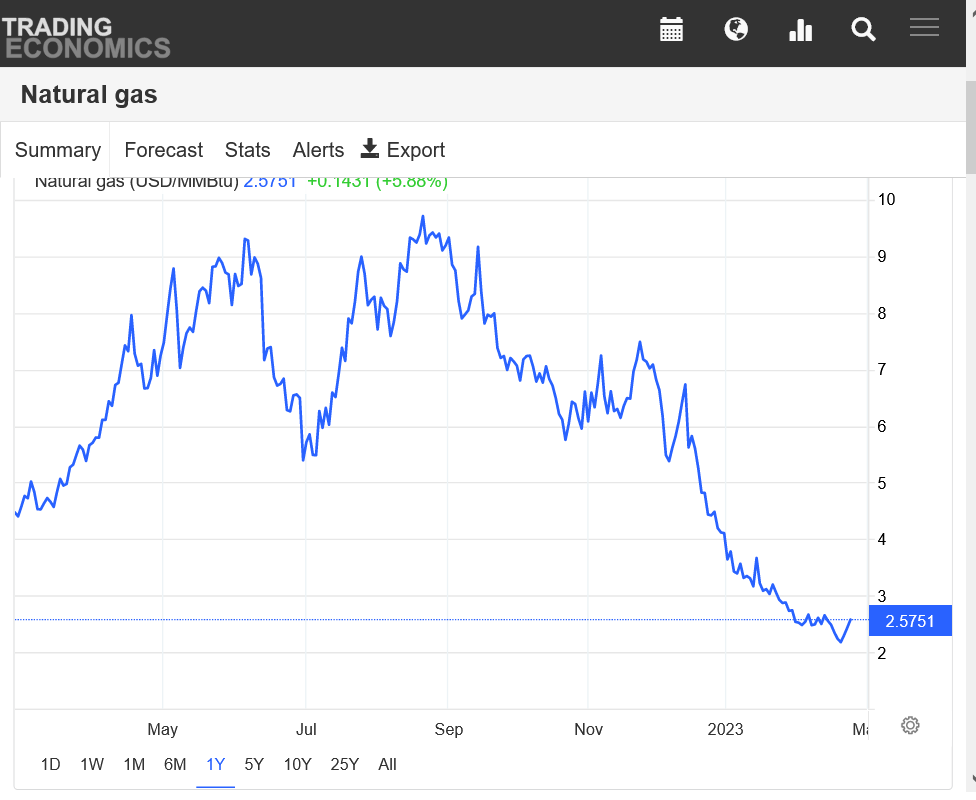
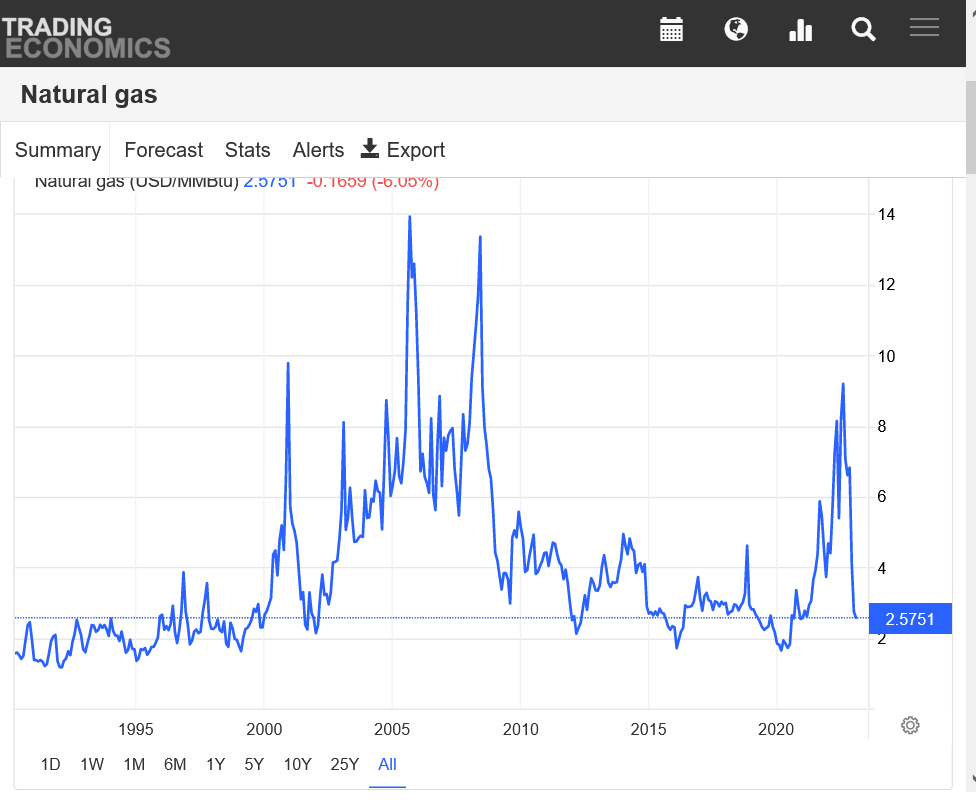
MetMike and others
Having sweated and margined for days, it seemed prudent, to me, to not allow the Thursday surge to evaporate on Friday. Thus, I placed a stop on the then current low of the day at 630am cst. Sure enough, stop was hit for a new low which would have 'only' resulted in another $200 drawdown. Rebound was significant AND (as Mike suggests) the potential for a breakaway gap Sunday night does now exist! ($1000 left on table)
I prefer to 'see' the potential for the 3 day rule---3 days after a high/low a market will test that high/low. Since the low was made Wednesday, one would wait for a test of the low on Monday (Sunday night) to buy. Accordingly, I will be a buyer NGJ 2.20ish
I will NOT buy a potential breakaway gap opening. In fact, I might fade the same.
Further, human psychology tells me the shorts WILL try another assault on this rebound.
Lastly, weather no longer much of a factor; rather supply v. export(European) demand and 'restocking' inventory.
Hi tjc,
I would have done the same thing, especially with NGH expiring on Friday.
We appreciate your sharing here too.
I'm in no hurry to get long here.
The last 12z EE was a whopping -18 HDDs!
The AO is only slightly negative vs previous forecast for deeply negative. Very wide spread for the AO.
The Greenland block filling and a new high latitude positive anomaly is forming in the Northeast Pacific. This is causing the -NAO to move towards 0 in week 2.
The PNA remains solidly -PNA, though climbing a tad at the end of 2 weeks.
So still some cold resistance in Southeast from the mid latitudes.
This will be an interesting open.
I thought a beak away gap higher late Friday and yesterday but the weather has taken a less bullish turn today.
We got the expected gap higher but now we find out if it holds as a break away gap or gets filled and is a gap and crap.
My posts in this thread from earlier apparently got lost.
NG continues higher, even when guidance comes out bearish, confirming last week low and that weather doesn't matter much.
This just updated EE was a bearish -11 HDDs with less HDDs from the get go but the market pretty much ignored it.
The -AO and -NAO are less favorable than the last 2 weeks from high latitude dynamics to bring cold in but the increasing -PNA is more favorable in the mid latitudes.
Despite these indices, the actual weather maps/pattern do show some modest cold, especially in week 2, even though its not enough to make a big difference with the very bearish storage dynamic, especially well into March when residential heating demand is rapidly tapering off.
+++++++++++
Weather doesn't look that supportive to me, considering how cold it would need to be getting COLDER, not milder as the forecasts have been for the last couple of day now. Both the AO and NAO now increase just above 0 at the end of 2 weeks.
However, the PNA climbs close to 0 which will help the cold push in the mid latitudes push south.
The Greenland block has completely dissipated, which eliminates that as a source of high latitude cold for the East. The new high latitude positive anomaly in the Northeast Pacific may couple with a downstream negative in the West/Central, in order to serve as a mechanism for cold air delivery into the Western/Central US.
There's little doubt in my mind that a colder 12Z Euro suite was the main reason for a sharp rise in NG this afternoon. I don't know the HDD increase, but Mike would know. From 12:20 PM to 1:45 PM CST, it rose a whopping 6% (15 cents)!
The lagged effects of a major SSW usually don't start affecting the troposphere greatly, if it is going to do so, until 10-14+ days later. The mid Feb major SSW's first major effect on the troposphere was a sharp drop in the NAO to solidly negative starting yesterday, which is ~11 days after the Feb 16th peak in the warmth. It brought the strat winds at 10 mb at 60N way down to -13 m/s on Feb 18th.
Furthermore, the last two days the winds dove again and this time plunged to an impressive -18 to -19 m/s today! That likely means that the SPV is now at about its weakest in terms of those winds during winter since the major SSW of Feb of 2018!
A very weak SPV that downwells into the troposphere makes it much easier than normal for cold air to drop south into the middle latitudes. Thus, even when realizing March will start off mild in the E US overall, March will very likely be nothing like Feb as a whole there! Many E US areas could have a colder March than both Feb and Jan!
NG had a huge recovery, starting more than 2 hours before the EE started coming out and the recovery had nothing to do with changes in weather, except for possibly being the reason for the heavy losses early from weather that was MORE bearish today compared to the previous few days.
In fact, the -NAO/-AO forecast bottomed out and looked the most bullish at the end of last week/over the weekend.
Today they increase to 0/neutral at the end of 2 weeks.
https://www.marketforum.com/forum/topic/93288/#93298
Also, the coldest run of the 360 map EE was 36 hours ago, 0z-27th.
Here's the 850 temps for that run below, compared to this last milder run, 12z-28th run-2nd map.
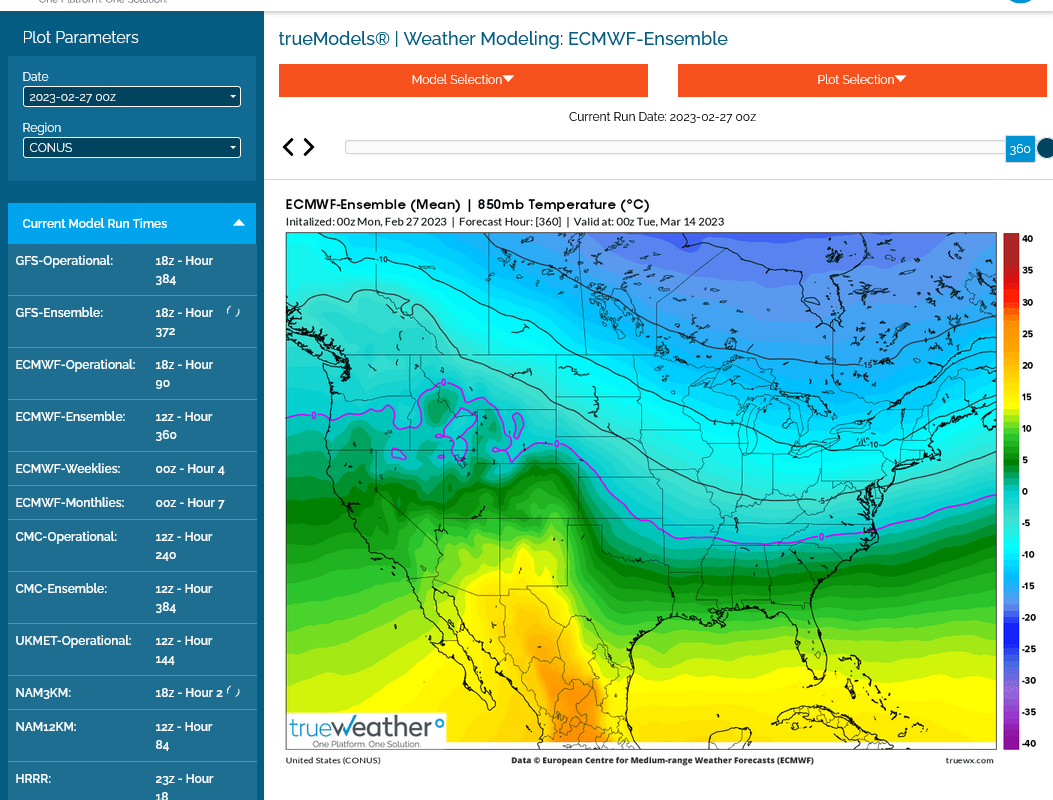
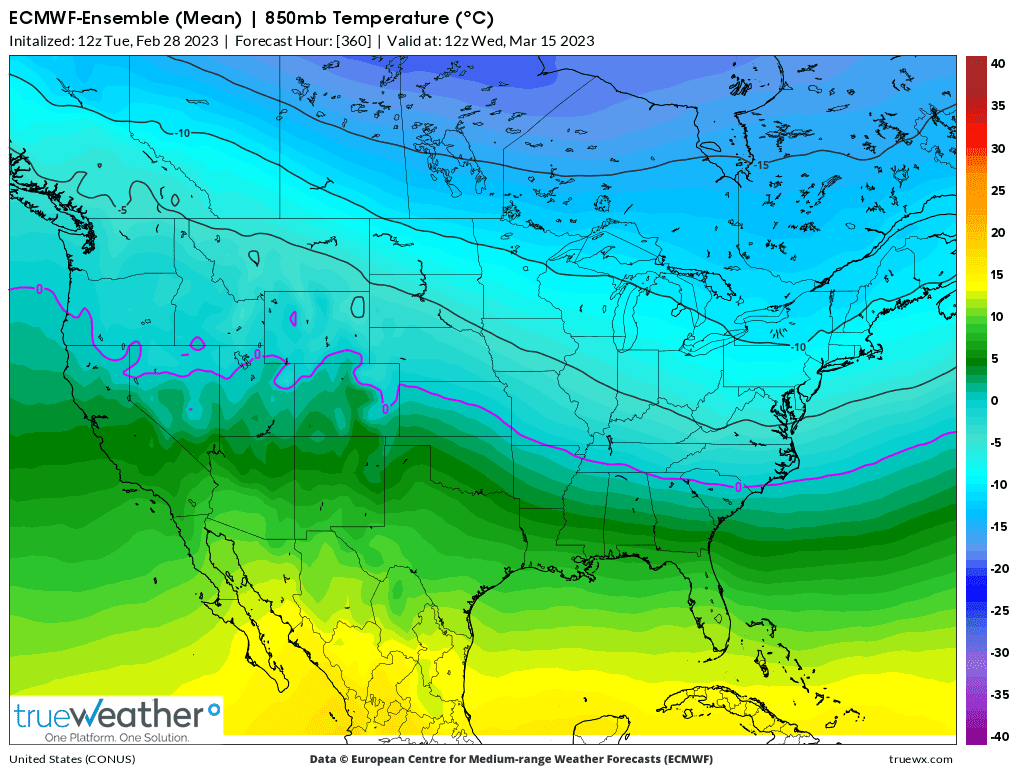
Also, there were 4 colder days in the EE forecast and they were near the END of the run, when almost the entire move up was over. After those 4 colder days came out, NG was basically unch for the last 2+ hours of trading
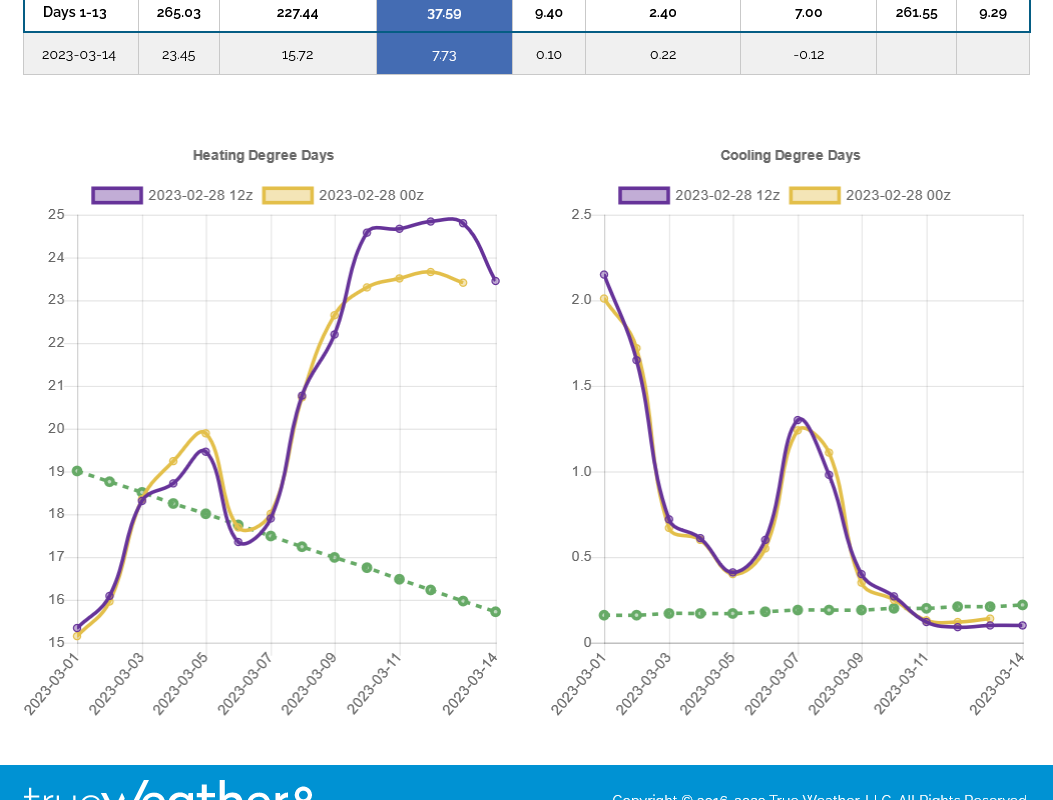
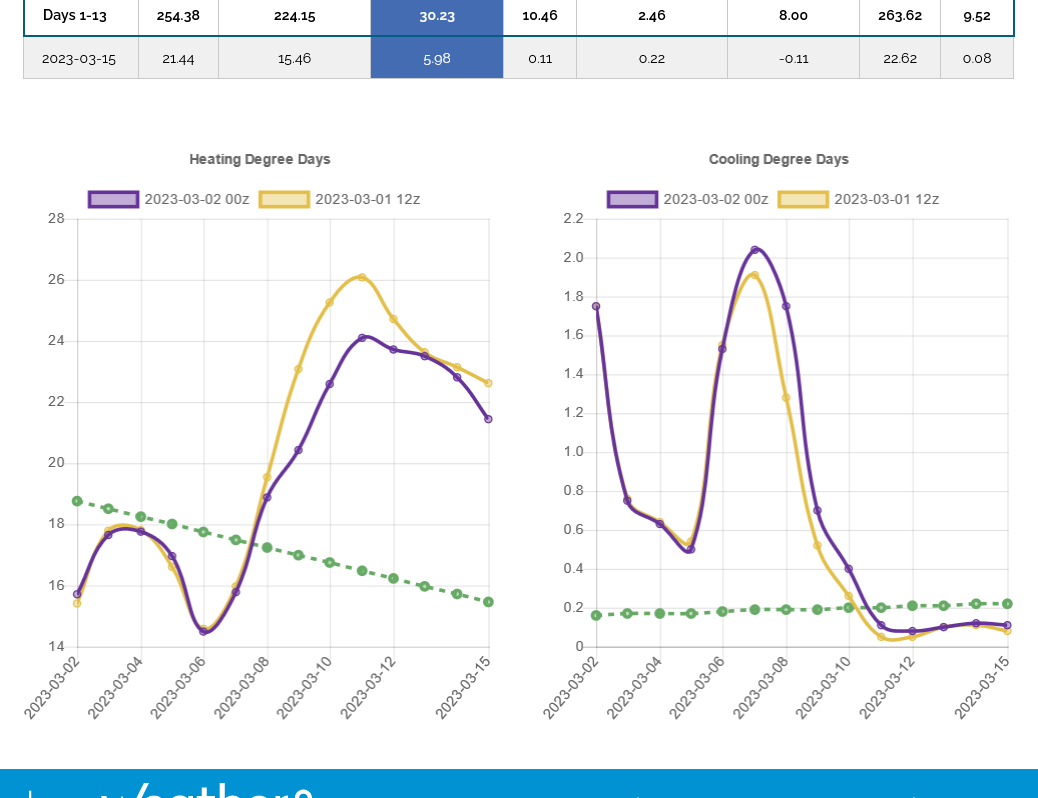
Here's the HDD data from the GEFS.
Note that while the entire rally was occurring late this morning, the 12z GEFS was coming out -4 HDDs bearish vs it's previous run. This last one 18z is down another -7 HDDs so the weather is getting LESS bullish......but natural gas is still higher and in fact making new highs........ so quite obviously it's not trading weather.

Thanks, Mike, for clearing that up about this afternoon. I guess it is too late in the season for wx to have a great impact since inventories are so high.
It's a good thing I'm not trading because I probably would have tried to buy some cheap OOM calls around Feb 10th as per my post. Had I then gotten filled, I would have lost. NG was ~steady the next 3 days meaning immediate loss of time value. Then NG fell most days through the day before expiration. The best case scenario would have been my buying at the bid and then selling within a couple of days at a small loss. But I bet I would have held longer.
Today's NAO of -0.9 was the most negative in February since February 28th of 2018, which was 16 days after the 2/12/2018 major SSW! As recently as just 11 days ago, the GEFS mean had today's NAO only down to zero with runs a couple of days earlier still positive for today.
Also, it wasn't but 4 days ago that the GEFS didn't have the AO go negative the entire run! The point is that the models were slow to see this blocking, which was one of my original points illustrating the much increased difficulty the models have with the troposphere starting near day 10 vs the much easier to forecast strat out several weeks.
Looking ahead: with today's renewed plunge (to -18 or -19 m/s) of the 60N winds at 10 mb, folks shouldn't assume that the NAO, AO or anything else is anywhere near set in stone once looking in week two, especially after day 10.
Thanks much for sharing that, Larry,
I had an order to buy Friday afternoon after the day close(wanted to wait until March expired) just below where we were trading then and was at chess practice after 2pm or probably would have bought on the close. So I missed it.
We gapped higher Sunday Night, then filled the gap, then the 0z EE came out pretty cold and I tried to buy 30 seconds too late(you know how those spikes are when guidance is coming out) then cancelled it.
Then, the market went back lower than where I wanted to buy vert early Monday, then it shot higher. and had a very strong day.
Then we gave back most of the gains overnight Mon and very early Tuesday......then shot back up again after mid morning and are holding those gains.
It's almost impossible to trade here because of the gyrations and how late in the year, along with robust supplies but it seems extremely likely that the lows are in for a very long time.
+++++++++++++++++++++++
https://tradingeconomics.com/commodity/natural-gas
There doesn't look to be much price resistance for awhile going up.

Another seasonally small withdrawal is expected on Thursday at 9:30pm. However, the Pacific region is very low and will drop more!
https://www.marketforum.com/forum/topic/93288/#93368
https://www.cpc.ncep.noaa.gov/products/tanal/temp_analyses.php

++++++++++++
Not much weather in the trading. Colder temps ahead but not as cold as models were over the weekend.
The -AO continues to trend in the stronger direction on the 12Z EPS and other models. I wouldn't be surprised if this continues. I suspect this is because of the very weak SPV. The 10 mb winds at 60N dipped all of the down to -19 m/s yesterday, indicative of a very weak strat. A strong -AO along with a -NAO is a primary effect of a successfully down-welled weak strat onto the troposphere.
GEFS based AO forecasts for March 6th: trend is downward:
2/26 run: -0.1
2/27 run: -0.5
2/28 run: -1.3
3/1 run: -1.5
For March 10th, yesterday's GEFS had 0. Today's had -0.9.
The 12Z EPS has a stronger -AO through most of its run through March 14th and that continues its trend since the 0Z 2/27 run.
Thanks Larry!
the 12z EE was down another -8 HDDs after shaving off -2 HDDs on the 0z run 12 hours earlier.
No bearish reaction by the market.
You're welcome, Mike.
The trend toward a stronger and longer -AO period during the first half of this month (likely due to the lagged effects of a very weak and displaced SPV) continues with today's 0Z update:
0Z GEFS based AO forecasts for
March 6th:
2/26 run: -0.1
2/27 run: -0.5
2/28 run: -1.3
3/1 run: -1.5
3/2 run: -1.9
For March 10th:
2/28 run: 0.0
3/1 run: -0.9
3/2 run: -2.0
Also, the EPS has continued its downward trend of the AO since its 0Z 2/27 run.
Thanks, Larry!
That makes sense for the models to not completely dial in this event in the earliest stages because it's so unusual. The more extreme an event, the worse the models do(which are based on physics that were used to define the vast majority of events playing out, especially when they dial in climatology towards the end).
Here's a graphic display of the AO, NAO and PNA.
All of them solidly negative, as you noted and all of them forecasted to head back close to 0 at the end of the period. We continue to note the extremely wide spread for the AO.
Also, the PNA FINALLY increasing will allow the cold in the West/Midwest to push southeast without the resistance and without the huge ridge in the Southeast, which will be completely obliterated.
Since this is a futures market that trades future weather and the weather has become LESS bullish this week, the strength this week has little to do with weather known a week ago.
https://www.marketforum.com/forum/topic/93288/#93298
The EE continues to be LESS cold and more bearish, losing another -9 HDDs on the last 0z run compared to the previous 12z run.
However, with NG having solidly confirmed its seasonal bottom last week, it's going to be tough to see a sustained push lower.
for week ending February 24, 2023 | Released: March 2, 2023 at 10:30 a.m. | Next Release: March 9, 2023
-81 BCF bearish vs average but expected
| Working gas in underground storage, Lower 48 states Summary text CSV JSN | |||||||||||||||||||||||||
|---|---|---|---|---|---|---|---|---|---|---|---|---|---|---|---|---|---|---|---|---|---|---|---|---|---|
| Historical Comparisons | |||||||||||||||||||||||||
| Stocks billion cubic feet (Bcf) | Year ago (02/24/22) | 5-year average (2018-22) | |||||||||||||||||||||||
| Region | 02/24/23 | 02/17/23 | net change | implied flow | Bcf | % change | Bcf | % change | |||||||||||||||||
| East | 451 | 479 | -28 | -28 | 363 | 24.2 | 390 | 15.6 | |||||||||||||||||
| Midwest | 544 | 575 | -31 | -31 | 411 | 32.4 | 446 | 22.0 | |||||||||||||||||
| Mountain | 99 | 106 | -7 | -7 | 97 | 2.1 | 100 | -1.0 | |||||||||||||||||
| Pacific | 99 | 108 | -9 | -9 | 166 | -40.4 | 176 | -43.8 | |||||||||||||||||
| South Central | 922 | 926 | -4 | -4 | 625 | 47.5 | 660 | 39.7 | |||||||||||||||||
| Salt | 261 | 262 | -1 | -1 | 164 | 59.1 | 187 | 39.6 | |||||||||||||||||
| Nonsalt | 661 | 664 | -3 | -3 | 461 | 43.4 | 473 | 39.7 | |||||||||||||||||
| Total | 2,114 | 2,195 | -81 | -81 | 1,663 | 27.1 | 1,772 | 19.3 | |||||||||||||||||
Totals may not equal sum of components because of independent rounding. | |||||||||||||||||||||||||
Working gas in storage was 2,114 Bcf as of Friday, February 24, 2023, according to EIA estimates. This represents a net decrease of 81 Bcf from the previous week. Stocks were 451 Bcf higher than last year at this time and 342 Bcf above the five-year average of 1,772 Bcf. At 2,114 Bcf, total working gas is within the five-year historical range.
For information on sampling error in this report, see Estimated Measures of Sampling Variability table below.
 +++++++++
Look at the blue line. We're now at a record for surplus vs last year=+451 BCF and the 5 year average +342 BCF.
But the market knew this at the end of Feb. when we briefly spiked to the 2nd lowest prices in the last 20 years and made our seasonal low.
Utilities pulled 81 Bcf of natural gas from storage for the week ended Feb. 24, the U.S. Energy Information Administration (EIA) reported Thursday. The result proved slightly steeper than forecasts but anemic relative to averages, driving Nymex natural gas futures into the red. Ahead of the 10:30 ET release, the April futures contract was essentially…
++++++
From earlier:
12Z GEFS is significantly colder in the E US even though the much oversupplied NG may not care that much this late in the season.
Larry,
The GEFS was actually MILDER, not colder than the previous run, even though there were 6 days of it being colder in the East..........followed by a pattern change to much milder at the end of the period from the zonal, mild Pacific flow regime, which kicks in much earlier across the rest of the country and reaches the East last.
This last 12z GEFS was -4 HDDs vs the previous 6z run but it was +4 vs the run before that one.

The Canadian ensembles also go mild/zonal at the end of the period
https://weather.gc.ca/ensemble/charts_e.html?Hour=384&Day=0&RunTime=12&Type=gz

The European operational model came out MUCH colder!
EE +5 HDDs.
In the 2nd week of March, +5 HDDs means almost nothing.
Mike,
Regarding the 12Z GEFS, I didn't focus on the more unreliable end of run. I was focusing on how much colder it is in the E US around 3/9-12. It may very well be the coldest run yet in the SE for then.
Hey Mike,
You're welcome. Well, it turned out that the GEFS and other models have since trended much warmer for that period in the E US! However, that wouldn't be due to the AO/NAO as per the following
0Z GEFS based AO forecasts still trending lower for Mar 6th and 10th though at a slower pace as we get closer (NAO has remained about steady for that period with a solid negative):
For March 6th:
2/26 run: -0.1
2/27 run: -0.5
2/28 run: -1.3
3/1 run: -1.5
3/2 run: -1.9
3/3 run: -2.2
3/4 run: -2.3
For March 10th:
2/28 run: 0.0
3/1 run: -0.9
3/2 run: -2.0
3/3 run: -2.1
3/4 run: -2.4
12z EE -13HDDs
18z GEFS. -7HDDs
The concern for cold lovers in the SE US, which I think is valid, is that the EPS runs from Feb 27th through 0Z March 3rd were mainly cold in the SE early on March 11th after turning colder on March 10th. But since the 12Z March 3rd run, they've been near normal or warmer for March 10th through early on March 11th. The latest EPS runs don't get it cold til either later on March 11th or on March 12th. So, a 1-2 day delay.
The GEFS was slower to consistently make it cold by then but became that way by the March 1st runs with colder by March 10th. The GEFS' coldest runs were 12Z/18Z of March 2nd. The March 3rd runs were not as cold but still on the cooler side for early on March 11th. Then they suddenly became much warmer (mainly AN) starting with the 0Z March 4th run and have been that way since. The most recent GEFS runs don't make it cold til either March 12th or 13th, a longer delay than the EPS...2-3 days.
Is this another kicking the can or just a little delay? Any educated guesses? We'll know eventually. Aren't forecasting discussions fun? ![]()
For those interested, go to Tropical Tidbits and look at the E US maps valid for 6Z on March 11th on the Feb 27th through 0Z/6Z of March 5th runs and see for yourselves as they're still there.
Thanks Larry!
0z EE lost another -9 HDDs overnight.
The peaking -AO has consistently been predicted to increase, now becoming a +AO regime in mid March, with more zonal flow flushing out the cold late this month.
-NAO, same thing. Increasing to near zero.
Increasing -PNA to near 0, which had recently caused cold resistance downstream in the southeast(with an upper level ridge) will cause cold ASSISTANCE in the southeast.
https://www.cpc.ncep.noaa.gov/products/precip/CWlink/daily_ao_index/ao.shtml

https://www.cpc.ncep.noaa.gov/products/precip/CWlink/pna/nao.shtml

https://www.cpc.ncep.noaa.gov/products/precip/CWlink/pna/pna.shtml

++++++++++++++
Analysis below:
Current 500 mb map. The cold from the impressive Greenland block/high latitude positive anomaly from the SSW last month has not been allowed into the Southeast because of the -PNA and upper level ridge in the Southeast.
Cold HAS been able to dominate out West and especially in other mid latitudes regions on the other side of the Northern Hemisphere because of the high latitude forcing pushing Arctic air to mid latitudes in THOSE locations......but NOT the Southeast.
https://www.psl.noaa.gov/map/images/ens/z500anom_nh_alltimes.html
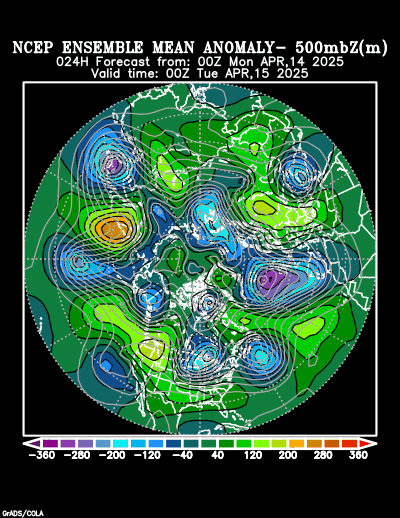
10 days out:
The -PNA regime breaks down out West, along with ending the long lived Southeast ridge, which temporarily flips to a trough(enhancing the movement of the cold to the southeast) which allows that cold pool in the West to finally shift southeastward bodily and with gusto.
This leads to a transient pattern, with an initial spike of several significant cold days in the East, which then reverts to blended zonal, west to east flow mixed with modest cold from Canada. So moderate cold by late March standards.
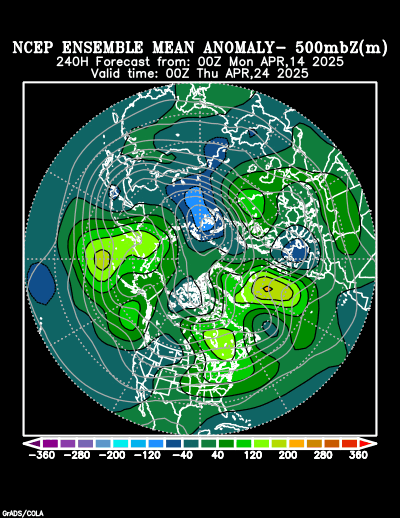
2 weeks below:

thanks, Mike.
I see nothing on the 12Z 3/5 runs that would likely be encouraging for SE US cold lovers. This is especially compared to some of the really nice much colder runs of 3/2-3. It is almost as if the 3/2-3 runs were troll runs lol. The Euro is especially noteworthy to me with this reversal.
12Z 3/5 Euro run goes all of the way to 12Z on 3/15 and coldest it gets through entire run is middle 30s in ATL and RDU. The 3/3 runs, which only went through 3/13, were well down into the 20s at those locations.
Yep,
That's what the EE has been showing all weekend.
12z GEFS was a whopping -14 HDDs.
Sat am 12z EE was -13 HDDs, then 0z Sun was -9 HDDs and this 12z run is also coming out MUCH milder.
I'll guess another -10 HDDs.
Hey Mike,
Thanks. Where did the 12Z EE end up?
Here are the coldest mean lows for each EE run back to the 2/28 0Z run for RDU/ATL, which shows why it is a bad trend for SE cold lovers:
2/28 0Z: 35/36 on 3/13-14
2/28 12Z: 34/34 on 3/14-15
3/1 0Z: 31/30 on 3/12 (coldest tied)
3/1 12Z: 32/31 on 3/12-13
3/2 0Z: 35/36 on 3/14-15
3/2 12Z: 32/31 on 3/13
3/3 0Z: 31/30 on 3/12-13 (coldest tied)
3/3 12Z: 31/31 on 3/13-14
3/4 0Z: 31/31 on 3/13-14
3/4 12Z: 33/34 on 3/13-15
3/5 0Z: 33/36 on 3/13-14
3/5 12Z: 35/37 on 3/14 (warmest run)
This is a double whammy because we're now the closest to the crucial dates of 3/12-15 and the coldest means instead of cooling further, which would be expected on an ensemble with 51 members when getting closer if there's big cold coming, have warmed considerably.
The last 12z EE was down another -18 HDDs.
As one would expect with one of the biggest losses in HDDs that I can remember.... for sure the biggest in March......we opened sharply lower.
Not a daily gap below Friday's low but the follow thru after the open has taken us below Friday's low.
The 2nd chart below is misleading since its a continuous price chart.
A month ago, we were trading the March NG which was much lower than the April.
The last week at the top is a more solid indicator.
https://tradingeconomics.com/commodity/natural-gas
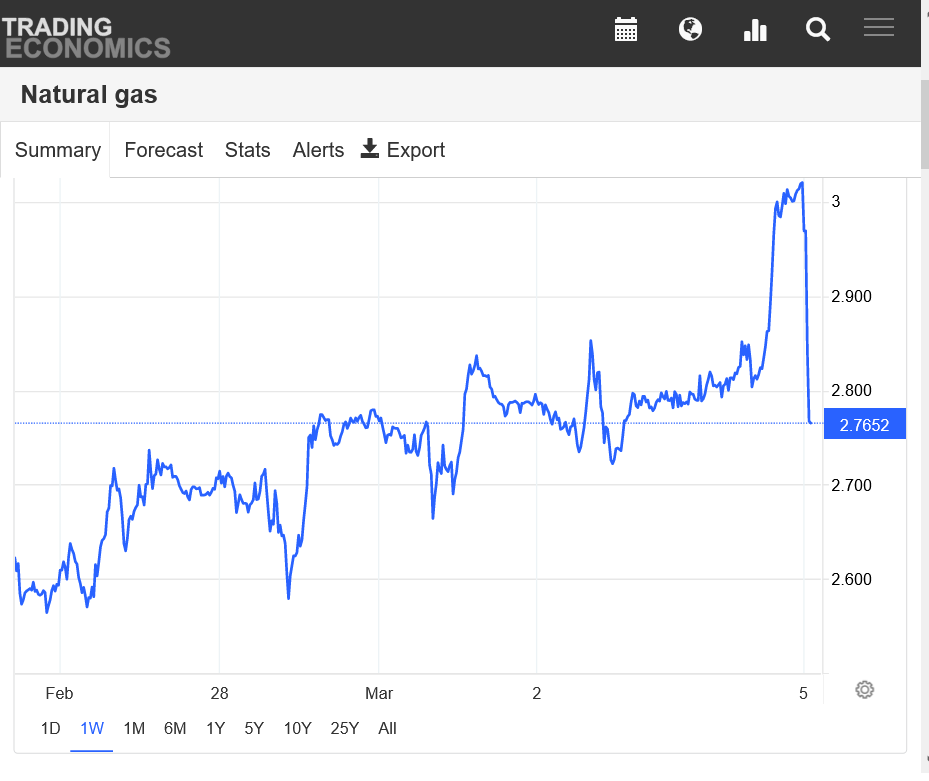
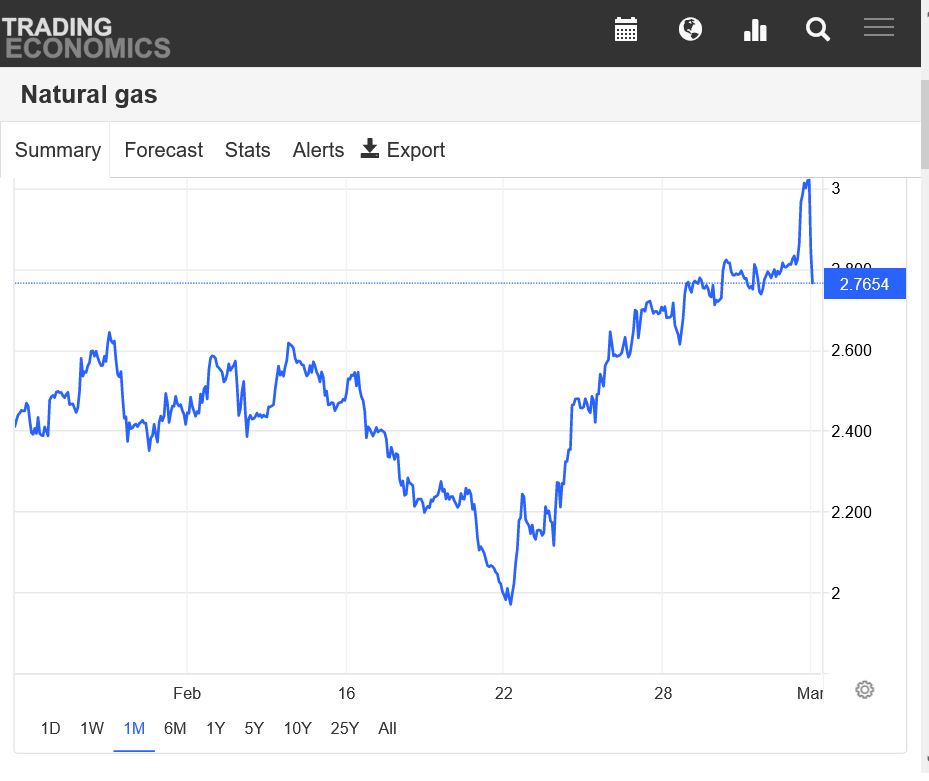
Natural gas futures plummeted on Monday as weekend weather models shed a huge amount of demand from the 15-day outlook. Though LNG demand hit a fresh high amid a key export facility’s return of operations, the April Nymex contract settled 43.7 cents lower at $2.572/MMBtu. May futures dropped 41.1 cents to $2.730. At A Glance:…
++++++++++++
Picture worth 1,000 words: 1 week chart below
0Z GEFS based AO forecasts for Mar 6th:
2/26 run: -0.1
2/27 run: -0.5
2/28 run: -1.3
3/1 run: -1.5
3/2 run: -1.9
3/3 run: -2.2
3/4 run: -2.3
The actual AO for March 6th came in at -2.3
Here are the coldest mean lows for each EPS run back to the 2/28 0Z run for RDU/ATL, which shows why it is a bad trend for SE cold lovers:
2/28 0Z: 35/36 on 3/13-14
2/28 12Z: 34/34 on 3/14-15
3/1 0Z: 31/30 on 3/12 (coldest tied)
3/1 12Z: 32/31 on 3/12-13
3/2 0Z: 35/36 on 3/14-15
3/2 12Z: 32/31 on 3/13
3/3 0Z: 31/30 on 3/12-13 (coldest tied)
3/3 12Z: 31/31 on 3/13-14
3/4 0Z: 31/31 on 3/13-14
3/4 12Z: 33/34 on 3/13-15
3/5 0Z: 33/36 on 3/13-14
3/5 12Z: 35/37 on 3/14
3/6 0Z: 35/39 on 3/15 (warmest run)
3/6 12Z: 35/38 on 3/15 (2nd warmest run)
This is a double whammy because we're now the closest to the crucial dates of 3/12-15 and the coldest means instead of cooling further, which would be expected on an ensemble with 51 members when getting closer if there's big cold coming, have warmed considerably.
So, chances of the SE getting a notable cold period (say, a couple of hard freezes in ATL/RDU) in mid March have come down considerably since March 3rd. I'm just about ready to give up on the possibility. The models have all been cold biased the last several winters in the E half of the US. Time and time again, as one gets closer to the days being forecasted the models almost always adjust warmer. Over and over and over again! I'd love to know two things:
- why the models are so consistently cold biased there, meaning they have to adjust warmer as the forecasted time gets closer
- why they can't be modified to take into account this cold bias.
++++
Additional HDD's(getting too late for weather) and the seasonal low 2 weeks ago, make a case for some support here.
The 7 day temps ending last Thursday, used for the upcoming EIA this Thursday are MUCH more bullish than recent, extremely bearish EIA reports. Only the Southeast/Mid-Atlantic was warm last week
https://www.cpc.ncep.noaa.gov/products/tanal/temp_analyses.php

Coldest for each EE run RDU/ATL:
3/2 0Z: 35/36 on 3/14-15
3/2 12Z: 32/31 on 3/13
3/3 0Z: 31/30 on 3/12-13 (coldest run)
3/3 12Z: 31/31 on 3/13-14
3/4 0Z: 31/31 on 3/13-14
3/4 12Z: 33/34 on 3/13-15
3/5 0Z: 33/36 on 3/13-14
3/5 12Z: 35/37 on 3/14
3/6 0Z: 35/39 on 3/15 (warmest run)
3/6 12Z: 35/38 on 3/15
3/7 0Z: 33/35 on 3/15
3/7 12Z: 32/31 on 3/15 (GEFS 32/34)
So, the last two EPS runs have come in significantly colder at ATL (by 7F) and slightly colder at RDU (by 3F). Regardless, I'm still not nearly as impressed with midmonth cold potential compared to how it looked 4-6 days ago. But the overall pattern could still change back to even colder and be similar to how it looked 4-6 days ago being that 3/15 is still 8 days away though I don't consider getting all of the way back to that look to be likely right now.