
Soilmoisture anomaly:
These maps sometimes take a day to catch up to incorporate the latest data(the bottom map is only updated once a week).
https://www.cpc.ncep.noaa.gov/products/Soilmst_Monitoring/US/Soilmst/Soilmst.shtml#


The drought monitor is LONGER TERM moisture. We've been busting the drought in many places this Winter! The Plains are still Extremely dry. However, an El Nino on the way brings increasing chances to wipe out that drought too.
https://droughtmonitor.unl.edu/

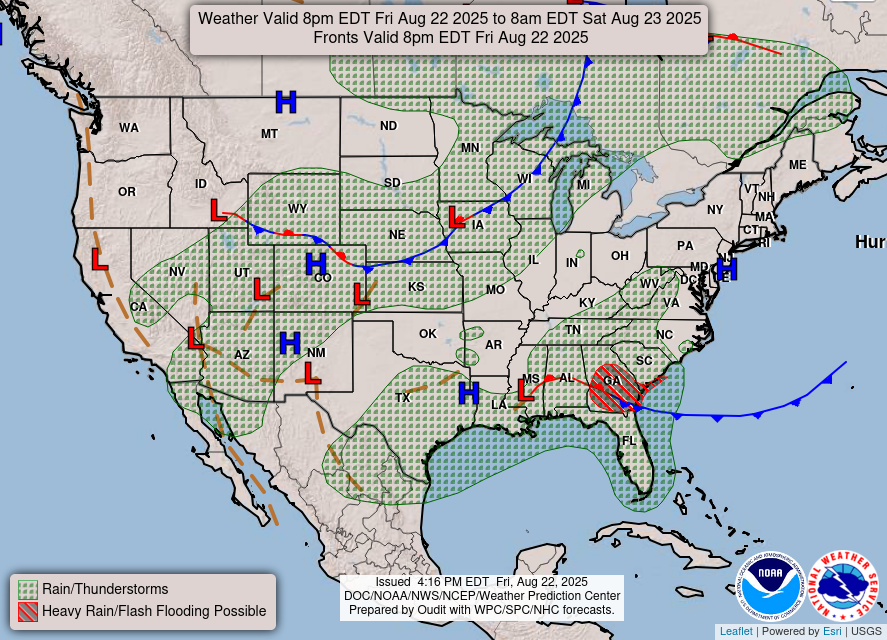
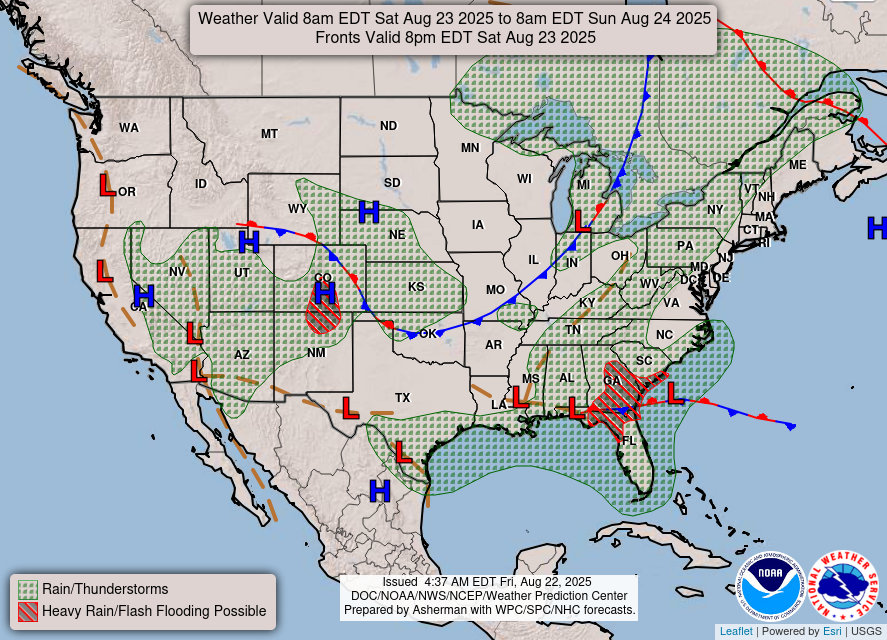
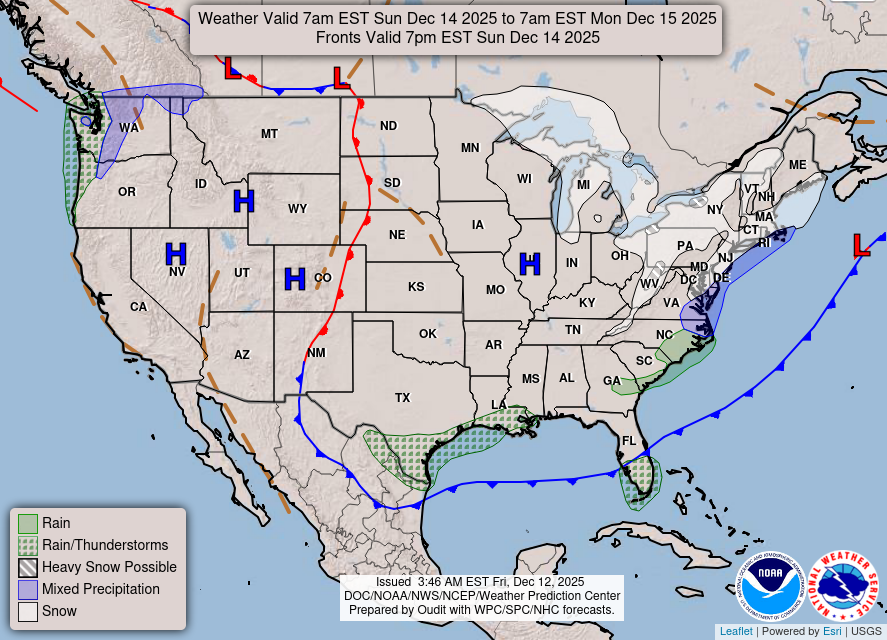
Weather map now.
In 24 hours and
In 48 hours.
https://www.wpc.ncep.noaa.gov/#
+++++++++++++++++++++++++++++++++++++++++++++++++
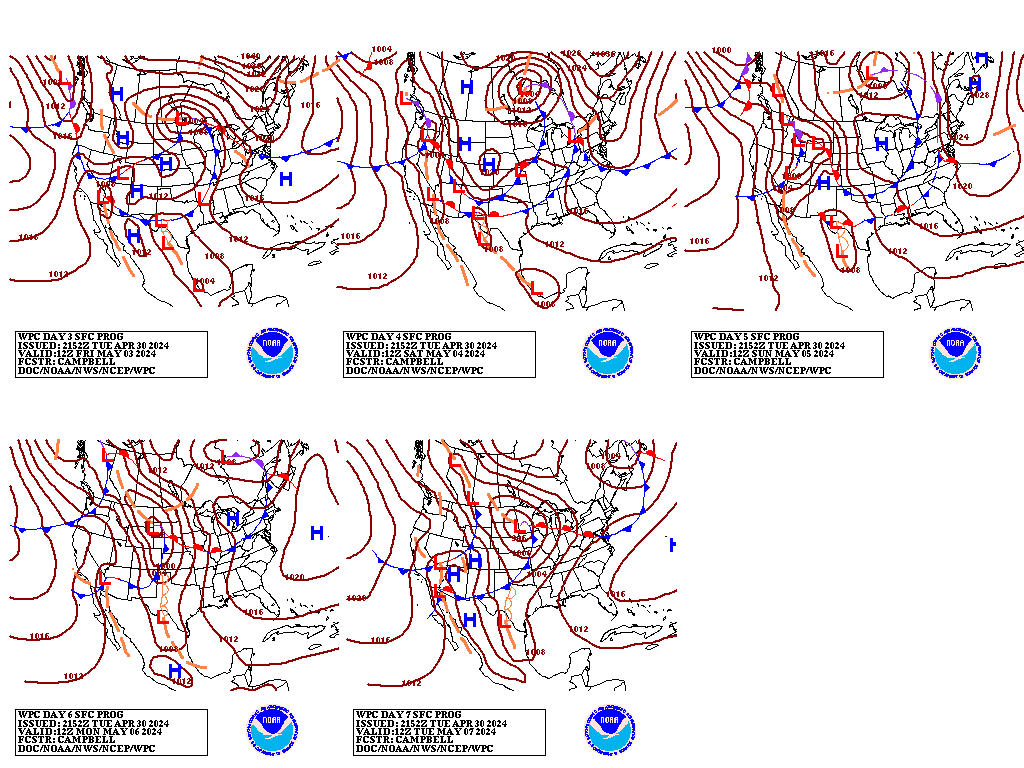
Surface Weather maps for days 3-7 below:
https://www.wpc.ncep.noaa.gov/medr/medr.shtml
+++++++++++++++++++++++++++++++++++++++++++
The latest 7 day precip forecasts are below.
Day 1 below:
http://www.wpc.ncep.noaa.gov/qpf/fill_94qwbg.gif?1526306199054

Day 2 below:
http://www.wpc.ncep.noaa.gov/qpf/fill_98qwbg.gif?1528293750112

Day 3 below:
http://www.wpc.ncep.noaa.gov/qpf/fill_99qwbg.gif?1528293842764

Days 4-5 below:
http://www.wpc.ncep.noaa.gov/qpf/95ep48iwbg_fill.gif?1526306162

Days 6-7 below:
http://www.wpc.ncep.noaa.gov/qpf/97ep48iwbg_fill.gif?1526306162

7 Day Total precipitation below:
http://www.wpc.ncep.noaa.govcdx /qpf/p168i.gif?1530796126

Excessive rain threat.
https://www.wpc.ncep.noaa.gov/qpf/excess_rain.shtml
Day 1 Threat Area in Text Format
Current Day 2 Forecast |
https://www.cpc.ncep.noaa.gov/products/predictions/610day/


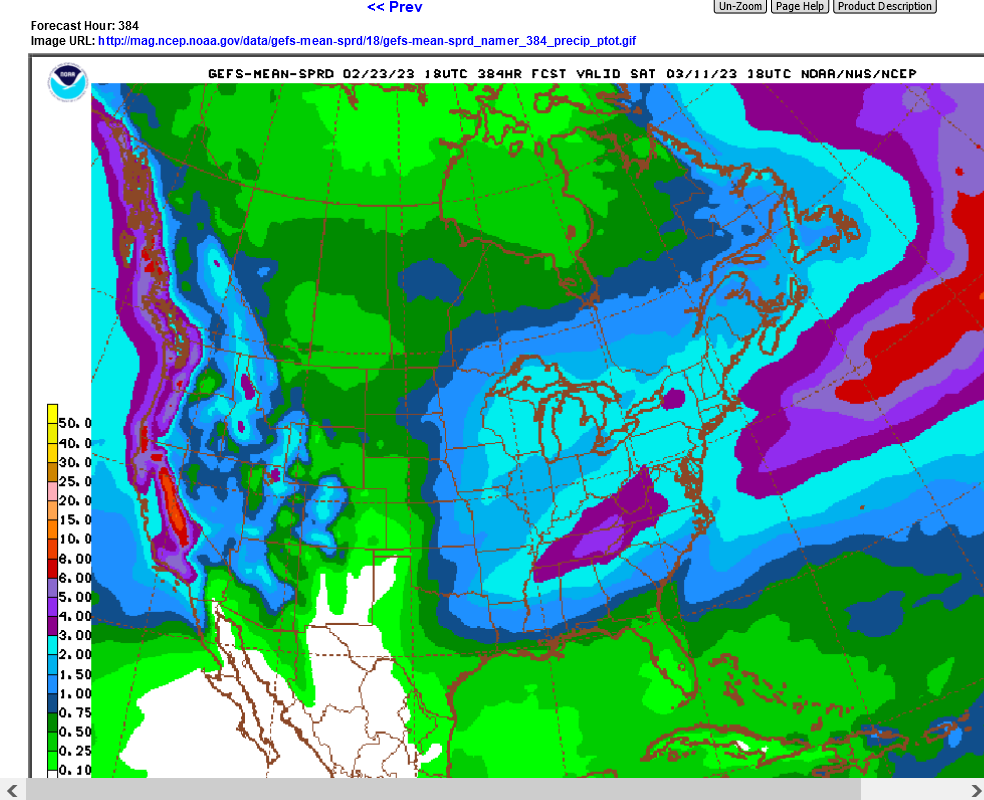
Total 384 hour precip from the last 18z GEFS:
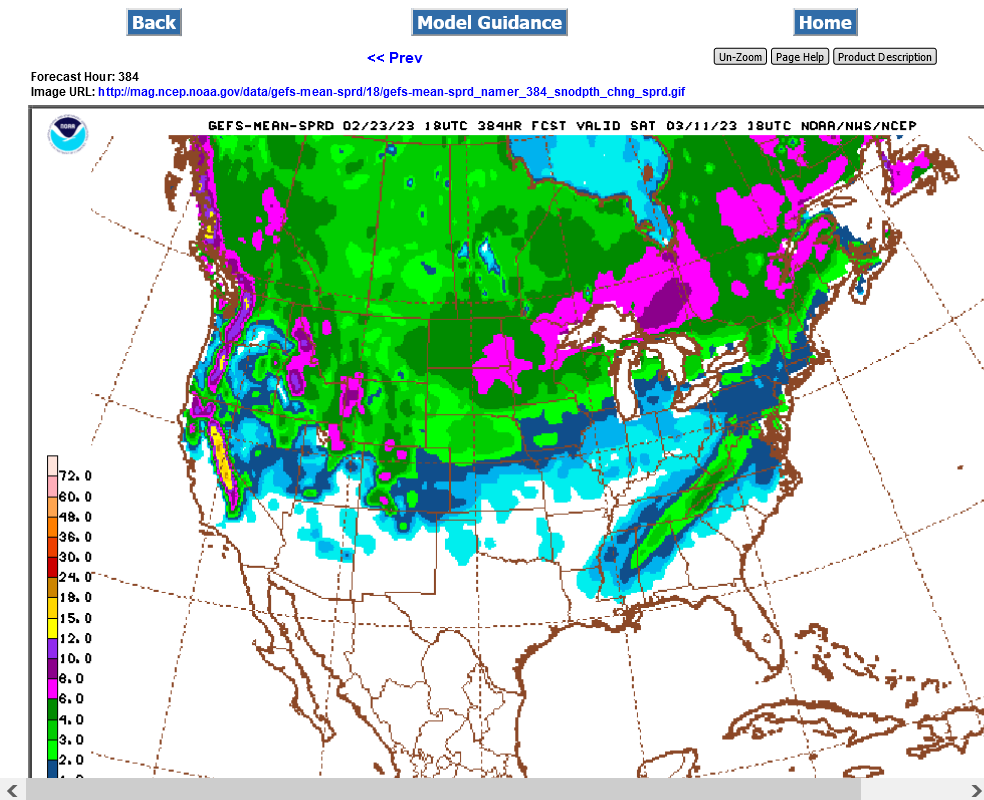
Total snow from the same model and time frame.
Look at the narrow band in the Southeast.
But even with his concerns, part of Ellingson is optimistic – and he looks forward to the benefits of a strong snowpack.
"We've had a great season already," he said. "And it's looking like we're going to have quite the Spring."
For many Californians – particularly those in the Sierra Nevada mountains – the storms come as good news.
The emerging storm, she said, is "not anything unusual" – and the city anticipates it won't be the same kind of "non-stop, all hands-on deck situation" they experienced earlier this year.
Mammoth Mountain, home to a thriving winter tourism scene, is already six inches over its annual average of 400 inches of snow, said spokesperson Lauren Burke.
"It's been an incredible season here at Mammoth. We've already surpassed our annual seasonal snowfalls," she said, noting the summits have received about 550 inches. "And then we had some much-needed sunshine, and we're right back in it for the next week or two."
The first two weeks of January alone brought the region 17 feet of snow in just 16 days, which according to Burke, caused road and ski lift closures, along with heaps of snow to be shoveled.
But this February's storm should be more manageable for the region – even if its summit gets between 15 and 21 inches of snow Friday, as the National Weather Service predicts. Burke added this storm should bring the "perfect amount of snow to get out there and ski and ride."
"We expect to see a lot of happy faces out on the mountain," she said.
Others will manage to put a climate crisis spin on everything. Even good things. That's what they do.
The same storm system heading for the Bay Wednesday night is prompting the first blizzard warning on record in Los Angeles County.
While California bundles up, the southeast is experiencing near record heat with temperatures in the 90’s for parts of Florida.
“Extreme cold, extreme rain, extreme heat and even extreme drought they are all becoming more likely,” SJSU Professor Alison Bridger.
But how much of this can be contributed to climate change? Bridger explains when you look at all these extreme weather events together.
“You can’t find exact fingerprints of climate change on one event, but when there are so many events not just in America but worldwide, it becomes very obvious that this is an impact of climate change," she said.
https://blogs.sjsu.edu/experts/2016/02/12/alison-bridger/
Alison Bridger is a professor in the Department of Meteorology and Climate Science. Her research focuses on large-scale atmospheric dynamics (Earth and Mars) and numerical prediction. She holds a doctoral degree in atmospheric science from Colorado State University.
+++++++++
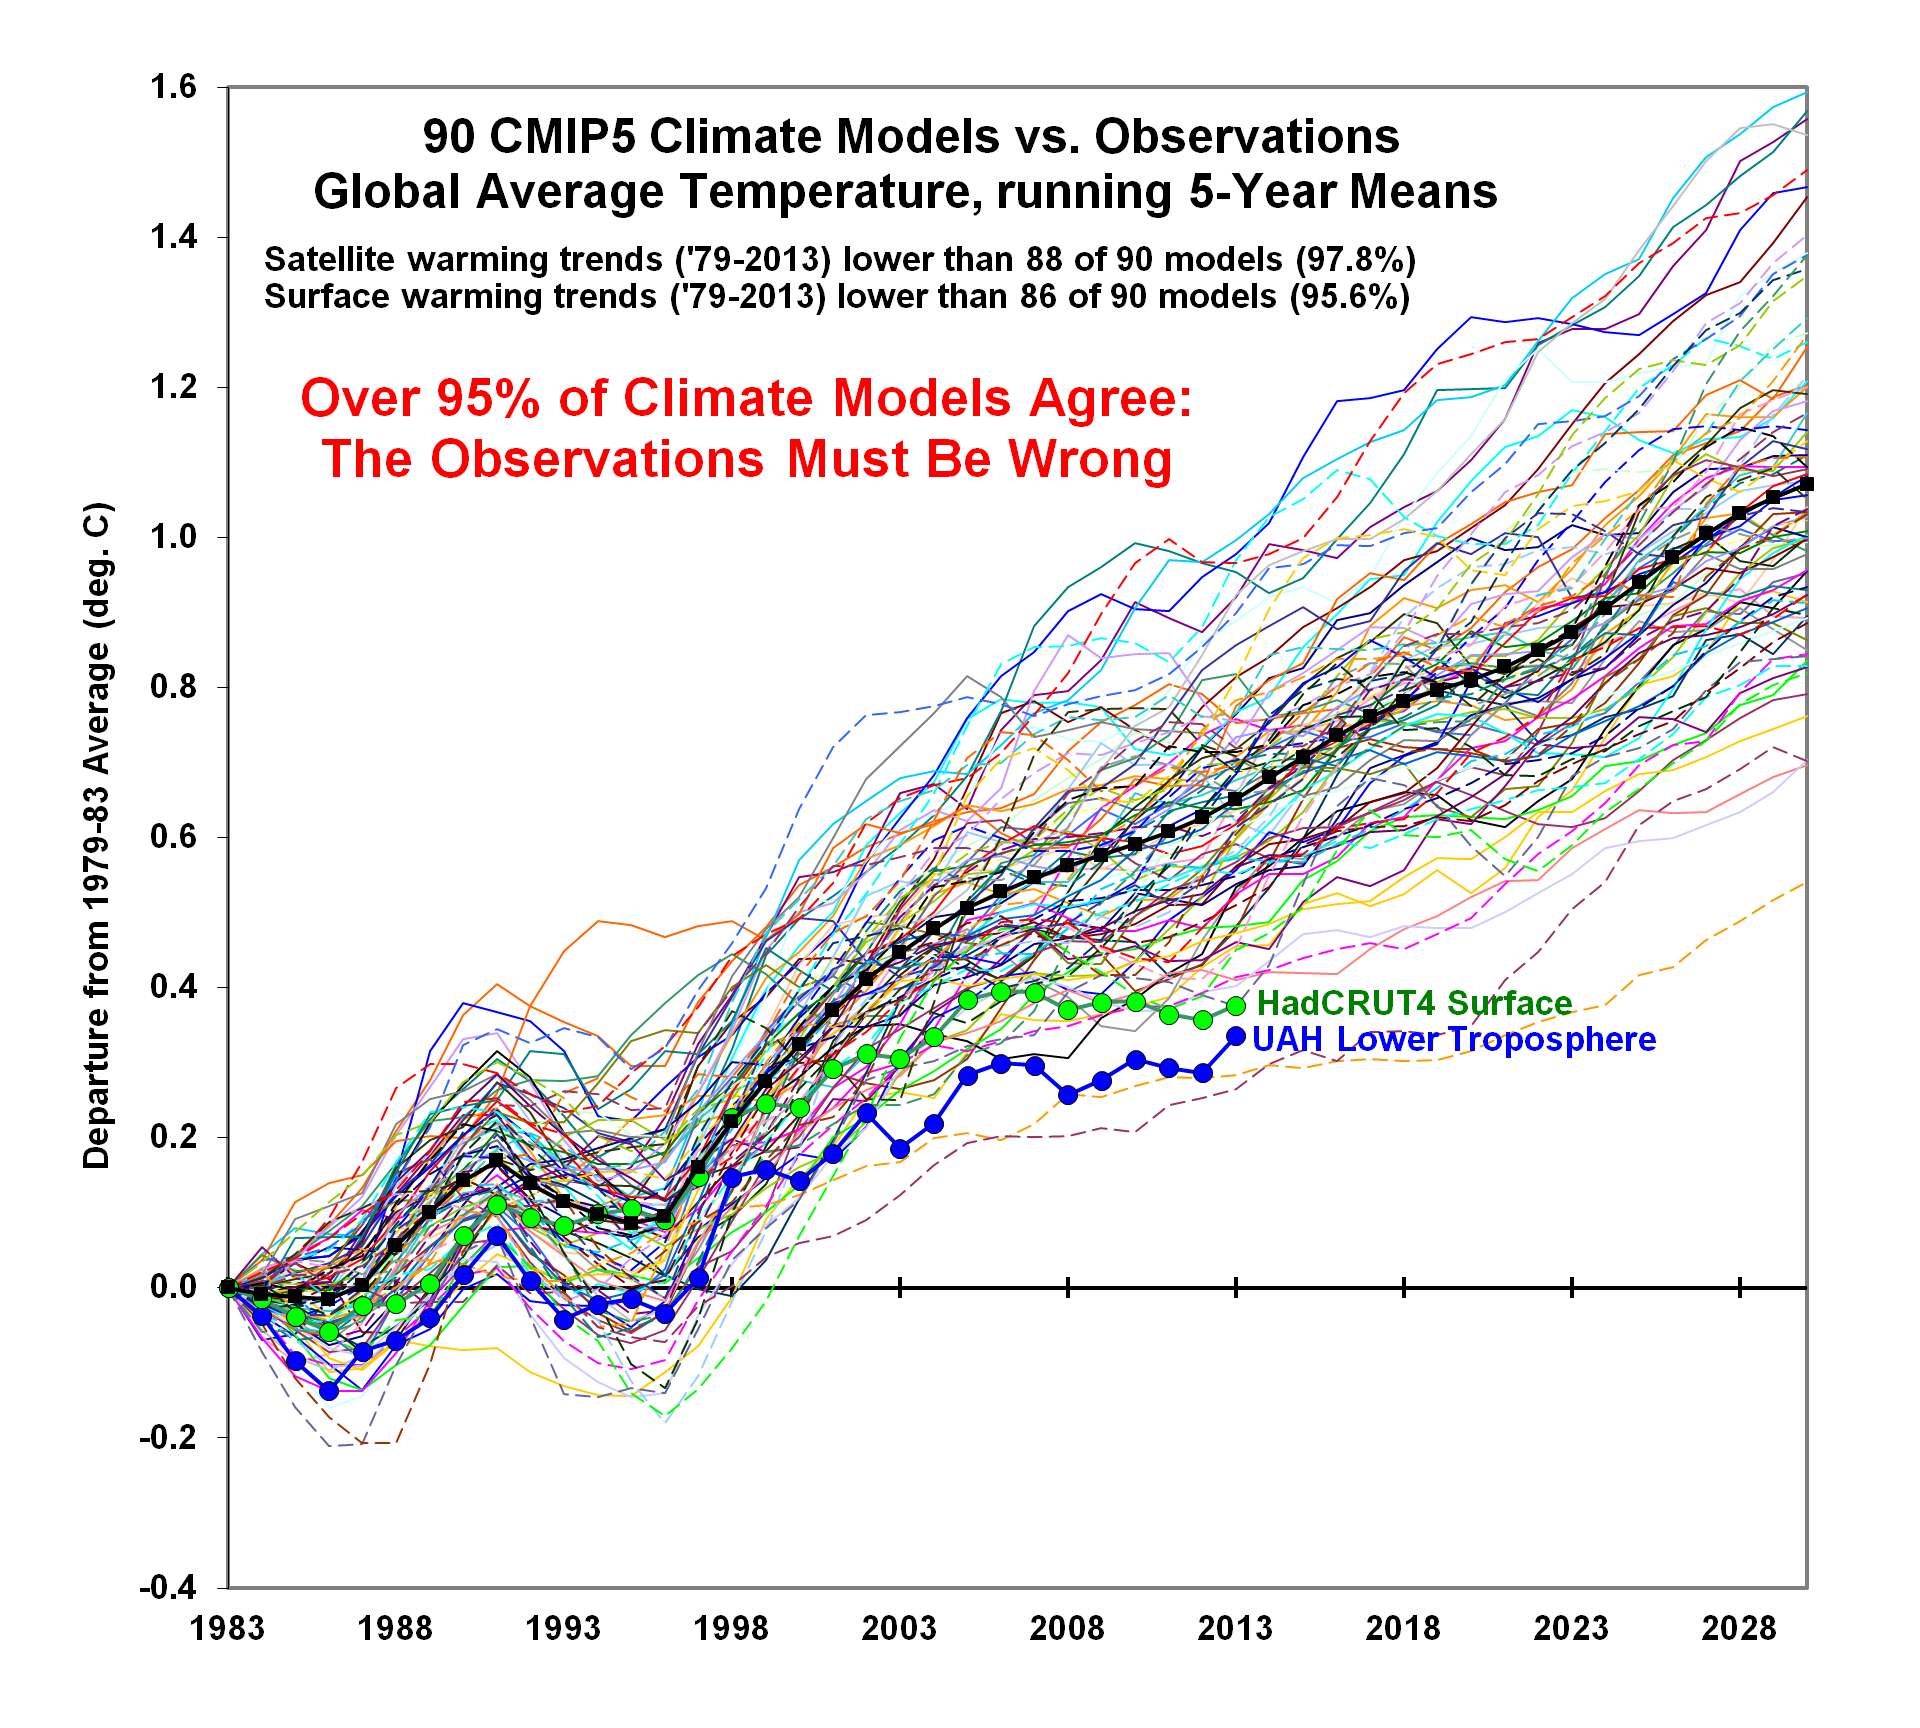
I can tell you exactly why Dr. Bridger is wrong with her assumption that extremes are all more likely. Numerical prediction for her expertise means that she believes in the busted, too warm numerical climate models and thinks they trump the observations, empirical data of the real world.
Theoretical models instead of observations based on measured empirical data. Assuming the models will always be right and processing all information to confirm that..........and not adjusting the busted models to make them fit the real world.

https://www.drroyspencer.com/2014/02/95-of-climate-models-agree-the-observations-must-be-wrong/
US Climate Is Getting Less Extreme, Not More
20 responses |
Started by metmike - Jan. 13, 2023, 12:37 p.m.