Main weather page here:
https://www.marketforum.com/forum/topic/83844/
Evansville In NWS
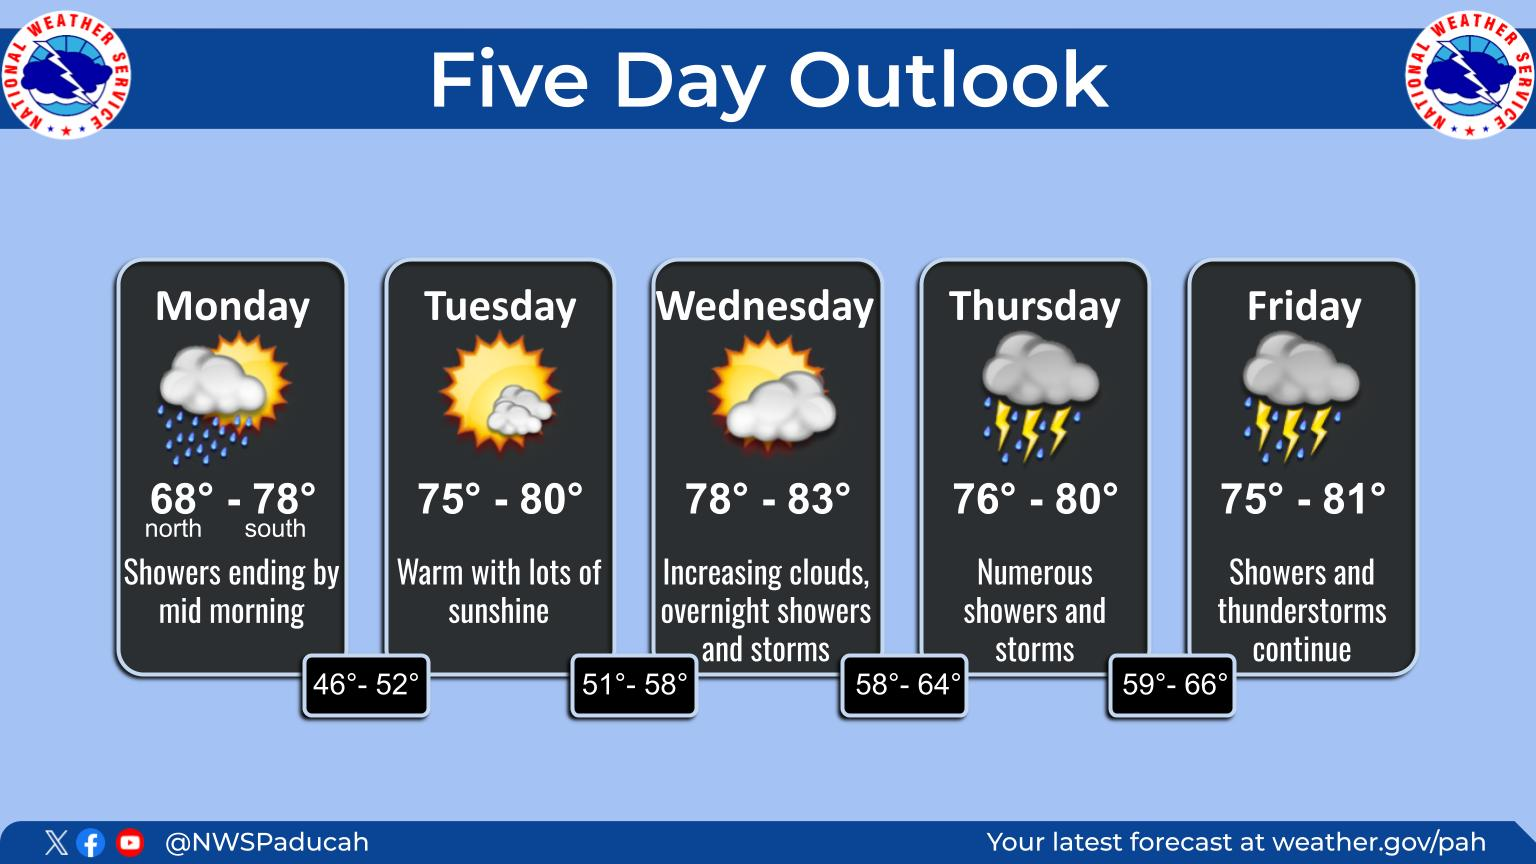
3+ inches of rain possible from Thursday Evening thru Friday Night.
Chance of a severe thunderstorms late Friday Evening/very early Saturday morning.

Excessive rain threat.
https://www.wpc.ncep.noaa.gov/qpf/excess_rain.shtml
Current Day 1 Forecast
Day 1 Threat Area in Text Format
Current Day 2 Forecast |

+++++++++++++++++
The latest 7 day precip forecasts are below.
Day 1 below:
http://www.wpc.ncep.noaa.gov/qpf/fill_94qwbg.gif?1526306199054

Day 2 below:
http://www.wpc.ncep.noaa.gov/qpf/fill_98qwbg.gif?1528293750112

Day 3 below:
http://www.wpc.ncep.noaa.gov/qpf/fill_99qwbg.gif?1528293842764

Days 4-5 below:
http://www.wpc.ncep.noaa.gov/qpf/95ep48iwbg_fill.gif?1526306162

Days 6-7 below:
http://www.wpc.ncep.noaa.gov/qpf/97ep48iwbg_fill.gif?1526306162

7 Day Total precipitation below:
http://www.wpc.ncep.noaa.govcdx /qpf/p168i.gif?1530796126

Severe Storm Risk......updated daily(days 1 and 2 twice daily).
https://www.spc.noaa.gov/products/outlook/
Current Day 1 Outlook | |
Current Day 2 Outlook | |
Current Day 3 Outlook | |
Current Day 4-8 Outlook |
Weatherman (person?) saying about 2.5 inches where I'm at in S Mo. I vote we save half or all the coming rain for July as pastures are pretty wet.
You get my vote on that one rock!
Here is southwest IN, we got 3.5 inches in 1 day earlier this month but much of it was runoff and soils have dried out a bit since then.
+++++
Soilmoisture anomaly:
These maps sometimes take a day to catch up to incorporate the latest data(the bottom map is only updated once a week).
https://www.cpc.ncep.noaa.gov/products/Soilmst_Monitoring/US/Soilmst/Soilmst.shtml#
![]()


++++++++++++++++++++++++++++
https://mrcc.purdue.edu/cliwatch/watch.htm#curMonths

https://droughtmonitor.unl.edu/
Drought Monitor:
March 21, 2023

Drought monitor previous years: You can see the natural La Niña, (cold water-in the tropical Pacific)causing the drought! Starting in 2020, then worsening for 2+ years!
The ending of La Niña in 2023-heading towards El Nino, is causing the opposite weather-bombarding us with moisture.…..too much in some cases. This is a natural cycle NOT climate change!
++++++++++++++++++++++++++++++++
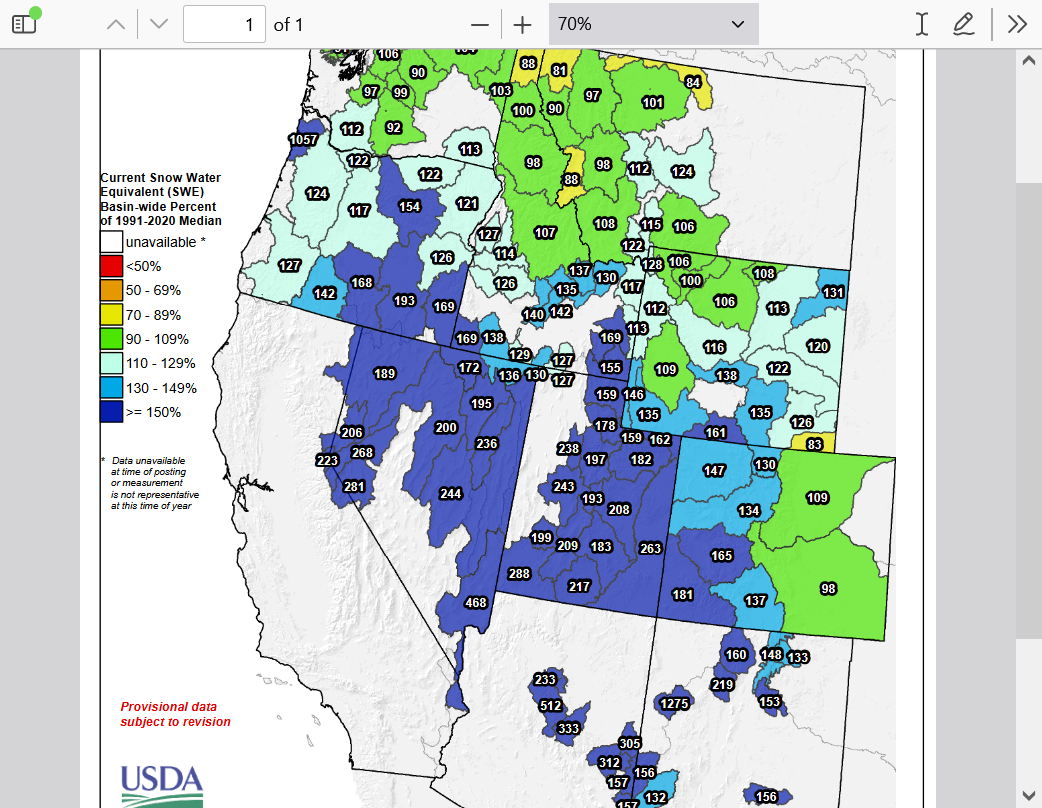
Highest snow pack in the last 10 years for the Southwest with more on the way.
This is astounding and just what the drought doctor ordered!
Why only reporting on how extreme and bad this is by media?
That doesn't sell!
This is mainly thanks to the global warming pattern/El Nino kicking in again in the Pacific after the pause caused by the La Nina(cold water in the tropical Pacific) which caused the drought....is over!
Climate change INCREASES precip!
https://www.wcc.nrcs.usda.gov/ftpref/data/water/wcs/gis/maps/west_swepctnormal_update.pdf
Related post:
More atmospheric rivers/La Nina is dead
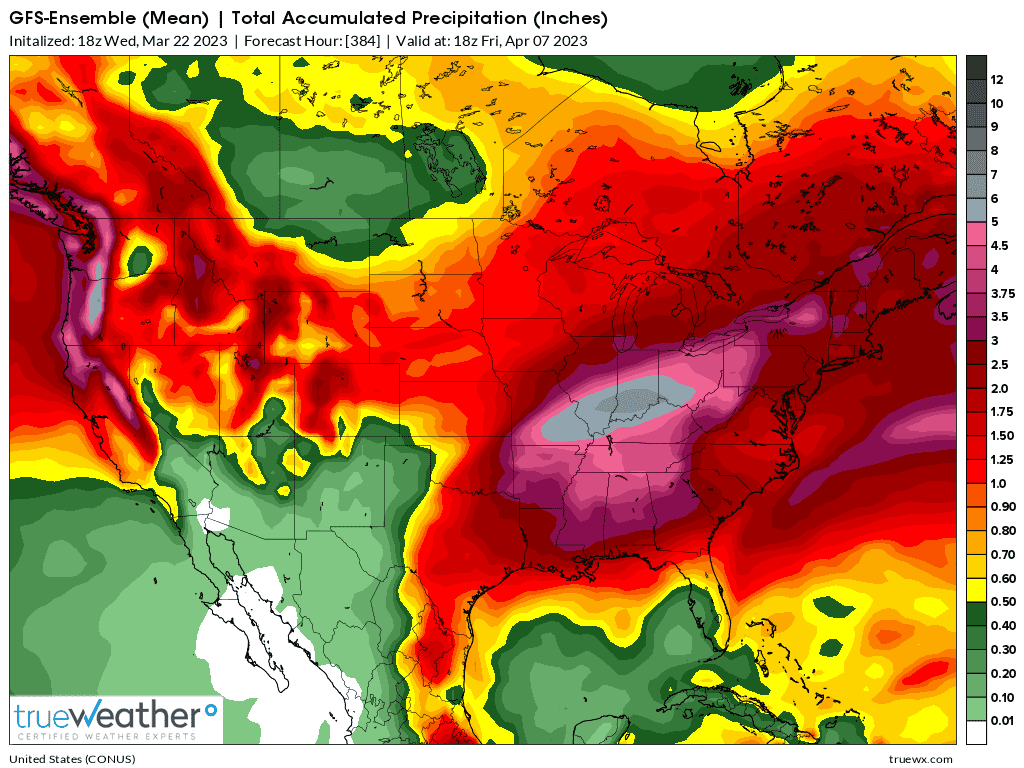
rockhouse,
You won't like this map of total rains the next 384 hours. The outside gray shade is 5+ inches. The darker gray is 6+ inches.
We're in this together unfortunately )-:
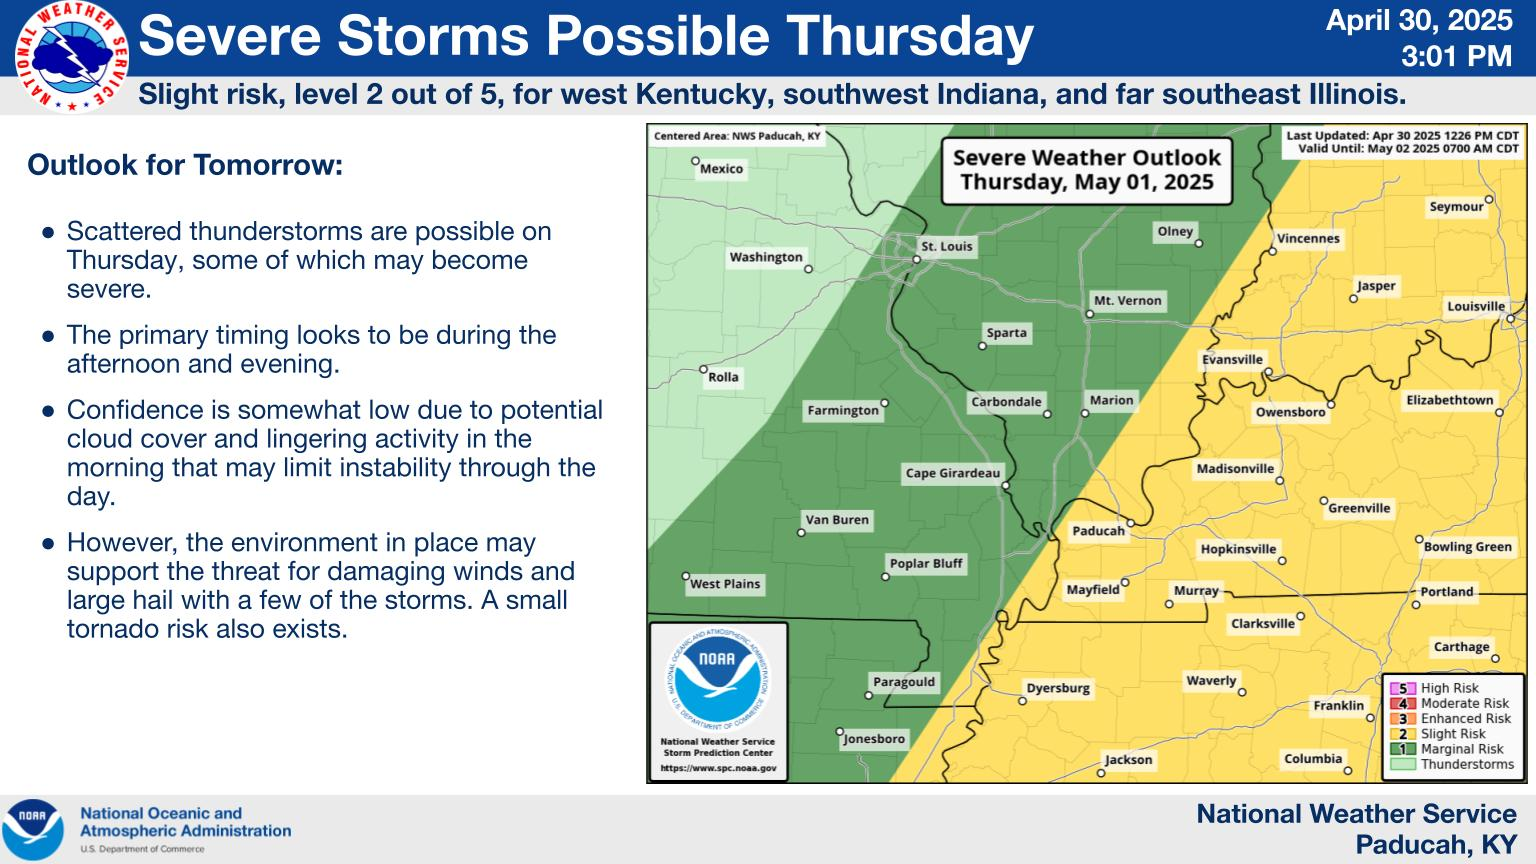
The main update this morning is to shift the slight and enhanced risk of severe storms farther north to the Ohio River Valley which increases the chances for Evansville.
https://www.weather.gov/pah/weatherstory

Severe Storm Risk......updated daily(days 1 and 2 twice daily).
https://www.spc.noaa.gov/products/outlook/
| Current Convective Outlooks | |
|---|---|
| Today's Convective Outlooks | |
| Updated: Thu Mar 23 12:43:08 UTC 2023 (2h 30m ago) | |
Current Day 1 Outlook | Forecaster: Edwards/Dean Issued: 23/1239Z Valid: 23/1300Z - 24/1200Z Forecast Risk of Severe Storms: Slight Risk |
Current Day 2 Outlook | Forecaster: Mosier Issued: 23/0600Z |
Individual severe weather risks below
1. Tornado
2. Damaging wind in a thunderstorm
3. Hail
We can see that the HIGHER risks are farther SOUTH. The shaded areas represent the probability of this happening within 25 miles in that shaded area. So for Evansville, the chance of a tornado within 25 miles is 2-4%-green shade.
98% chance of NOT having a tornado within 25 miles in the green shade below.
15% chance of a wind gust of 58+ mph in a thunderstorm within 25 miles-yellow shade.
new maps will be posted Friday morning!
Showtime!
To see rain amounts, go here: https://www.iweathernet.com/total-rainfall-map-24-hours-to-72-hours
You can scroll down and get almost the entire comprehensive weather picture updated constantly here.
Current Hazards at the link below.
Go to the link below, hit hazards box in the top right hand corner(it will also define all the color codes), if its not already in the hazards mode when you load the link.
Then you can hit any spot on the map, including where you live and it will go to that NWS with all the comprehensive local weather information for that/your county.

Latest National radar images
https://www.wunderground.com/maps/radar/current
This link below provides some great data. After going to the link, hit "Mesoanalysis" then, the center of any box for the area that you want, then go to observation on the far left, then surface observations to get constantly updated surface observations or hit another of the dozens of choices.
 Found a great new link/site that shows us how much precip fell(from 1 hr to 72 hours) for different periods to share with you. https://www.iweathernet.com/total-rainfall-map-24-hours-to-72-hours Data Update Cycle: The 1-hr mosaic is updated every 5 min (approx). All other mosaics are now updated hourly, including the 48h and 72h maps. The site does not allow me to copy the actual images/data here, as we do with all the other links above..........so just go to the link! |
Current Conditions below updated every few minutes.
UPPER MIDWEST
https://www.spc.noaa.gov/exper/mesoanalysis/new/viewsector.php?sector=13#


https://www.spc.noaa.gov/exper/mesoanalysis/new/viewsector.php?sector=13#
LOWER MIDWEST
https://www.spc.noaa.gov/exper/mesoanalysis/new/viewsector.php?sector=20

https://www.spc.noaa.gov/exper/mesoanalysis/new/viewsector.php?sector=20#

https://www.spc.noaa.gov/exper/mesoanalysis/new/viewsector.php?sector=20# 
SOUTHCENTRAL
https://www.spc.noaa.gov/exper/mesoanalysis/new/viewsector.php?sector=15#
SOUTHEAST
https://www.spc.noaa.gov/exper/mesoanalysis/new/viewsector.php?sector=18#


Severe Storm Risk......updated daily(days 1 and 2 twice daily).
https://www.spc.noaa.gov/products/outlook/
Individual severe weather risks below
1. Tornado. We can see that the HIGHER risks are farther SOUTH. The shaded areas represent the probability of this happening within 25 miles in that shaded area. So for Evansville, the chance of a tornado within 25 miles is 2-5%-green shade.
95-98% chance of NOT having a tornado within 25 miles in the green shade below.
2. Wind-15% chance of a wind gust of 58+ mph in a thunderstorm within 25 miles-yellow shade.
3. 5% chance of large hail within 25 miles of your location.
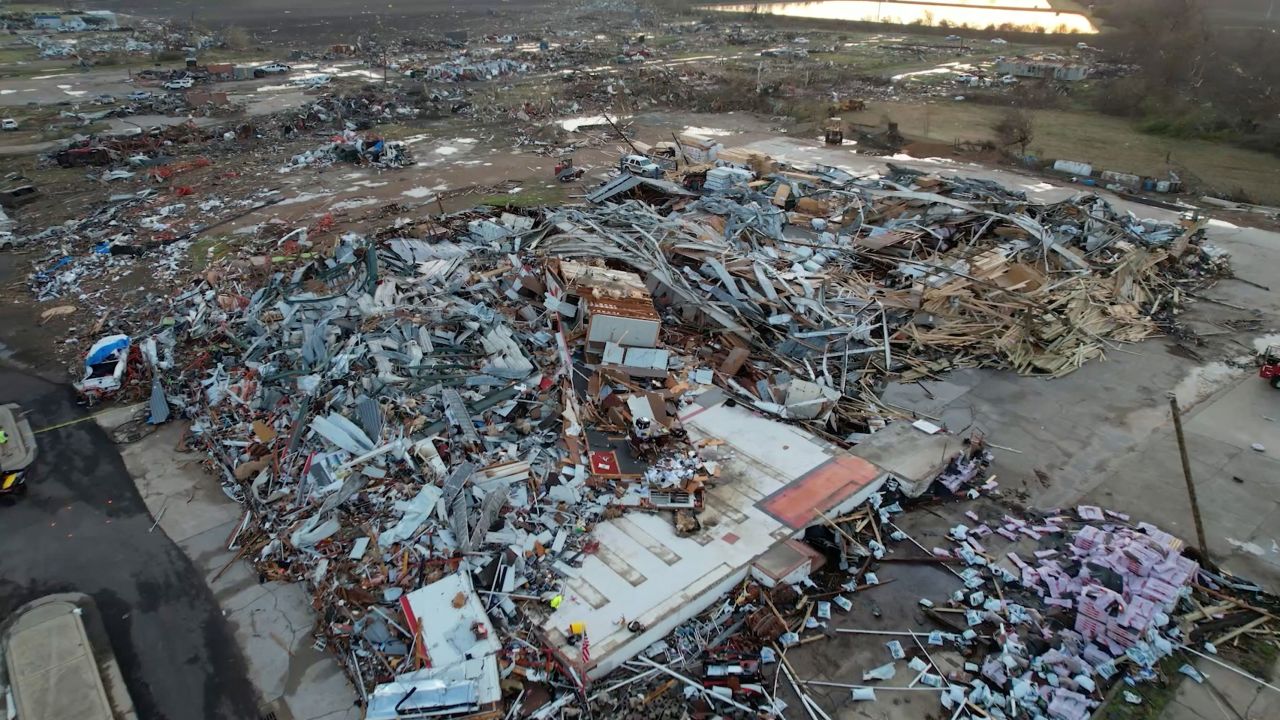
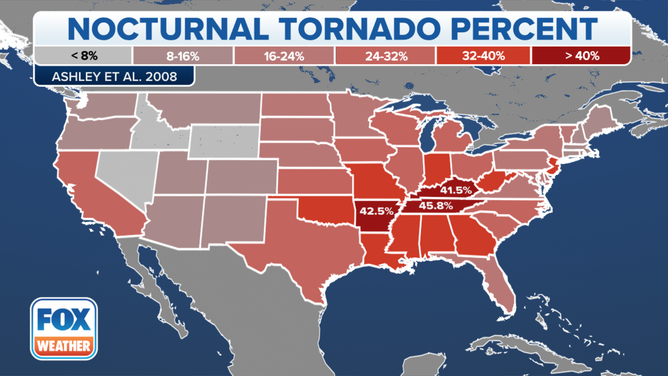
Timing of the highest risk FOR THE SOUTH will be this evening, where an outbreak of severe weather and tornadoes is LIKELY.
+++++++++
We've had 2.5 inches of rain so far. though the NWS shows less than that.
https://www.iweathernet.com/total-rainfall-map-24-hours-to-72-hours
First tornado watch of the day coming in the next 30 minutes
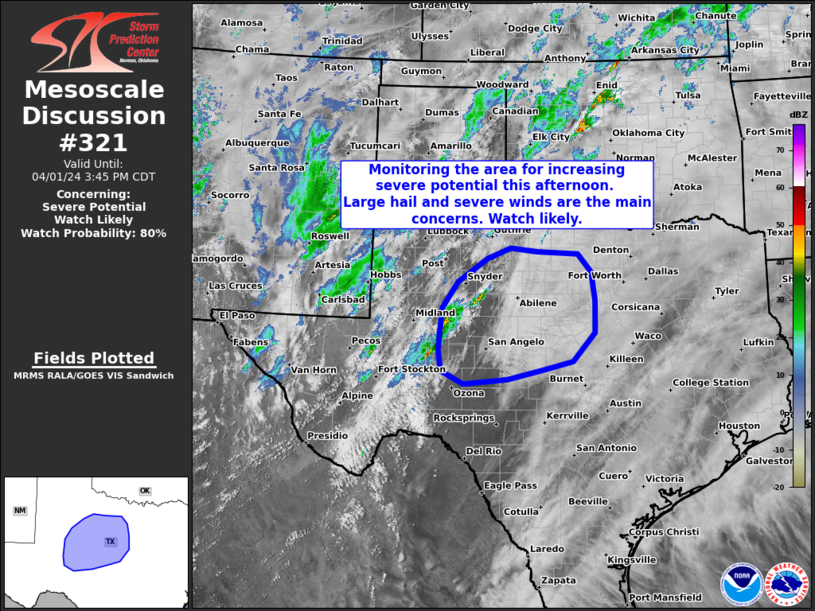
https://www.spc.noaa.gov/products/md/md0321.html
Wave riding along the stalled front is triggering a huge blob of sustained moderate to heavy rains at times which will dominate, especially south of Evansville mid/late afternoon hours, starting just before 2pm.
1: 50pm OK, the heaviest rain shield is evolving more SOUTH of Evansville.
4pm: It's redeveloped northwest of Evansville in the zone of greatest convergence which is shifting around.
The NWS seems to have a good handle on the timing below.
There aren't any indications that this event will present more than a small chance, and isolated tornado threat.
The air is just too cool/stable to think otherwise.
https://www.weather.gov/pah/weatherstory
The jet stream at 250 mb, around 34,000 feet/6.5 miles up is strongest over the Great Lakes at almost 180 knots or over 200 mph.
That would be capable of creating some very impressive divergence and lift, along with wind sheer IF it were above the area with the favorable warm, humid surface conditions much farther south.
But its not. The jet stream(jet streak) farther south is nothing to sneeze at but still just a modest 120 knots/140 mph which is still good for tornadoes in the very warm humid air south of us, where the temps are above 70 degrees.
The current temperature is only 54 degrees in Evansville. It's going to be extremely difficult to generate enough instability with a temperature that low to generate severe thunderstorms or a tornado.

| THUNDERSTORM INGREDIENTS |
METEOROLOGIST JEFF HABY
(7) Upper level Jet Stream - Use forecast models to determine the strength of the jet stream. The stronger the jet, the stronger the upper level forcing. Below is a guide to jet stream wind and upper level divergence (occurs in right rear and left front quadrant of a jet streak)
| Greater than 200 knots | Incredible divergence |
| 150 to 200 knots | Large divergence |
| 100 to 149 knots | Good divergence |
| 70 to 99 knots | Marginal divergence |
| Less than 70 knots | Small divergence |
+++++++++++++++++++++++
(3) Warm PBL temperatures - Air density decreases with increasing temperature. The greater the heating is during the day, the greater the instability of the atmosphere. Days with sunshine will be more convectively unstable than days with continuous cloud cover. The breaking of clouds on a day when severe weather has been forecast will increase the likelihood of severe weather. A temperature guide for buoyancy follows below (lift will determine if bouyancy is allowed to occur):
| 100+ | Incredibly buoyant (if dewpoint greater than 55) |
| 90-99+ | Extremely buoyant (if dewpoint greater than 55) |
| 80-89+ | Very buoyant (if dewpoint greater than 55) |
| 70-79 | Fairly unstable (if dewpoint greater than 55) |
| 60-69 | Marginal (if dewpoint greater than 55) |
| Less than 60 | Positive temperature and dewpoint advection needed |
https://www.spc.noaa.gov/exper/mesoanalysis/new/viewsector.php?sector=20#
https://www.spc.noaa.gov/exper/mesoanalysis/new/viewsector.php?sector=20#
This guy is the best for teaching and giving forecasting tips.
If you spent the next couple of months just studying and learning from his tutorials......congrats, you're a genius and would understand as much as most meteorologists forecasting for years. Maybe more about the principles but much less about using the models in real time.
HABY'S WEATHER FORECASTING HINTS
http://www.theweatherprediction.com/habyhints/
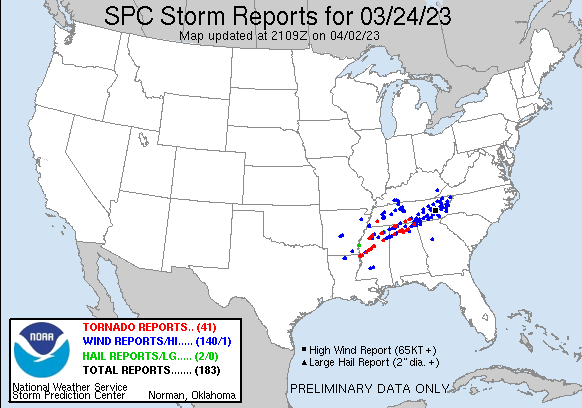
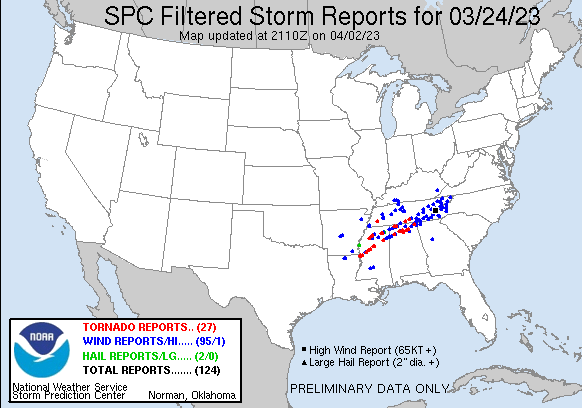
https://www.spc.noaa.gov/climo/reports/230324_rpts.html

| < 230323 Reports 230325 Reports > |
| Note: All Reports Are Considered Preliminary | |||||||
| |||||||
https://www.cnn.com/2023/03/25/weather/us-severe-storms-saturday/index.html
