https://www.drroyspencer.com/2023/06/uah-global-temperature-update-for-may-2023-0-37-deg-c/
https://wattsupwiththat.com/2023/06/02/uah-global-temperature-update-for-may-2023-0-37-deg-c/
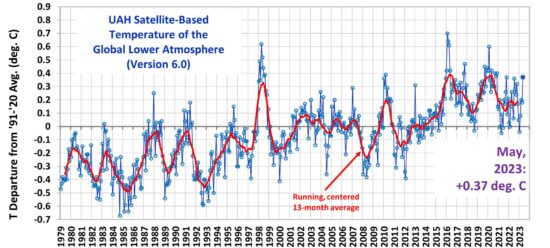
The linear warming trend since January, 1979 remains at +0.13 C/decade (+0.11 C/decade over the global-averaged oceans, and +0.18 C/decade over global-averaged land).
+++++++++++
Mike Maguire
Reply to Walter
June 2, 2023 10:36 pm
Yep!
After the long pause, enhanced by the natural, long lived La Nina…… the very slow, mostly beneficial greenhouse gas warming during this current, scientific climate optimum for life on earth will be enhanced again from the natural El Nino.
As expected with this pattern, we should be at record global temperature highs in 2024.
rah
June 3, 2023 12:45 am
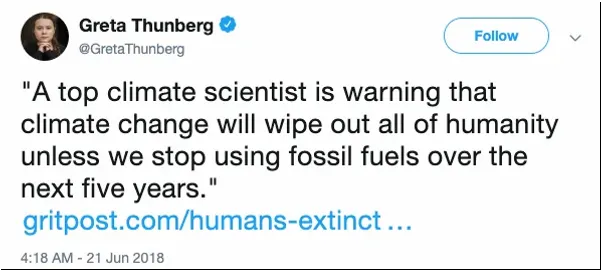
I don’t know why ya’all are bothering with any of this anymore. Saint Greta of the Thunbergs has made it clear that according to “top scientists” in 18 days it is all over and nothing after that can be done to save us from being roasted. The end times have begun.
World To End In Nineteen Days | Real Climate Science
++++++++++++++++++
https://realclimatescience.com/2023/06/world-to-end-in-nineteen-days/
Posted on June 2, 2023 by tonyheller
On June 21, 2018 United Nations spokesperson Greta Thunberg said “climate change will wipe out all of humanity unless we stop using fossil fuels over the next five years.”
By Jacopo Prisco, CNN
Updated 12:16 PM EDT, Tue May 23, 2023
https://www.cnn.com/2023/05/23/world/nyc-sinking-sea-level-climate-scn/index.html
+++++++++++++++++++
This is a LEGIT phenomena!
Here's more, related to this physical process.
Post-glacial rebound (also called isostatic rebound or crustal rebound) is the rise of land masses after the removal of the huge weight of ice sheets during the last glacial period, which had caused isostatic depression. Post-glacial rebound and isostatic depression are phases of glacial isostasy (glacial isostatic adjustment, glacioisostasy), the deformation of the Earth's crust in response to changes in ice mass distribution.[1] The direct raising effects of post-glacial rebound are readily apparent in parts of Northern Eurasia, Northern America, Patagonia, and Antarctica. However, through the processes of ocean siphoning and continental levering, the effects of post-glacial rebound on sea level are felt globally far from the locations of current and former ice sheets.[2]
 A model of present-day mass change due to post-glacial rebound and the reloading of the ocean basins with seawater. Blue and purple areas indicate rising due to the removal of the ice sheets. Yellow and red areas indicate falling as mantle material moved away from these areas in order to supply the rising areas, and because of the collapse of the forebulges around the ice sheets.

Changes in the elevation of Lake Superior due to glaciation and post-glacial rebound
During the last glacial period, much of northern Europe, Asia, North America, Greenland and Antarctica was covered by ice sheets, which reached up to three kilometres thick during the glacial maximum about 20,000 years ago. The enormous weight of this ice caused the surface of the Earth's crust to deform and warp downward, forcing the viscoelastic mantle material to flow away from the loaded region. At the end of each glacial period when the glaciers retreated, the removal of this weight led to slow (and still ongoing) uplift or rebound of the land and the return flow of mantle material back under the deglaciated area. Due to the extreme viscosity of the mantle, it will take many thousands of years for the land to reach an equilibrium level.
·
Just in from NOAA: America not warming since June 2005 despite a 42% increase in industrial era atmospheric CO2. If every emission warms, where's the warming?https://ncei.noaa.gov/access/monitoring/national-temperature-index/time-series/anom-tavg/12/5
I made two graphics to deal with the more foolish claims being made with respect to CO2. 1) Human activities are responsible for at least 1/3rd of atmospheric CO2 (and growing):
·
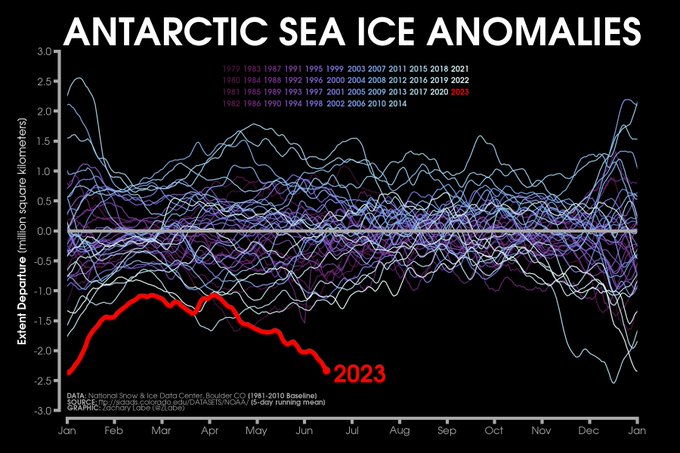
Uh. Graphic from https://zacklabe.com/antarctic-sea-ice-extentconcentration/
.
Prof. Eliot Jacobson@EliotJacobson
·
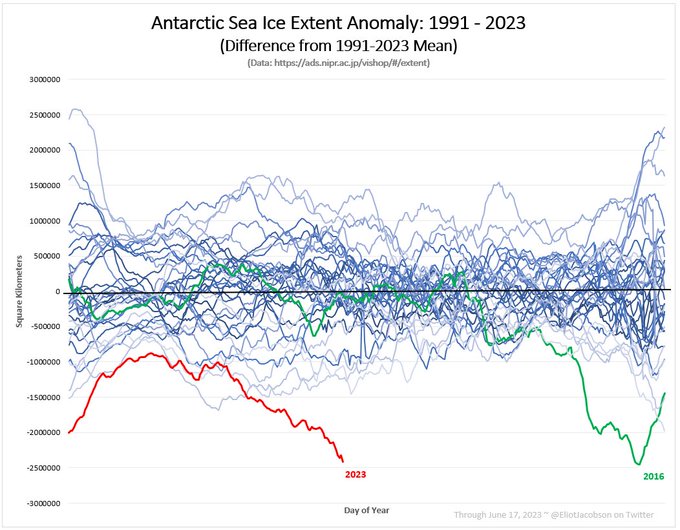
What's happening to Antarctic sea ice extent isn't getting enough global media attention. And by "enough" I mean none. Nothing. This ongoing and dramatic collapse is completely absent from today's news. Yesterday's sea ice extent was 4.02σ below the 1991-2023 mean (1-in-34,000).
·
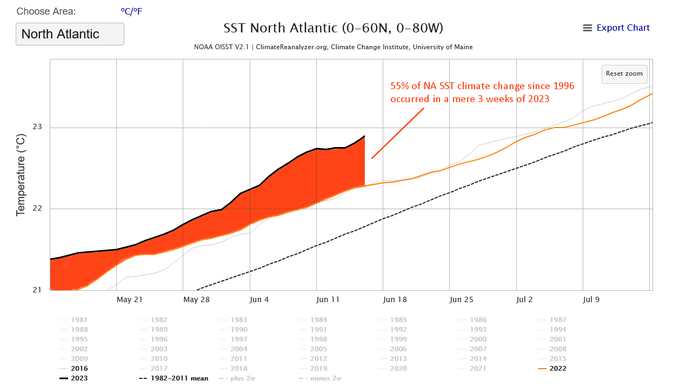
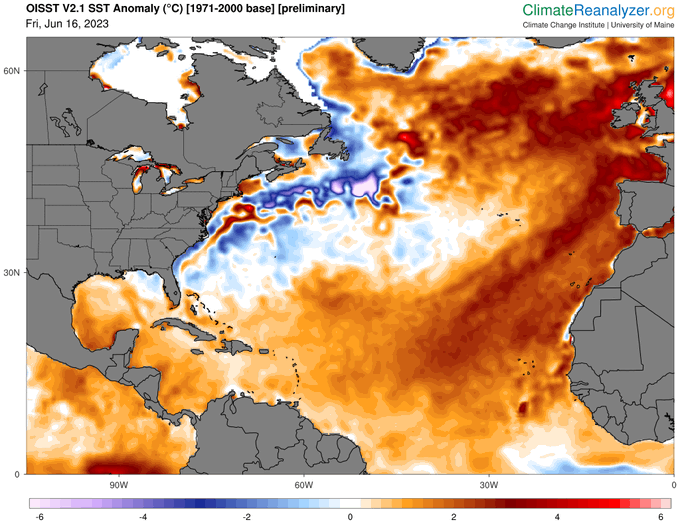
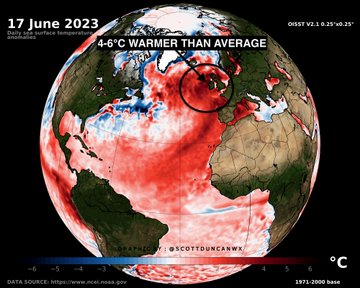
55% of North Atlantic Sea Surface Temperature climate change since 1996 occurred in a mere 3 weeks of 2023. There is only one single possible source for that much heat, in that short a timeframe. This is global. It is NOT 'El Niño'.
·
Parts of the North Sea are >6°C warmer than usual for this time of the year. It's probably the most anomalously warm body of water on the planet. There are severe storm warnings in place for much of Western Europe... [1/2]
+++++++++++++++++
metmike:
This is freaky and the vast majority CAN'T be caused by climate change(I don't think).
This can’t be repeated enough and applies to your wonderful authentic science:
It really boils down to this (Cliff Mass can be counted on as an elite source for using objective, authentic science)
https://cliffmass.blogspot.com/2016/03/the-golden-rule-of-climate-extremes.html
The GoldenRule
Considering the substantial confusion in the media about this critical issue, let me provide the GOLDENRULE OF CLIMATE EXTREMES.
Here it is:
The more extreme a climate or weather record is, the greater the contribution of natural variability.
Or to put it a different way, the larger or more unusual an extreme, the higher proportion of the extreme is due to natural variability.
+++++++++++
So what's causing it? More to come!!!
Correct. This graph shows the logarithmically decreasing heating affects from increasing CO2. Today's CO2 warming is tiny and insignificant, especially because of its negative feedback (cooling) affects.
The incredible warming in the Atlantic and warming in the Pacific causing the current El Nino will DEFINITELY warm the atmosphere significantly EVEN MORE than I thought previously the rest of the year into 2024.
This statement at the top, is probably an understatement.
As expected with this pattern, we should be at record global temperature highs in 2024.
Speculation below but this is so extreme and unexpected, an underappreciated factor should be considered.
'Beyond extreme' by definition. Ireland and the British Isles are at the epicentre of a major marine heatwave. We have not seen the North Atlantic look like this in modern records. Marine heatwaves are categorised from 1 to 5. There are hotspots hitting category 5.
+++++++++++++++++++++++++++
The vast majority of this is being caused by something different than climate change extremely slow warming and related to a freakish even of natural variation.
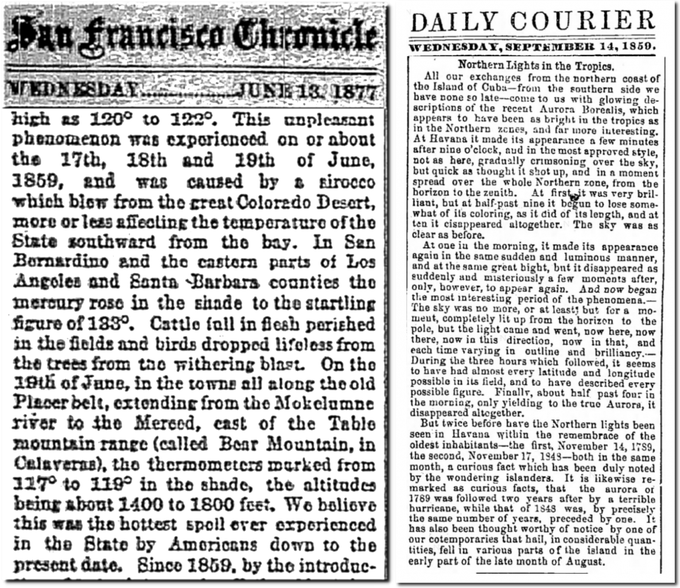
This week in 1859 normally cool Santa Barbara, California reached an incredible 133F (56C) in the shade - caused by downslope winds. A few weeks later the largest solar storm ever recorded brought the Northern Lights to the tropics.#ClimateScam https://realclimatescience.com/2022/02/the-stable-climate-of-1859/
+++++++++++++++
This guy below is full of crap:
Remarkable heatwave across Mexico & Texas. Temps 110+. Heat Index 120+. This map shows the upper level ridge “Heat Dome”. Maxes out at 4.5 sigma. This means in a normal “historical” climate it’s basically impossible. But climate change makes the impossible, probable.
 Climate Realist@ClimateRealists
Chris Morrison: Climate Crisis Shock: No Change in Average U.K. Temperatures for More Than Two Decades
This type of analysis is entirely nonsensical and, frankly, a little amateurish. Non-gaussian distribution -- long warm tail plus a trend -- is not suitable for this type of return period or "sigma" analysis. This is same reasoning being misuse of "normalized anomalies" by this TV meteorologist. Stop with the climate misinformation!
++++++++++
Refusing to learn and continuing to push this nonsense is intentionally dishonest. The weather and climate is interesting and extreme enough today without hyperbole to garner attention like clapping seals.
+++++++++++++++++++
Using a backward looking baseline of a trending upward quantity, such as basin averaged SST, will yield these ridiculous measurements. Same with the Dow Jones index. Couching it will "impossible" to happen under a colder climate is tautological. You wouldn't expect these conditions during the 1750s or 1850s at end of Little Ice Age.
+++++++++++++++
They are normalizing the data with a narrow window. If you expand the SST window to ±2 weeks, then this is within expected variability. The SST warming is early, but not "warmest ever" since seasonal cycle
+++++++++++++++++
metmike: There is no physical/oceanic science explanation for how warming the planet by 1 deg. C over 100 years would suddenly cause a spike in warming in this part of the Atlantic over the course of several months.
This is natural variation.