
Look for deterioration this afternoon for both C and S.
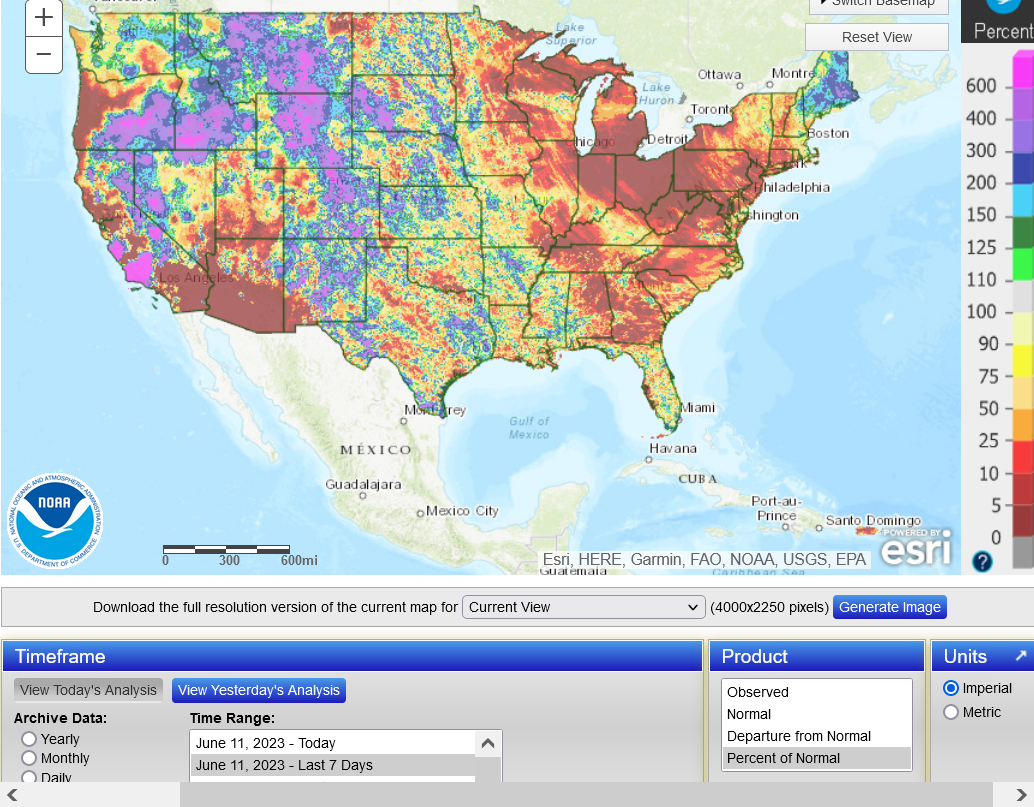
1. % Average rains the last week
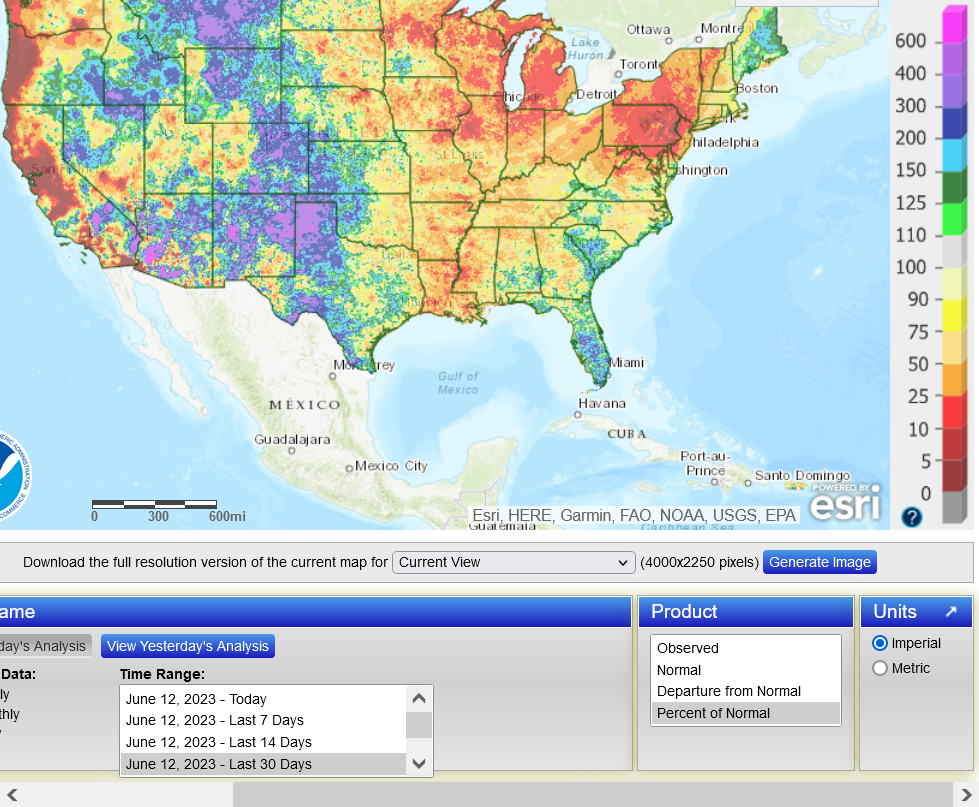
2. % Average rains the last 30 days
https://water.weather.gov/precip/
++++++++++++++
+++++++++++++++++
7 day temps last week. HEAT, increasing stress except in the ECB(which was dry last week-got a bit of rain today)
https://www.cpc.ncep.noaa.gov/products/tanal/temp_analyses.php

Soilmoisture anomaly:
These maps sometimes take a day to catch up to incorporate the latest data(the bottom map is only updated once a week).
https://www.cpc.ncep.noaa.gov/products/Soilmst_Monitoring/US/Soilmst/Soilmst.shtml#


++++++++++++++++++++++++++++
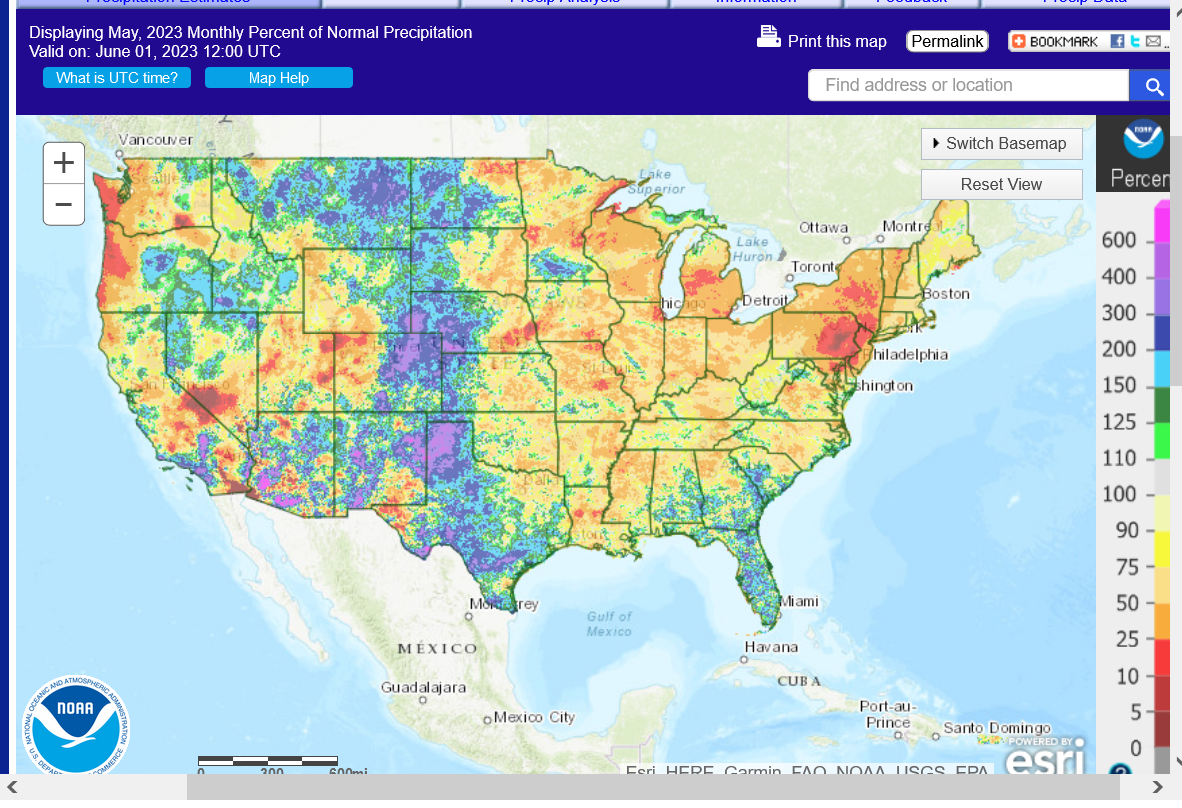
Final May precip map below
https://water.weather.gov/precip/
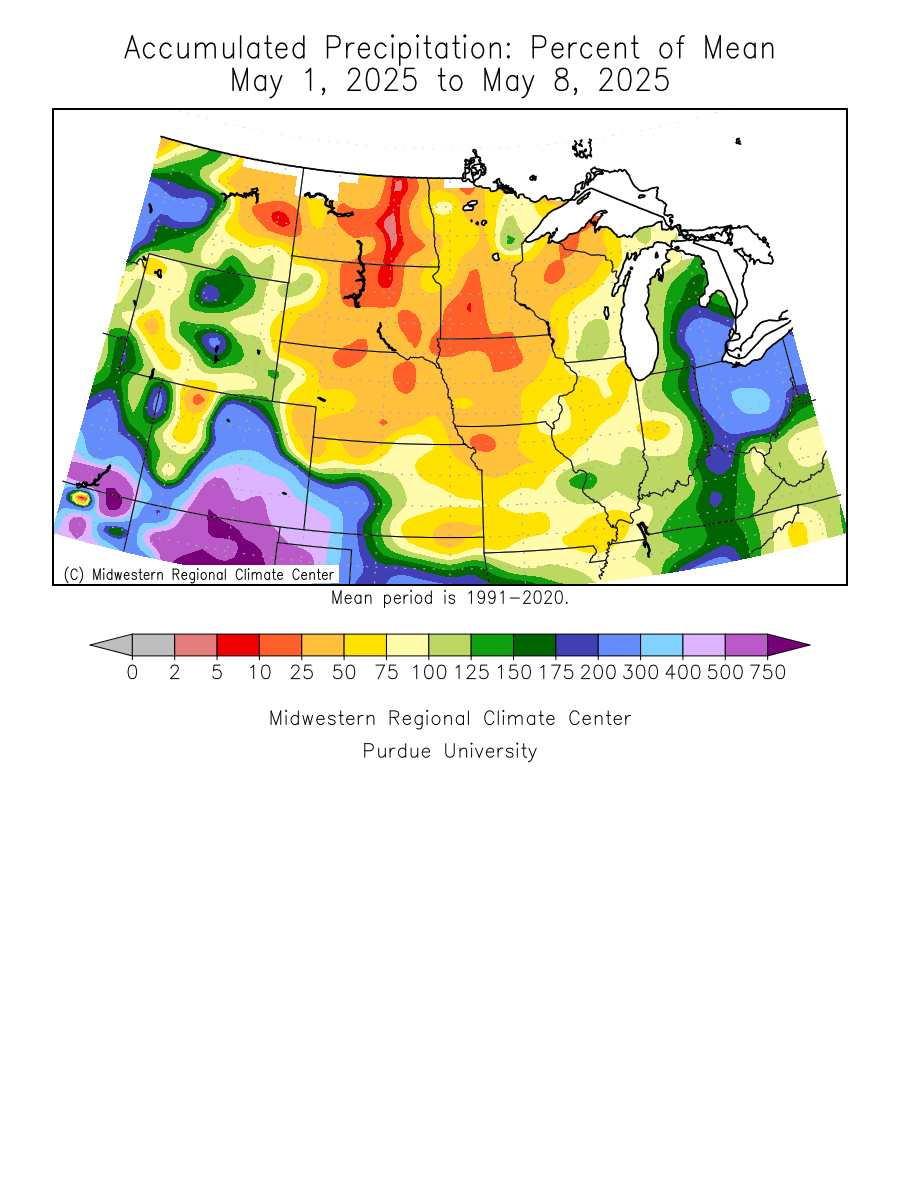
Updated daily below:
https://mrcc.purdue.edu/cliwatch/watch.htm#curMonths
Most of the severe drought in the West has been wiped out!
https://droughtmonitor.unl.edu/
Huge expansion of drought in the Midwest!!

Drought monitor previous years: You can see the natural La Niña, (cold water-in the tropical Pacific)causing the drought! Starting in 2020, then worsening for 2+ years!
Crop ratings for both C and S fell another 3% which was 1% more than expected.
Conditions for U.S. #corn and #soybeans drop 3 points each on the week (trade was looking for 2). Spring #wheat conditions fell but winter wheat ratings rose - winter wheat harvest is 8% complete.
U.S. #corn conditions fell 3 points on the week to 61% good/excellent (5yr average for the week is 70%). Many states contributed - lots of cuts across the board.
Same with #soybeans - condition scores fell in most major states. 59% good/excellent is the worst for the week since 2008, though not every year had ratings this week. The last time they were this low in June was 2019 (54% - late June).
Corn up sharply Monday, front month beans down sharply.
I made the mistake of being aggressively long July beans yesterday because my broker allows me to have massive leverage on day trades but only the front months.
Did ok on the corn but got killed on the beans.
Today, the July beans have been up 30c+!!! but I got out yesterday when they were collapsing lower.
July Corn on the other hand is reversing lower today and December barely hanging on to gains from Monday.
In typical weather markets, front and back month C and S all move in tandem and very strongly. New crop months will often be a bit stronger because the weather is impacting them the most.
This price dichotomy between C and S that has been a feature several times recently is pretty unusual and makes it extra challenging to trade.
You can nail the weather and the price move but pick the wrong one or pick the wrong day and end up losing money, like I did yesterday with the highly leveraged SN day trade!
Old crop/July corn is dropping far enough to be close to testing the upside break away gap open on Sunday Night.
This is a surprisingly weak price reaction.
I will guess that the market is fairly confident that the current El Nino will cause a huge increase in rains before the end of this month.
This is what happens in the vast majority of El Nino years.......but not all of them.
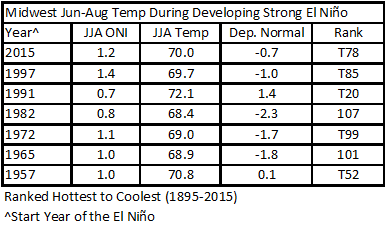
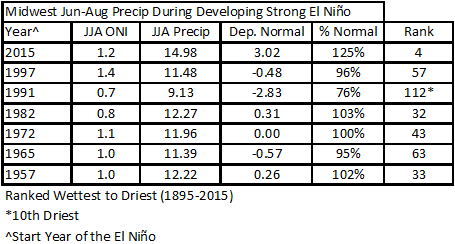
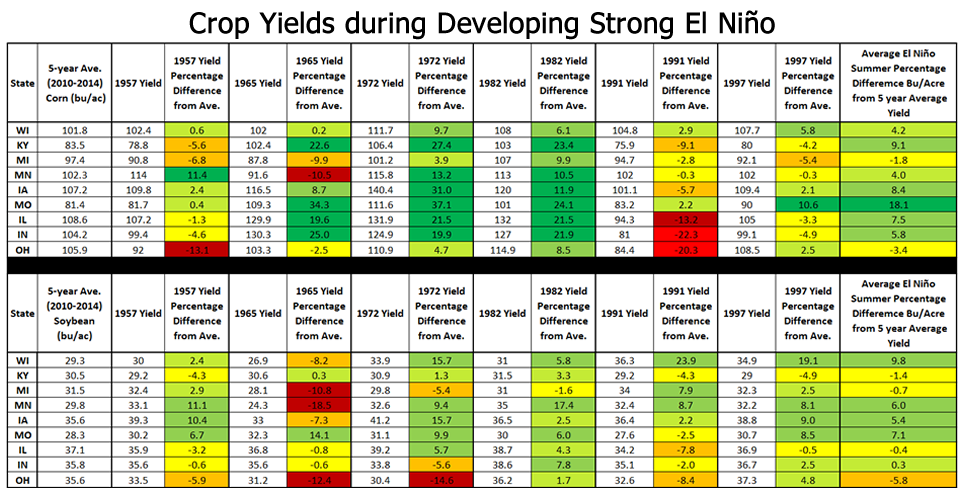
Only 1 year, 1991 featured notably hotter and drier than average growing season weather when there was a strong El Nino developing!!!
This greatly increases the odds for above trend yields this Summer for all crops in the Midwest and potential for RECORD yields.
https://mrcc.purdue.edu/mw_climate/elNino/impacts.jsp
with the bean co so tight a couple bu reduction is huge. We got kissed by a rain sunday, guess what, by today that rain is gone totally swallowed up by just how dry it was. It would not take much to reduce a 52bu/a gov prediction. I have seen and heard all spring about the slow pace of bean germination and emergance and can verify it was really slow in these parts. Good chance of rain today has produced squat. On the bright side August can make or break a bean crop easily
mcfarm,
Soybean emergence is 86% vs the average of 70% nationally.
In Indiana, 90% vs 71%.
https://release.nass.usda.gov/reports/prog2323.txt
I completely understand your point though that beans need moisture to germinate and will explain it for others.
You know this but non producers probably don't
Corn can be planted deeper than beans to reach soil moisture for germination when the top layer is bone dry.
Corn is usually planted first and this year, we still had decent soil moisture in most places during early corn planting, so germination was pretty good.
But this flash drought hit the past 30+ days when much of the soybean planting was occurring and moisture in the top layers for germinating completely dried up.
https://www.dekalbasgrowdeltapine.com/en-us/agronomy/planting-dry-soil.html
The crop condition report doesn't indicate any emergence issues but a flash drought over such a huge area in May/early June surely would do that. Note that on the first page above.
Here on my farm all fields are emerged in the report. The report is basically a drive by report (sighting made by FSA people) of an estimated number of acres showing plants expressed as a % of acres.
But the # of plants / acre is normally what farmers mean when they talk about poor emergence. For instance on 40 acres here we planted 140,000 seed hoping for 130,000 plants. Recent counts are about 75,000 to 82,000 this is considered to be poor emergence. Some say 80,000 is enough. I disagree. I think that the top yield is gone. Other fields are showing 130,000 ish populations.
Thanks much for the excellent explanation on emergence, cutworm.
Crop Progress and Condition Metadata
https://www.nass.usda.gov/Charts_and_Maps/Crop_Progress_&_Condition/Metadata/index.php
+++++++++
In the age of the internet, the deadlines for turning in the surveys has made them valid closer to the release of the data. In the 1990's and previous to that, we all assumed that the reports were for conditions LAST WEEK and a huge weekend rain just before the report came out on Monday, was not dialed in to the condition until the following week
Or when planting/harvest was proceeding at breakneck speed, the report was alway too low vs the REAL number. .
Tuesday market discussion:
CBOT November #soybeans hit one-month highs Tuesday, but mid-June was rough for soy bulls in the last two years.New-crop beans lost 8% in the three sessions ended June 23, 2022, and they lost 14% in the five sessions ended June 17, 2021.
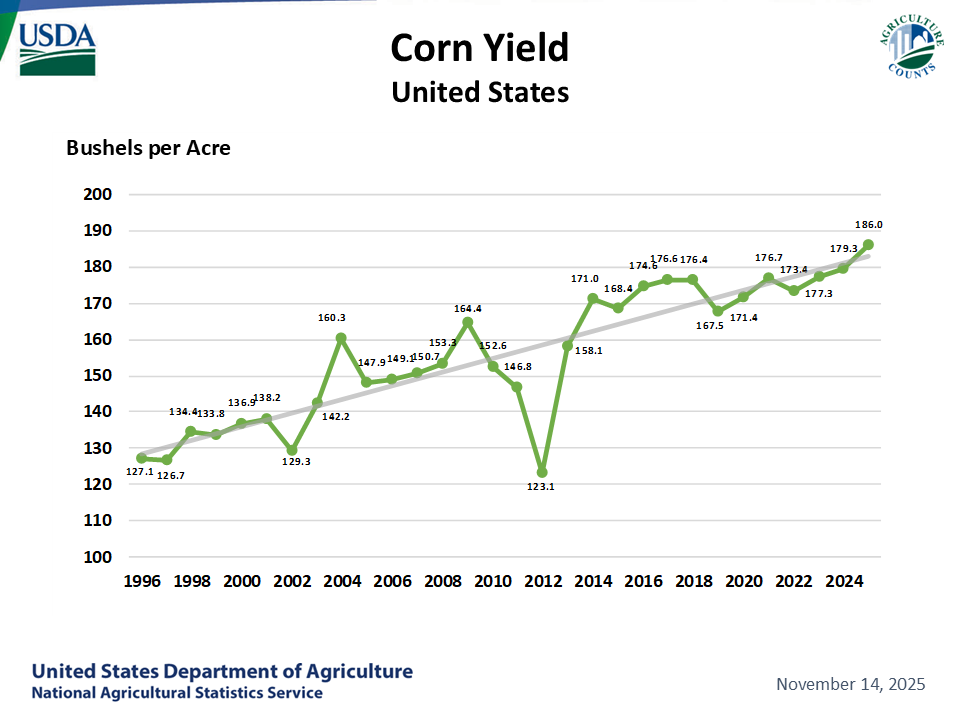
My point: the #corn market still did not realize it was in 2012 as of mid-June 2012, evident by this chart. But it did before the month was over, as end-of-June 2012 forecasts showed hot & dry conditions lasting into at least mid-July. The 2012 scenario is VERY rare, though.
This is why the 2013 comparison doesn't work with the US #corn crop. July-Aug 2013 was very dry in the Midwest (but overall a bit cooler than normal). That huge moisture anomaly in IL/IA definitely allowed corn to withstand dryness better - yield nationally was near average.
metmike: This is true. Here is southwest IN, we were in the epicenter of the drought in early June that I remember extremely well because I tilled up the backyard and reconfigured the irrigation system to turn my garden into a lawn, partly because I was spending so much time in Detroit after Mom's stroke, partly to be able to sell the house at some point and looking ahead.
In 2023, my body with Ehlers Danlos and other issues could never do a job like that anymore. In July 2012, while in Detroit much of the time I remember thinking that the garden I had the past 2+ decades would have been decimated.
Perfect timing....for me at least. Not for producers who have to face potential extreme weather adversity every year.
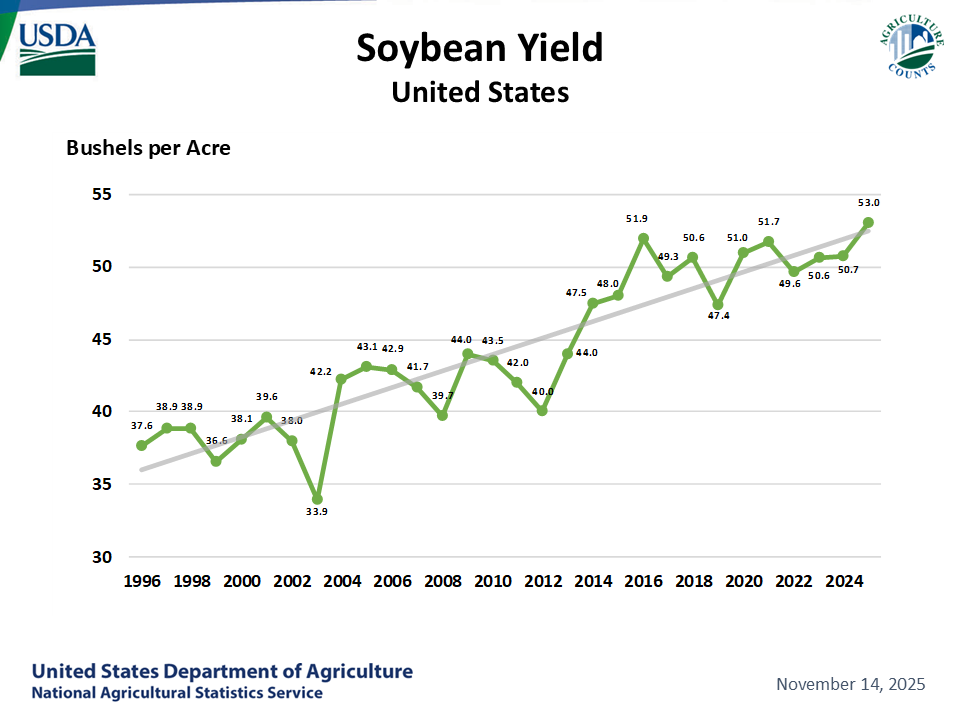
In 2012, we also had an El Nino kicking in but it happened LATER in the Summer. We had one of the wettest Aug-Oct periods here. It greatly helped the beans, that hung on all Summer and amazingly, flowered like crazy after the rains came in August(on tiny/stifled plants) and prevented a complete disaster but the corn was already toast. It pollinated during extreme heat/drought in all of July and had tremendous losses from heat fill before rains came much too late.
Look at the difference in the 2012 yield dips below, based entirely on that weather.
https://www.nass.usda.gov/Charts_and_Maps/Field_Crops/soyyld.php
https://www.nass.usda.gov/Charts_and_Maps/Field_Crops/cornyld.php
From this assessment earlier:
https://www.marketforum.com/forum/topic/96234/#96247
"However, CNs gap is from 608-609 and we closed -5c at 612. With the weather pretty bullish today and SN +30c much of the time, this is a strong indicator that front month corn is running out of steam.
A gap lower tonight, unfilled would put in an island reversal lower for CN which is a really REALLY bad/bearish technical formation."
+++++++++++++
We did small gap open lower and have dropped to lower than that Sunday Night open and filled any tiny remaining bullish gap for CN.
Currently -4c for CN and at the moment, looking pretty bearish but the other months and every month for S is looking BULLISH.
CZ is only -2.5c and still holding the very bullish technical formation. However, bull markets are almost always led by the front month.
Don't be long either C or S if rains continue to increase but its a weather market.
If we come in next week with no rain, all the markets will go nuts like they did in 2012......until rains show up in the forecast.
+++++++++
In a weather market, technical formations are only valid when the weather stays the same.
Changes in the weather forecast ALWAYS TRUMP what the price did yesterday which tells us what the market thought about the weather forecast YESTERDAY!
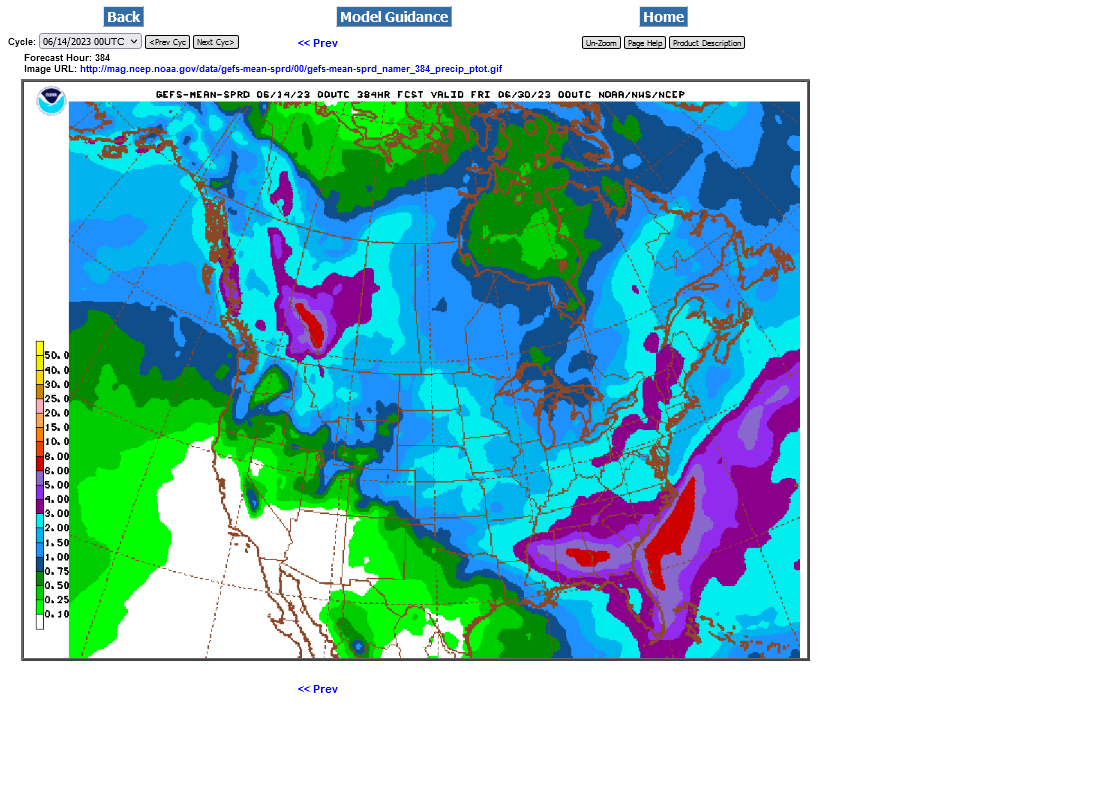
Just out 18z GEFS rain for 2 weeks.
Not extremely bearish but not very bullish either.
With the heat coming and skinny rains in the central belt with crop that has very low soil moisture, it will be just barely hanging on.
Timely rains can keep it going but this is certainly not going to make trendline unless rains pick up............and they should if the El Nino analog kicks in.

Was looking at some different price charts and maybe the low tue and high tonight are not quite a gap but the a couple of ticks difference in a weather market technical indicator don’t mean diddly squat.
Rains just increased a bit more overnight: 2 weeks 0z GEFS below.
CN has just reversed higher again and completely negated the negative technical picture based on the previous analysis.
Vegetation Index compared to 1 year ago on the same date.
Southwest to S. Plains greened up.
Midwest browner colors. This doesn't mean that its actually brown. The shade only represents the difference from last year. Browner shade = LESS green in reality.
Blue/Green shade = MORE green/less brown in reality.
Asia is looking really brown in most areas. China and India's crops could be suffering from droughts?
https://www.star.nesdis.noaa.gov/smcd/emb/vci/VH/vh_browse.php

Re: INO Evening Market Comments
By metmike - June 14, 2023, 8:10 p.m.
Thanks tallpine!
12z EE was drier after the close so we're up in early trading:
+++++++++++++++++++++++++++++++++
Early June 15:
https://www.marketforum.com/forum/topic/96305/#96307
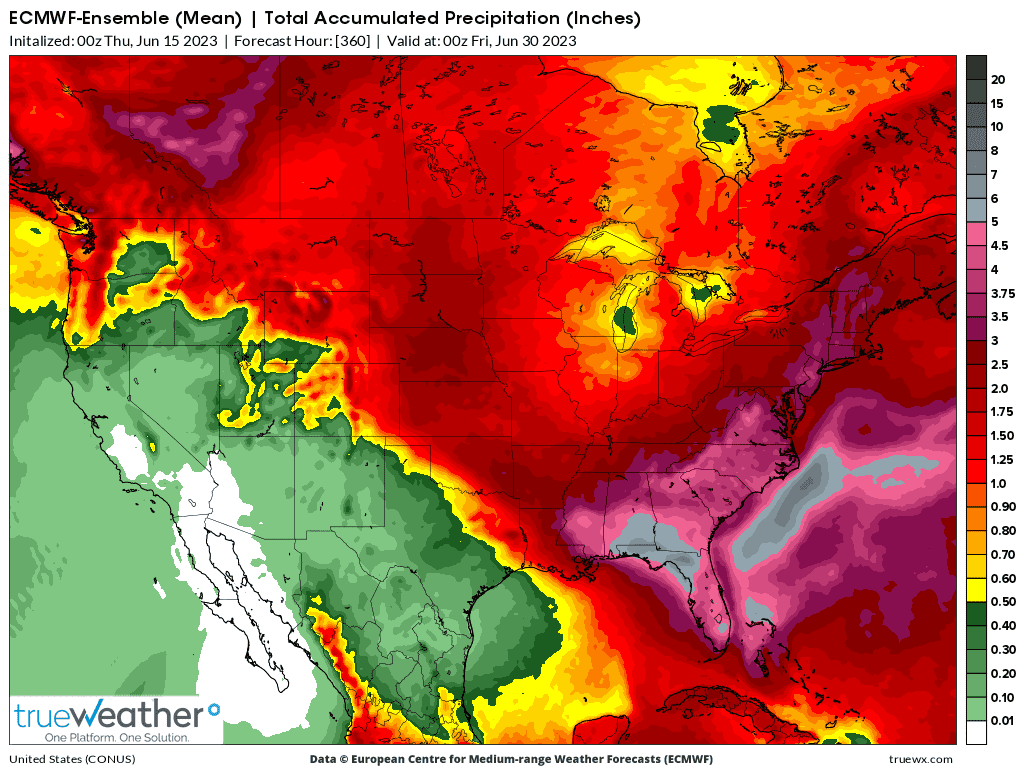
As mentioned yesterday afternoon, the EE took rain out of the forecast and that continued overnight.
Re: INO Evening Market Comments
By metmike - June 15, 2023, 6:47 p.m.
Thanks much tallpine!
As mentioned the last 2 updates, the drier forecast, especially EE got the grains fired up today.
Here's the 7 day rains from the NWS and the last 12z EE 2 week rains(which is about the same to a very tiny bit wetter but still bullish).
We've come a long way pretty quickly. If that hole in the rains starts filling in, we'll come back down pretty quickly. That could happen over night and even more likely, over a weekend.
This is a very unusual, probably temporary blocking pattern that is not shutting down the rains like the 2012, 1988 or most other Cornbelt domes did in the Summer.
It's going to cause the rains to dry up/lose support heading to the Mississippi River.
There is no rain suppressing dome this time.
If/when this temporary dynamic causing that is removed, El Nino driven rains will have a good chance to march east across the entire belt.
The end of week 2 has often suggested it will break...........but then the break never gets closer........so the models may be missing something.
If we don't have more rain in next weeks forecast, we can go much higher especially with heat, so don't let my current bias right now impact you.
That bias, is to look for a place to sell when rains increase in the forecast and to avoid a long weekend position of any kind.
tjc likes to buy options but they are probably massively overpriced here.
The markets being closed on Monday for the new national holiday "Juneteenth" are the worst time imaginable for the grain markets. I don't have a problem with this holiday but it REALLY, REALLY hurts all trading interests, some in a huge way in a year like this.
Weekends are already extremely risky and bad enough but adding an extra day makes it impossible to consider holding a position unless you want to risk many thousands more on a position.
7 Day Total precipitation below:
http://www.wpc.ncep.noaa.govcdx /qpf/p168i.gif?1530796126

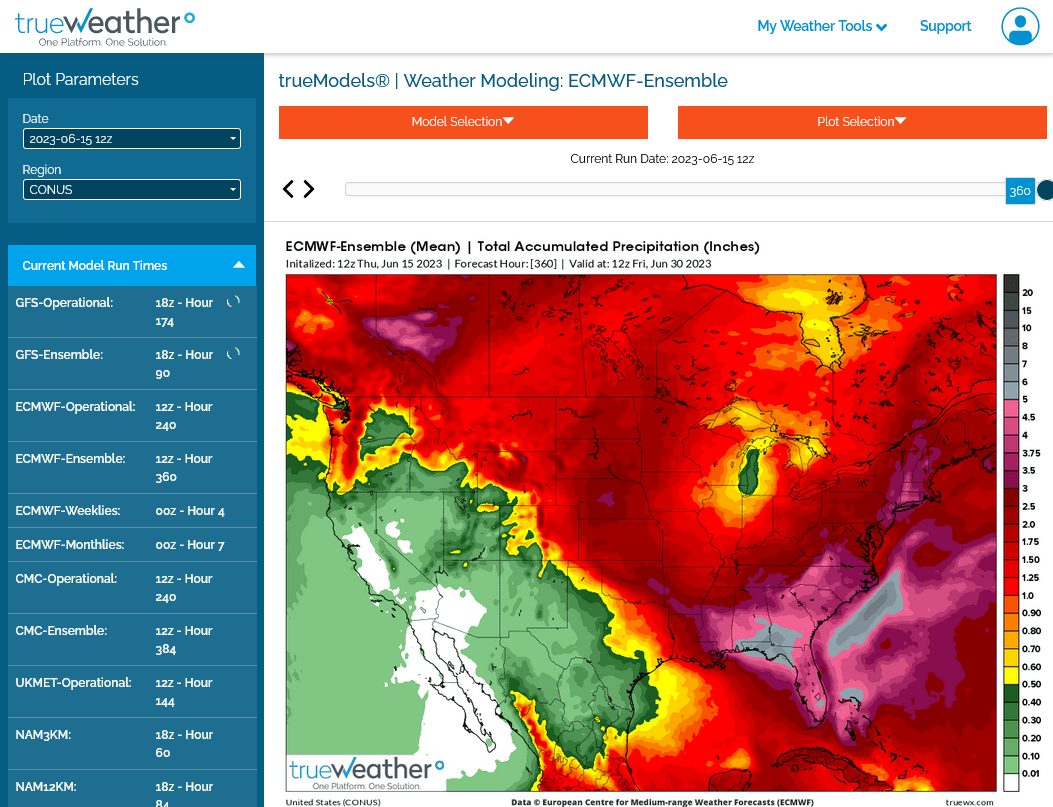
Overnight 0z EE was still pretty bullish. 2 week rains below.
Be careful............long weekend and the market will be closed for over 72 hours before opening again next Monday at 7pm.
A small change could result in the heavier rains in the Plains into MN and w.IA/MO spreading farther east into the spots that have lighter amounts on the maps right now.
The El Nino forcing is likely to take over by the end of this month and wet things up............but not every El Nino year is like that.
I'm not smart enough to know what will happen and not even smart enough to know what the weather models will show in just 3 days with this particular pattern/set up. The rains barking at the door of the WCB and this NOT being a blocking DOME like other major droughts years means tremendous uncertainty late this month.
The tenaciousness of this dry pattern the past 40 days is something to dial into expectations. However, the El Nino was not as well developed yet and the models are not going to be able to see other forcing factors with much skill 2 weeks out.
The northern stream, INDEPENDANT of the El Nino southern stream is the wild card. It can deflect the El Nino influence (the source region for El Nino forcing is the eastern/central tropical Pacific which is many thousands of miles away- a -NAO upper trough in E.Canada, for instance could completely deflect the El Nino moisture/teleconnection in the Midwest) and probably why the weather in an El Nino year can end up NOT being favorable for the Cornbelt.
https://www.marketforum.com/forum/topic/96190/#96227

Many in the trade today will be positioning for what they think the weather models will show on Monday evening, when trading resumes.
The crop ratings WILL drop on Tuesday.
The lack of intense heat as we'd see with a dome of death will keep the ratings from dropping off of a cliff. There was some rain this last week too but not enough to maintain yield potential.
Good morning, MarketForum
MetMike has given some VERY valuable trading advice. My worst loss was long over a 3 day July 4 weekend. Bullish weather forecasts had driven grain prices higher from Tuesday into Friday close----never going to rain (ever) again! Forecasts changed Monday afternoon and the Tuesday morning open was a complete shock, and it was not over until Wednesday. That was years ago, but the sting is still vivid.
I am not going to give a buy or sell recommendation, merely echo Mike's precaution. Yes, Monday night could be 1500 or 1350, I do not know.
I do know, July beans were 1300 on the May 31 close, last Friday around 1386, and now 1445.
What I will do is close my NGN long position today, either being stopped out on a new daily low OR (hopefully) 2.618.
Trade well
Congrats on your July ng profit, tjc and thanks for your wise words along with that being shared here.
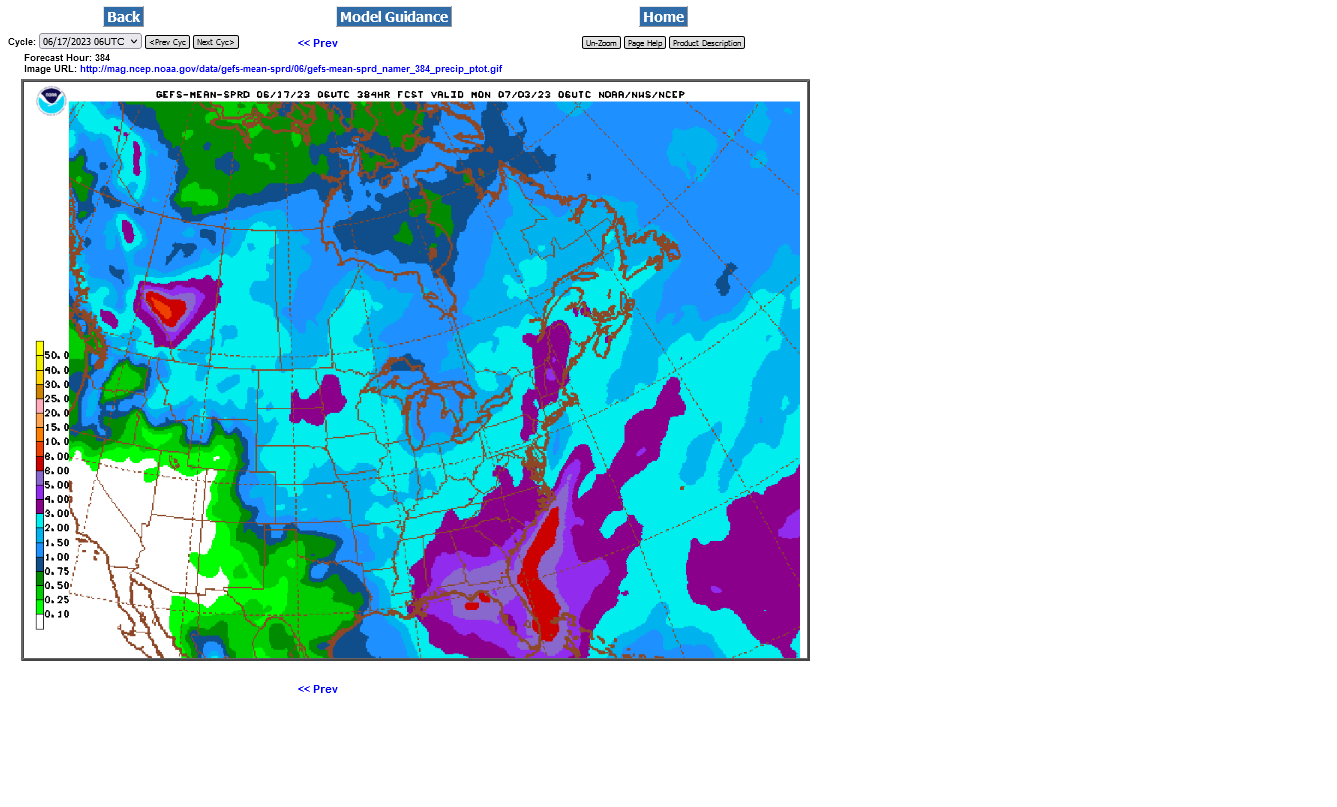
This was the last 6z GEFS below. It was WETTER for the northwest belt but DRIER for the eastern belt.
It doesn't take much imagination to see the wet rain bands shifting a couple of states eastward in 1 day........and the markets will be closed for 3 days!
The wet El Nino analog is likely to kick in late this month and cause that..........BUT IT MIGHT NOT!
The market was assuming that until this week, when it started dialing in yield loss potential from continued dryness on models that recognize a short term block that is NOT a dome of death type upper level ridge responsible for most Cornbelt droughts in the Summer.
The biggest initial moves up after a bottom like this often come from short covering. In this case huge fund positions with thousands of short contracts put on for many weeks based on expectations of a huge new crop in the ground that were covered from technical indicators reversing up this week.

Added: The GEFS has been TOO WET on most solutions and the EE has had better skill predicting rain the past 30 days. So the solution above, is likely TOO WET but again, the El Nino analog agrees(this just means that whenever there's an El Nino is the Summer, the very powerful influence that these warm temp anomalies in the key part of the tropical Pacific which impacts global weather has resulted in X, Y and Z weather downstream when we average all the previous El Nino years together.
Re: INO Evening Market Comments
By metmike - June 17, 2023, 9:24 a.m.
Thanks tallpine!
The models were initially all staying pretty dry in the ECB yesterday evening/overnight..then the just updated 6z GEFS came out...........which is the 1st one to finally break thru this block with the El Nino jet/moisture.
It's just one solution. It's either on to something or being misled. Markets are closed for the next 60 hours so this means nothing. Unless you're aggressively long, then its a reason to start sheeting your pants worrying. Been there done that but not this time.
Anyway, it might be wrong and grains still have tremendous upside in that case.
6-10/8-14 day slightly wet for most of the Cornbelt.
Markets don't open for 2 days and this guidance is weekend automated guidance so take it with a grain of salt until the EE turns wetter. It still only has an inch of rain in 2 weeks for the ECB.

Rest of the weather below.
Latest discussion here:
https://www.marketforum.com/forum/topic/96382/
Money managers thru June 13 massively covered shorts in CBOT #corn & #soyoil - flipping to net longs in both. June 13 positions in fut&opt (vs week earlier): Corn: net long 2.1k (was net short 44.5k) Soyoil: net long 8.7k (was net short 18.3k)#Soybeans: net long 47.9k (was 14k)