I realize you mentioned this in another thread met Mike.. But wow . I don't remember the two going so significantly in opposite directions.. Just shows the market extremity in general. Also I don't recall a time when soybeans were trading at nearly 3:00 to 1:00 as the corn ratio.. Even though it's not as wide in the new crop.. regardless I think the dollar 30 drop from the beginning of the week in corn was a bit overdone.. I realize the entire rally was predicated on the weather.. But still.. wheat and soy well above recent lows . And literally a magnificent drop in the last 4 days in corn ..taking what would have been a positive month back into negative territory.. Just wow again
Great post. Thanks. I used to follow grains more closely back in the day. I've never seen a divergence like that. What the heck does corn cause cancer and beans cure it or something?....
My internet has been down from storms so I can’t copy stuff but agree that this is a great post.
See our USDA thread for the explanation for yesterdays amazing day.
Shocking USDA planted acres report out yesterday:
I've stated this numerous times before in the past 20 years.
The number of shocking reports that come out from the USDA strongly suggests somebody messaging the numbers to get rich on the release.
I realize the inputs come from so many independent sources that make it seem impossible and I'll never be able to prove it but there are parts of the process that some of us don't know much about.
Here's the essence of my case:
1. The USDA is supposed to be getting closer and closer to the REAL number as the season goes on. Usually, the worst number is the first number because additional data allows you to update closer to the REAL number. I like to make an analogy of using a gun with messed up siights to try to make a bullseye in the center of a distant target. If the first shot is 2 feet to the left of the bullseye, the shooter knows to adjust the sight slightly to the right.
The most important objective is to get CLOSER to the bullseye. This is the job of the USDA, get closer and closer to the crop estimates bullseyes. They are providing these numbers for buyers and selling to make multi billions of dollars worth of decisions. Producers on what to plant and how much to sell at what prices. Same thing with end users pricing their purchases and both groups hedging risk well into the future. The USDA is THE almighty source that completely controls the key data which the market will use to trade prices. If you disagree with their numbers and trade YOUR numbers and your numbers are right.................you will be run over by the market. They are the grains fundamental number bible.
Back to target practice. A skilled marksman with a gun sight to the extreme left, will always be less extreme left on the 2nd shot and never be even farther off the target to the right on their 2nd shot. If thats not the case, then something is really wrong. It can happen of course but, again, if it happens a lot of the time, then we can't call that person a skilled marksman.
In observing the USDA reports for 3+ decades, I have noted numerous times when reports come out, that represent big adjustments to their previous report which takes them from the left side of the bullseye to the right side..........when everybody in the market assumed LESS adjustment. Sometimes, when they report the biggest changes from the previous report, they end up taking some of it back.
This is the thing they need to avoid as much as possible in their objective to getting closer to the bulleye FROM THE SAME SIDE as the previous shot to damage less people in the market who's multi billion dollar decisions are riding on what side of the target you hit.
If you want to maximize damage to traders......your shots go from one side of the target to the other side.
If you want to maximize profits from insider trading this is exactly how to go about it. They would never be dumb enough use the information for an account that can be tracked to them. It would be a piece of cake to pass the sneak preview information on to somebody else, who would pay them a handsome fee for the information.
I realize the safeguards the USDA has in place to keep people from knowing the final number and doing this sort of thing.
If they are 100% honest, then the data is the data and they can't hold back.
2. However, here's my most compelling piece of evidence. These multi billion dollar entities that make a living on the price of grains, conduct their own private surveys. THEY HAVE SATELLITE PIX. There are company's that specialize in this that can count bean/corn fields using the latest technology/information that are pretty accurate and sell their services. They have everything the USDA has except the private surveys from their USDA sources.
This isn't 1963 or even 2013, where the USDA surveys are heads and shoulders better than what the market has.
In this environment, it just seems impossible to imagine how EVERY very reliable private crop estimator can be so far off.
In other words, bean acres much lower than every single crop estimate from all the other reputable firms in this age of enormous technology being used for knowledge and money making.
This particular extreme for this specific report for 2023 seems way too extreme for the beans. I assure you that many people will be questioning the USDA on it but the market will use it to trade prices.
Considering the planting conditions and prices, one can make a case for corn acres to jump this much.
However, beans in the teens, along with cheaper input costs than corn, didn't exactly turn off producers against planting beans.
Couldn't agree more.. Question is.. Did the markets overreact heading into a weekend...or will they continue feeding on those numbers
cc,
Great question. It's going to take several days for the markets to settle down after such a shocker.
It's hard to imagine that beans will keep going higher and corn lower for more than a very short period.
It's more likely that the spread could tighten/correct than anything but it will never be at the ratio it was before the report the next several months.
By Karen Braun
+++++++++++++++
The graph below shows us how insane this was close to average.
The S/C ratio earlier this year, when producers were making planting decisions
·
Here's that in context of all the years since 1997. The four standout elevated years are 2005 (dark green), 2016 (dark red), 2009 (light blue), 2003 (navy).
+++++++++++++++++++
Fertilizer prices, which mostly impact corn input costs, were still historically high earlier this year when producers were making planting decisions and purchases. This still favored beans over corn.
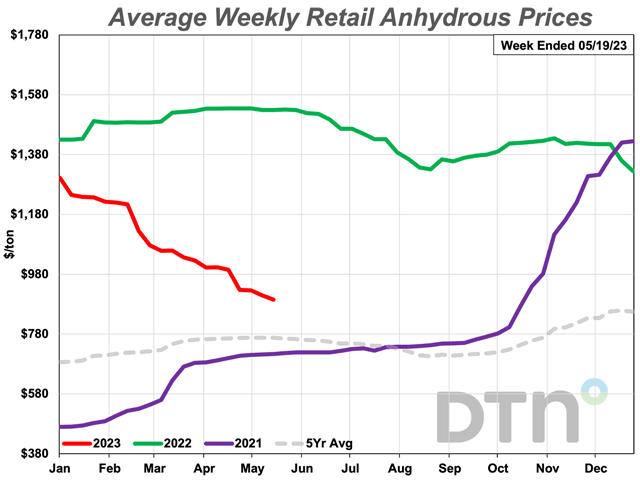
I'll let our producers speak for themselves on this but it seems the decision to plant corn was made BEFORE the price of nitrogen/anhydrous plunged, as seen below.
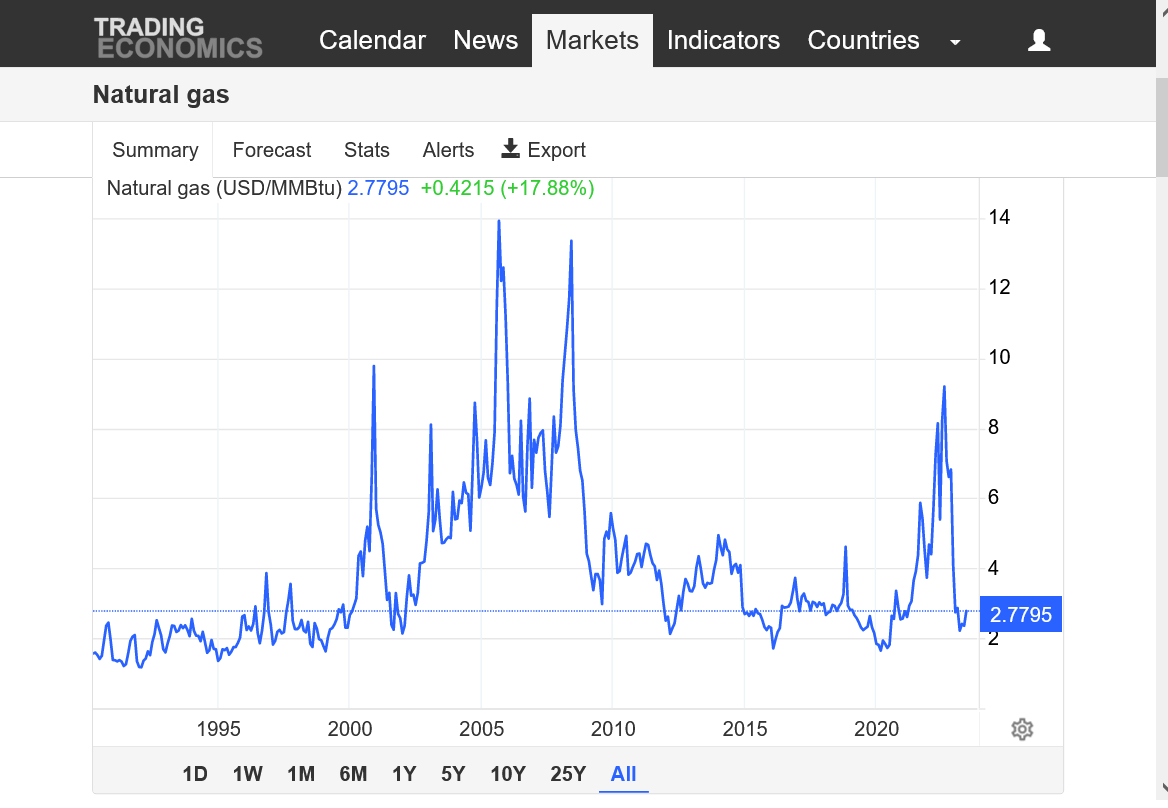
However, much lower ng prices than last year(used to make fertilizer) were telling the market that these lower prices were coming.
Was that a factor?
https://www.dtnpf.com/agriculture/web/ag/crops/article/2023/05/24/fertilizer-prices-lower-third-week

Does weather even matter anymore? It was pretty bearish looking Friday
Weather is still bearish but there's still 2 months to go in the main growing season.
Last 18z GEFS.

I've had 6 inches of rain total the last 3 days here in southwest IN!
https://water.weather.gov/precip/

Here at my farm we had 1.2 inches the last 2 days. During June we had 2.9 inches, including a local shower that only covered 1/2 of my county and yielded 1.8 inches of that on June 10-11.
The soil moisture is 100 mm (about 6 inches) short of normal as of July 1
Thanks, cutworm!
Should be more on the way, although the models and forecasts are shifting amounts and locations.
Northwest flow which will dominate, is always tricky.
Last 6z GEFS
7 Day Total precipitation below:
http://www.wpc.ncep.noaa.govcdx /qpf/p168i.gif?1530796126

After analyzing this more, the dynamics going on with fertilizer could have been a factor in the magnitude of this shift.
After record high fertilizer prices/costs last year because of extremely high ng prices, the price of ng came crashing down late last year and the markets knew this would result in fertilizer prices/cost crashing down this year. ........with a lag in time but this was a certainty.
Fertilizer cost is much higher for corn than beans and cut corn acres in 2022. Did the expected drop in 2023 cause corn acres to explode higher after being suppressed? Many producers like to rotate between corn and beans and the rotation was tilted towards more bean acres in 2022, then it snapped back hard in 2023.
++++++++++++++++++++++++++++
Published: Aug 31, 2022
Update: Soaring Natural Gas Costs Slow European Nitrogen Fertilizer Production Again and Push Up Costs
https://www.nutrien.com/what-we-do/stories/explainer-whats-driving-cost-fertilizer
+++++++++++++++++++++++++++++++
1. NG-1 year
2. NG 30+ years
3. Price of nitrogen/anhydrous. Record high in 2022, then plunged lower, starting in January 2023 around 4 months AFTER natural gas prices started to crash lower, which started in Sept 2022.
https://tradingeconomics.com/commodity/natural-gas


https://www.dtnpf.com/agriculture/web/ag/crops/article/2023/05/24/fertilizer-prices-lower-third-week

Here's a study that analyzes this ratio with great insights.
https://farmdocdaily.illinois.edu/2021/03/soybean-corn-ratios-since-1974.html


A key price ratio for the US crop sector is the soybean−corn price ratio. Despite notable changes in supply and demand for the 2 largest acreage US field crops since 1974, the ratio has exhibited no discernible time trend. It does however exhibit considerable variation from year to year.
Unsurprisingly, due to the growth in soybean acres the ratio of soybean to corn acres has trended up over time. In contrast, the ratio of soybean to corn yield has trended down as yield has increased slightly faster for corn. The slightly faster growth in corn yields mean that slightly fewer acres need to move into corn than into soybeans if demand for corn and soybeans grows at the same percent rate.
The soybean-corn yield ratio can vary substantially from its usual relationship. This variability is a risk associated with selecting which crop to plant. It may have greater importance in 2021 as lower stocks mean higher price variability, making income foregone from choosing the crop that’s ends up with the lower income potentially larger in 2021. Enhanced risk may affect cropping decisions, cropping practices, crop insurance decisions, and forward pricing decisions.
Shifting bullish or bearish?
soy continues the surge
Bearish weather finally took a toll on the beans after the market has mostly dialed in the shocking bullish number.
Crop conditions 7-3-23