https://www.cnn.com/2023/07/10/weather/northeast-storms-flooding-excessive-rainfall/index.html
Rainfall in West Point, New York, totaled more than 7.5 inches in six hours Sunday afternoon, according to preliminary data from the National Oceanic and Atmospheric Administration. That’s a 1-in-1,000 year rainfall event for the area, according to a CNN analysis of NOAA’s historical rainfall frequency data.
A once-in-a-millennium rainfall event is one that is so intense, the chances of it happening in any given year is just 0.1%.
Reading, Pennsylvania, received 5.35 inches of rain Sunday, shattering its old daily rainfall record of 3.47 inches, set in 1952.
Areas across New England could see 3 to 5 inches of rain Monday, which could bring rainfall totals for this storm up to 12 inches.
There's been so many 1 in 1000 year weather events, in the last year, that I'm completely losing track of them.
https://rogerpielkejr.substack.com/p/what-is-a-1000-year-flood
++++++++
With regards to climate change. It's funny that every single extreme weather event is looked at with regards to that in today's world. It's like natural weather that controls almost all of our weather has taken a back seat in most peoples minds.
Of course we're happy to objectively discuss it with respect to that!
We know that the new, slightly warmer atmosphere can hold 7% more moisture than the old atmosphere could.
We are dealing with the same natural weather systems, same physical laws and meteorology.........but super imposing 1 deg. C of warming and 7% more moisture on the old atmosphere.
It really boils down to this, once again(Cliff Mass can be counted on as an elite source for using objective, authentic science)
https://cliffmass.blogspot.com/2016/03/the-golden-rule-of-climate-extremes.html
The Golden Rule
Considering the substantial confusion in the media about this critical issue, let me provide the GOLDEN RULE OF CLIMATE EXTREMES. Here it is:
The more extreme a climate or weather record is, the greater the contribution of natural variability.
Or to put it a different way, the larger or more unusual an extreme, the higher proportion of the extreme is due to natural variability.
In places that got 6 inches of rain, we can guess that they might have only received 5.5 inches of rain with the old climate............all things being equal.
It's very telling when very heavy rain events are referred to as 1 in 1,000 year rains...........when they are only half the all time record for that state.
https://www.wunderground.com/cat6/Summary-US-State-Historical-Precipitation-Extremes

There's our 1 in 1,000 year rain below:
https://water.weather.gov/precip/

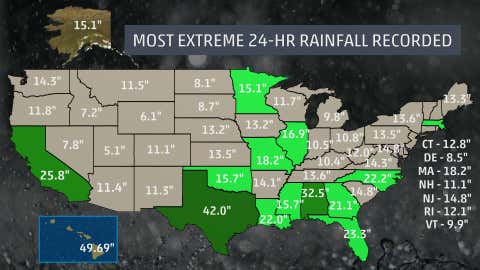
State record with graphics below. Delaware's was broken 7 years ago and is
https://weather.com/news/climate/news/extreme-rainfall-precipitation-recorded-50-states

++++++++++
US Rainfall Records
The map/link below shows rainfall records for the US for total rains, going from a time frame of 1 minute up to a time frame of 1 year. If you go to the link, you will see this better. It shows the date of occurrence for each of these 20 events. The surprise is that all of them occurred BEFORE 1983 and before man made global warming and climate change would have been a factor. I can't completely explain this as I had recently done a study on our local region going back 120 years that did show heavier rain events over the last 30 years with an especially big increase in the last 15 years..
I think that we have in fact had at least a slight increase in the # of extreme rain events, however, this shows that regardless of humans the really extreme events have always happened and will continue to happen.
http://www.nws.noaa.gov/oh/hdsc/record_precip/record_precip_us.html
| USA Records-HDSC/OWP www.nws.noaa.gov Disclaimers: Some data are estimates. Not all data have been verified. "*" indicates questionable veracity. Coordinates are approximate. |
Duration Amount (in) Location Start date
1-min 1.23 Unionville, MD 4 Jul 1956
5-min 2.03 Alamogordo Creek, NM 5 Jun 1960
12-min 2.30 Embarrass, WI 28 May 1881
15-min 3.95 Galveston, TX 4 Jun 1871
30-min 7.00 Cambridge, OH 16 Jul 1914 42-min 12.0 Holt, MO 22 Jun 1947
13.8* Burnsville 6 WNW, WV 4 Aug 1943
60-min 12.0 Holt, MO 22 Jun 1947
12.0 305 Kilauea Sugar Plantation, Kauai, HI 24 Jan 1956
90-min 14.6 Burnsville 6 WNW, WV 4 Aug 1943
2-hr 15.0 Woodward Ranch (D'Hanis), TX 31 May 1935
2.17-hr 19.0 Rockport, WV 18 Jul 1889
2.75-hr 22.0 Woodward Ranch (D'Hanis), TX 31 May 1935
3-hr 28.5 Smethport, PA 18 Jul 1942
4.5-hr 30.7 Smethport, PA 18 Jul 1942
12-hr 34.3 Smethport, PA 17 Jul 1942
18-hr 36.4 Thrall, TX 9 Sep 1921
24-hr 43.0 Alvin, TX 29.42 -95.24 25 Jul 1979
3,4,5 4-day 62.0 Kukaiau, Hamakua, HI 27 Feb 1902
8-day 82.0 Kukaiau, Hamakua, HI 28 Feb 1902
1-month 149 Mt. Waialeale, Kauai, HI 1 Mar 1982
12-month 739 Kukui, Maui, HI 1 Dec 1981
++++++++++++++++
However, there were a number of individual STATE rain records broken in 2018/19. with a 1 year anomaly/spike higher.
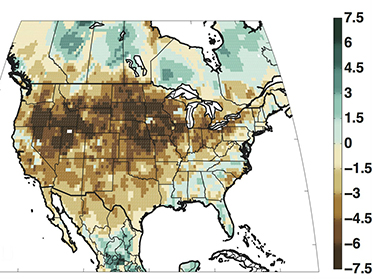
Since 1970, the US has been wetter, as seen on the graph below.
https://www.wunderground.com/cat6/Summary-US-State-Historical-Precipitation-Extremes

This can’t be repeated enough times:
It really boils down to this (Cliff Mass can be counted on as an elite source for using objective, authentic science)
https://cliffmass.blogspot.com/2016/03/the-golden-rule-of-climate-extremes.html
The GoldenRule
Considering the substantial confusion in the media about this critical issue, let me provide the GOLDENRULE OF CLIMATE EXTREMES ...
Here it is:
"The more extreme a climate or weather record is, the greater the contribution of natural variability.
Or to put it a different way, the larger or more unusual an extreme, the higher proportion of the extreme is due to natural variability."
https://www.ranker.com/list/worst-floods-in-history/eric-vega?page=4
1. August 1931 Yangtze River, China 3,700,000 killed
2. September 1887 Yellow River, China 2,000,000 deaths
3. June 1938 Yellow River, China 800,000 deaths
4. August 1975 Banqiao, China 230,000 dead
5. 1935 Yangtze River 145,000 dead
6. November 1530 St. Felix Flood, Holy Roman Empire/Europe 100,000+ killed
7. August 1971, Hanoi/Red Rivers, North Vietnam 100,000 dead
8. May 1911 Jiangsu-Anhui, China 100,000 dead
9. December 1287 Holy Roman Empire/Europe 50,000+ dead
10. September 1949 Guatemala 40,000 dead
11. June 1954 Yangtze River, China 30,000 dead
12. June 1974 Bangladesh 28,700 dead
13. January 1362 St. Marcellus Flood-Ireland/Britain/N.Germany 25,000+ dead
14. November 1570 All Saints Flood Netherlands 20,000+ killed
15. December 1999 Vargas mudslides Venezuela 20,000 dead
How many of these events took place in the last 40 years?
Answer= 1
How many were caused by climate change =0
How many were 6% worse because of climate change(1999) =1
Week of dangerous weather to continue across the US, as July warnings about the climate crisis intensify
https://www.theguardian.com/us-news/2023/jul/10/us-weather-floods-heatwave-climate-crisis-alerts
One person was killed in upstate New York as she was trying to leave her home and some in Ulster county said the flooding was the worst they had seen since Hurricane Irene, called the worst weather event in that county’s history, when it hit in 2011.
US atmospheric scientists warned that although the destruction in American states might seem distant from and unconnected to flooding disasters in India, Japan, China and Turkey this year, they have this in common: storms are forming in a warmer atmosphere, making extreme rainfall a reality right now. And the additional warming that scientists predict is coming will only make it worse.
“As the climate gets warmer we expect intense rain events to become more common, it’s a very robust prediction of climate models,” said Brian Soden, professor of atmospheric sciences at the University of Miami, adding: “It’s not surprising to see these events happening, it’s what models have been predicting since day one.”
A warmer atmosphere holds more moisture, which results in storms dumping more precipitation that can have deadly outcomes. Pollutants, especially carbon dioxide and methane, are heating up the atmosphere. Instead of allowing heat to radiate away from Earth into space, they hold on to it.
Rodney Wynn, a meteorologist at the National Weather Service in Tampa Bay, said: “Warm air expands and cool air contracts. You can think of it as a balloon – when it’s heated the volume is going to get larger, so therefore it can hold more moisture.”
++++++++++++++
The actual science tells us the atmosphere is holding 7% more moisture than it did 100 years ago because of the greenhouse gas warming of +1 Deg. C.
So areas that got 6 inches of rain, all things being equal, would have received 5.5 inches of rain with the atmosphere of 1923.
But what about the planet being 20% greener and cold still killing 15 times more people and 200 times more life in 2023?
The only reason we can feed 8 billion people is because of the massive benefits of climate change, featuring the best weather/climate in at least the last 1,000 years. Rescuing the planet from dangerously low levels of CO2, which is still only half of the optimal level for life.
Take away synthetic fertilizer made with fossil fuels as well as the atmospheric fertilizer/beneficial gas, CO2 and we would struggle to feed 4 billion people.
You want a REAL climate CRISIS?
This is what it looks like:
Can you imagine if this below happened today? It's less likely because climate change and the current climate OPTIMUM is helping to PROTECT US!
The planet had a REAL climate crisis between 1876 and 1878.
50 million people died. 3% of the global population died from that real climate crisis!
https://news.climate.columbia.edu/2017/12/15/causes-great-famine-drought/

https://ui.adsabs.harvard.edu/abs/2017AGUFMGC51F..04S/abstract
The 1876-1878 Great Famine impacted multiple regions across the globe including parts of Asia, Nordeste Brazil, and northern and southern Africa, with total human fatalities exceeding 50 million people, arguably the worst environmental disaster to befall humanity.
NASA EXPLAINS THE DUST BOWL DROUGHT
https://www.nasa.gov/centers/goddard/news/topstory/2004/0319dustbowl.html
A brief history of U.S. #corn yield growth since the 1860s Notable growth in yields was seen after the adoption of modern fertilizers in the 1940s, which made drought years esp. in the 1980s stand out more than before (compare with 1930s Dust Bowl for example).
++++++++++++++++++++++++++++
And the current climate crisis is somehow worse than the 1930's NATURAL climate crisis(an entire decade called the Dust Bowl)?
https://www.marketforum.com/forum/topic/56668/#56673

https://www.marketforum.com/forum/topic/67004/

https://www.marketforum.com/forum/topic/87422/#87425

Death by Greening:
https://www.marketforum.com/forum/topic/69258/
Energy transition is a hoax
Started by metmike - April 15, 2023, 5:50 p.m.
https://www.marketforum.com/forum/topic/94557/
We're pretending to be saving the planet with solutions that are the ones KILLING the planet. Note the name that scientists agreed on to refer to the last period WARMER than this.
Holocene Climate Optimum
Warmer than this by 2-3 deg. C in the higher latitudes between 9,000-5,000 years ago.
https://en.wikipedia.org/wiki/Holocene_climatic_optimum
Crony capitalism, political agenda, sensationalizing media (for ratings and ideologies) and corrupted science have colluded with most global governments (China/Russia/India want no part of it-with China increasing beneficial CO2 faster than everybody else's cuts) to manufacture a FAKE climate crisis for greedy self serving interests. Literally hundreds of trillions for the taking. Biggest scientific fraud in history by a couple orders of magnitude.