KEY EVENTS TO WATCH FOR:
Friday, August 11, 2023
8:30 AM ET. July PPI
PPI, M/M% (expected +0.2%; previous +0.1%)
Ex-Food & Energy PPI, M/M% (expected +0.2%; previous +0.1%)
Personal Consumption (previous +0.3%)
10:00 AM ET. August University of Michigan Survey of Consumers - preliminary
Mid-Mo Sentiment (expected 71.7; previous 72.6)
Mid-Mo Expectations (previous 69.4)
Mid-Mo Current Idx (previous 77.5)
12:00 PM ET. World Agricultural Supply & Demand Estimates (WASDE)
Corn, End Stocks (Bushels)
Soybeans, End Stocks (Bushels)
Wheat, End Stocks (Bushels)
Cotton, End Stocks (Bales)
Tuesday, August 15, 2023
8:30 AM ET. August Empire State Manufacturing Survey
Mfg Idx (previous 1.1)
Employment Idx (previous 4.7)
New Orders Idx (previous 3.3)
Prices Received (previous 3.9)
8:30 AM ET. July Advance Monthly Sales for Retail & Food Services
Overall Sales-SA, M/M% (previous +0.2%)
Sales, Ex-Auto, M/M% (previous +0.2%)
Sales, Ex-Auto & Gas, M/M% (previous +0.3%)
8:30 AM ET. July Import & Export Price Indexes
Import Prices (previous -0.2%)
Non-Petroleum Prices (previous -0.3%)
Petroleum Prices (previous +1.1%)
8:55 AM ET. Johnson Redbook Retail Sales Index
Ret Sales Mo-to-Date, Y/Y% (previous +0.3%)
Latest Wk, Y/Y% (previous +0.3%)
10:00 AM ET. June Manufacturing & Trade: Inventories & Sales
Total Inventories (previous +0.2%)
10:00 AM ET. August NAHB Housing Market Index
Housing Mkt Idx (previous 56)
4:00 PM ET. June Treasury International Capital Data
4:30 PM ET. API Weekly Statistical Bulletin
Crude Stocks, Net Chg (Bbls) (previous +4.1M)
Gasoline Stocks, Net Chg (Bbls) (previous -0.4M)
Distillate Stocks, Net Chg (Bbls) (previous -2.1M)
The STOCK INDEXES? http://quotes.ino.com/ex?changes/?c=indexes
The STOCK INDEXES: The September NASDAQ 100 was lower overnight and sets the stage a slightly lower opening when the day session begins trading. Stochastics and the RSI are oversold but remain neutral to bearish signaling that sideways to lower prices are possible near-term. If September extends the decline off July's high, the 25% retracement level of the 2022-2023 rally crossing at 14,789.53 is the next downside target. Closes above the 20-day moving average crossing at 15,575.05 would temper the near-term bearish outlook. First resistance is the July 19th high crossing at 16,062.75. Second resistance is the December-2021 high on the weekly continuation chart crossing at 16,659.50. First support is the July 10th low crossing at 15,063.25. Second support is the 25% retracement level of the 2022-2023 rally crossing at 14,789.53.
The September S&P 500 was slightly lower overnight as it extends the decline off July's high. Overnight trading sets the stage for a slightly lower opening when the day session begins trading. Stochastics and the RSI are oversold but remain neutral to bearish signaling that sideways to lower prices are possible near-term. Closes below the 50-day moving average crossing at 4473.23 is the next downside target. Closes above the 20-day moving average crossing at 4554.93 would temper the near-term bearish outlook. First resistance is July's high crossing at 4634.50. Second resistance is the March-2022 high crossing at 4714.75. First support is the 50-day moving average crossing at 4473.23. Second support is July's low crossing at 4411.25.
INTEREST RATES http://quotes.ino.com/ex changes/?c=interest"
INTEREST RATES: September T-bonds were slightly lower overnight. Overnight trading sets the stage for a slightly lower opening when the day session begins trading. Stochastics and the RSI are turning neutral to bearish signaling that sideways to lower prices are possible near-term. If September renews the decline off July's high, the October-2022 low on the weekly continuation chart crossing at 117-19 is the next downside target.If September extends the rally off last-Friday's low, the 20-day moving average crossing at 124-02 is the next upside target. Closes above the 20-day moving average crossing at 124-02 would signal that a low has been posted. First resistance is the 20-day moving average crossing at 124-12. Second resistance is the 50-day moving average crossing at 125-23. First support is last-Friday's low crossing at 119-25. Second support is the October-2022 low on the weekly continuation chart crossing at 117-19 is the next downside target.
September T-notes were slightly lower overnight and sets the stage for a slightly lower opening when the day session begins trading. Stochastics and the RSI are turning neutral to bearish signaling that sideways to lower prices are possible near-term. If September renews the decline off July's high, the October-2022 low crossing at 108.265 is the next downside target. Closes above the 20-day moving average crossing at 111.177 would signal that a short-term low has been posted. First resistance is the 20-day moving average crossing at 111.117. Second resistance is the 50-day moving average crossing at 112.090. First support is last-Friday's low crossing at 109.240. Second support is the October-2022 low on the weekly continuation chart crossing at 108.265.
ENERGY MARKETS? http://quotes.ino.com/ex?changes/?c=energy ""
ENERGIES:Septembercrude oil was steady to slightly higher in late-overnight trading as it consolidates some of Thursday's decline. Overnight trading sets the stage for a steady to slightly higher opening when the day session begins trading. Stochastics and the RSI are overbought but remain neutral to bullish signaling that sideways to higher prices are possible near-term. If September extends the rally off the June 28th low, the 75% retracement level of the 2022-2023 decline crossing at $88.47 is the next upside target. Closes below the 20-day moving average crossing at $79.89 would signal that a short-term top has been posted. First resistance is Thursday's high crossing at $84.89. Second resistance is the 75% retracement level of the 2022-2023 decline crossing at $88.47. First support is the 20-day moving average crossing at 79.89. Second support is the 50-day moving average crossing at $74.77.
September heating oil was higher overnight and sets the stage for a higher opening when the day session begins trading. Stochastics and the RSI are overbought but remain neutral to bullish signaling that sideways to higher prices are possible near-term. If September extends the rally off May's low, the June-2022 crossing at 3.2700 is the next upside target. Closes below Tuesday's low crossing at 2.9375 would signal that a short-term top has been posted. First resistance is Thursday's high crossing at 3.2310. Second resistance is the June-2022 high crossing at 3.2700. First support is Tuesday's low crossing at 2.9375. Second support is the 20-day moving average crossing at 2.9100.
September unleaded gas was higher overnight and sets the stage for a higher opening when the day session begins trading. Stochastics and the RSI are overbought but remain neutral to bullish signaling that sideways to higher prices are possible near-term. If September extends the rally off the June 23rd low, the October-2022 high on the weekly continuation chart crossing at 3.0221 is the next upside target. Closes below last-Thursday's low crossing at 2.7131 would confirm that a short-term top has been posted while opening the door for additional weakness near-term. First resistance is Thursday's high crossing at $2.9443. Second resistance is the October-2022 high on the weekly continuation chart crossing at $3.0221. First support is the 20-day moving average crossing at $2.8032. Second support is last-Thursday's low crossing at $2.7131.
September natural gas was slightly higher overnight as it consolidates some of Thursday's decline. Overnight trading sets the stage for a slightly higher opening when the day session begins trading. Stochastics and the RSI are neutral to bearish signaling that a short-term appears to have been posted with Wednesday's high. Closes below the 50-day moving average crossing at 2.609 would signal that a short-term top has been posted. If September extends the rally off last-Wednesday's low, the 25% retracement level of the 2022-2023 decline crossing at 3.193 is the next upside target. First resistance is Wednesday's high crossing at 3.018. Second resistance is the 25% retracement level of the 2022-2023 decline crossing at 3.193. First support is last-Wednesday's low crossing at 2.457. Second support is the June 1st low crossing at 2.249.
CURRENCIEShttp://quotes.ino.com/ex changes/?c=currencies"
CURRENCIES:The September Dollar was steady to slightly higher overnight and sets the stage for a slightly higher opening when the day session begins trading later this morning. Stochastics and the RSI are overbought but remain neutral to bullish signaling that sideways to higher prices are possible near-term. If September extends the rally off July's low, July's high crossing at $103.275 is the next upside target. Closes below last-Friday's low crossing at $101.550 would signal that a short-term top has been posted. First resistance is July's high crossing at $103.275. Second resistance is May's high crossing at $104.205. First support is last-Friday's low crossing at $101.550. Second support is the 20-day moving average crossing at $101.392.
The September Euro was mostly steady overnight and sets the stage for a steady opening when the day session begins trading. Stochastics and the RSI are turning neutral to bullish signaling that sideways to higher prices are possible near-term. Closes above the 20-day moving average crossing at $1.10733 would signal that a short-term low has been posted. If September renews the decline off July's high, July's low crossing at 1.08715 is the next downside target. First resistance is the 20-day moving average crossing at $1.10733. Second resistance is the July 27th high crossing at $1.11770. First support is July's low crossing at 1.08715. Second support is May's low crossing at 1.07025.
The September British Pound was higher overnight and sets the stage for a higher opening when the day session begins trading. Stochastics and the RSI are turning neutral to bearish signaling that sideways to lower prices near-term. If September renews the decline off July's high, the 50% retracement level of the March-July rally crossing at 1.2508 is the next downside target. Closes above the 20-day moving average crossing at 1.2831 would signal that a short-term top has been posted. First resistance the 20-day moving average crossing at 1.2831. Second resistance is the July 27th high crossing at 1.2999. First support is the 38% retracement level of the March-July rally crossing at 1.2658. Second support is the 50% retracement level of the March-July rally crossing at 1.2508.
The September Swiss Franc was steady to slightly lower overnight as it extends the trading range of the past two-weeks. Overnight trading sets the stage for a slightly lower opening when the day session begins trading. Stochastics and the RSI are oversold but remain neutral to bearish signaling that sideways to lower prices are possible near-term. If September extends the decline off July's high, the 50-day moving average crossing at 1.13945 is the next downside target. Closes above the 20-day moving average crossing at 1.15614 would signal that a short-term low has been posted. First resistance is the 20-day moving average crossing at 1.15614. Second resistance is the July 18th high crossing at 1.17650. First support is the 50-day moving average crossing at 1.13945. Second support is the June 30th low crossing at 1.11790.
The September Canadian Dollar was lower overnight and sets the stage for a lower opening when the day session begins trading. Stochastics and the RSI are oversold but remain neutral to bearish signaling that sideways to lower prices are possible near-term. If September renews the decline off July's high, the 62% retracement level of the March-July rally crossing at $74.01 is the next downside target. Closes above the 20-day moving average crossing at $75.38 would signal that a short-term low has been posted. First resistance is the 10-day moving average crossing at $74.88. Second resistance is the 20-day moving average crossing at $75.38. First support is the 62% retracement level of the March-July rally crossing at $74.01. Second support is the 75% retracement level of the March-July rally crossing at crossing at $73.49.
The September Japanese Yen was steady to slightly higher overnight as it consolidates some of this week's decline. Overnight trading sets the stage for a steady to slightly higher opening when the day session begins trading. However, stochastics and the RSI are oversold and remain neutral to bearish signaling that sideways to lower prices are possible near-term. If September extends the decline off the July 14th high, the October-2022 low crossing at 0.069270 is the next downside target. Closes above the 50-day moving average crossing at 0.071465 would signal that a short-term low has been posted. First resistance is the 10-day moving average crossing at 0.070280. Second resistance is the 50-day moving average crossing at 0.071465. First support is the overnight low crossing at 0.069400. Second support is the October-2022 low crossing at 0.069270.
PRECIOUS METALS http://quotes.ino.com/ex changes/?c=metals"
Precious Metals: October gold was steady to slightly higher overnight and sets the stage for a slightly higher opening when the day session begins trading later this morning. Stochastics and the RSI are oversold but remain neutral to bearish signaling that sideways to lower prices are possible near-term. If October extends the decline off July's high, June's low crossing at $1919.60 is the next downside target. Closes above the 50-day moving average crossing at $1968.70 would temper the near-term bearish outlook. First resistance is the 50-day moving average crossing at $1968.70. Second resistance is the July 20th high crossing at $2008.50. First support is the overnight low crossing at $1924.00. Second support is June's low crossing at $1919.60.
September silver was slightly lower overnight as it extends this week's trading range. Overnight weakness sets the stage for a slightly lower opening when the day session begins trading later this morning. Stochastics and the RSI are oversold but remain neutral to bearish signaling that sideways to lower prices are possible near-term. If September extends the decline off July's high, June's low crossing at $22.340 is the next downside target. Closes above the 20-day moving average crossing at $24.181 would signal that a short-term low has been posted. First resistance is the 50-day moving average crossing at $23.883. Second resistance is the 20-day moving average crossing at $24.181. First support is July's low crossing at $22.720. Second support is June's low crossing at $22.340.
September copper was lower overnight as it extends the decline off August's high. Overnight trading sets the stage for a lower opening when the day session begins trading. Stochastics and the RSI are oversold but remain neutral to bearish signaling that sideways to lower prices are possible near-term. If September extends this month's decline, the June 29th low crossing at 3.6830 is the next downside target. Closes below the 20-day moving average crossing at 3.8498 would signal that a short-term low has been posted. First resistance is the 20-day moving average crossing at 3.8498. Second resistance is last-Friday's high crossing at 3.9280. First support is the June 29th low crossing at 3.6830. Second support is May's low crossing at 3.5650.
GRAINS http://quotes.ino.com/ex changes/?c=grains
Grains: December corn was steady to slightly higher overnight as it extends the trading range of the past six-days while awaiting the release of this month's WASDE report at noon today. Overnight trading sets the stage for a steady to slightly higher opening when the day sessions begins trading. Stochastics and the RSI are oversold but remain bearish signaling that sideways to lower prices are possible near-term. If December extends the decline off July's high, July's low crossing at $4.81 is the next downside target. Closes above last-Monday's gap crossing at $5.25 1/2 would signal that a short-term low has been posted. First resistance is the 20-day moving average crossing at $5.21. Second resistance is the 50-day moving average crossing at $5.32 1/4. First support is Monday's low crossing at $4.89 1/4. Second support is July's low crossing at $4.81.
September wheat was lower overnight while extending the trading range of the past six-days. Overnight trading sets the stage for a lower opening when the day session begins trading. Stochastics and the RSI are oversold but remain neutral to bearish signaling that sideways to lower prices are possible near-term. If September extends the decline off July's high, July's low crossing at $6.22 is the next downside target. Closes above the 20-day moving average crossing at $6.78 1/2 would signal that a short-term low has been posted. First resistance is the 50-day moving average crossing at $6.71 1/4. Second resistance is the 20-day moving average crossing at $6.78 1/2. First support is July's low crossing at $6.22. Second support is May's low crossing at $5.87 3/4.
September Kansas City wheat was higher overnight as it extends this week's trading range. Overnight trading sets the stage for a higher opening when the day session begins trading later this morning. Stochastics and the RSI are oversold but remain neutral to bearish signaling that sideways to lower prices are possible near-term. If September extends the decline off July's high, May's low crossing at $7.33 is the next downside target. Closes above the 20-day moving average crossing at $8.21 1/4 would signal that a low has been posted. First resistance is the 10-day moving average crossing at $7.76. Second resistance is the 20-day moving average crossing at $8.21 1/4. First support is Monday's low crossing at $7.48 1/4. Second support is May's low crossing at $7.33.
September Minneapolis wheat was slightly higher overnight as it extends this week's trading range. Overnight trading sets the stage for a slightly higher opening when the day session begins trading. Stochastics and the RSI are oversold but remain neutral to bearish signaling that sideways to lower prices are possible near-term. If September extends the decline off July's high, July's low crossing at $8.07 1/4 is the next downside target. Closes above the 20-day moving average crossing at $8.66 1/2 would signal that a low has been posted. First resistance is the 50-day moving average crossing at $8.49 1/2. Second resistance is the 20-day moving average crossing at $8.66 1/2. First support is July's low crossing at $8.07 1/4. Second support is the June 14th low crossing at $8.01 1/4.
SOYBEAN COMPLEX? http://quotes.ino.com/ex?changes/?c=grains "
November soybeans was higher overnight as it extends the rebound off Tuesday's low. Overnight trading sets the stage for a higher opening when the day session begins trading later this morning. Stochastics and the RSI are oversold and are turning neutral to bullish signaling that sideways to higher prices are possible near-term. Closes above the 20-day moving average crossing at $13.62 would signal that a low has been posted. If November extends the decline off July's high, the 62% retracement level of the May-July rally crossing at $12.46 3/4 is the next downside target. First resistance is the 10-day moving average crossing at $13.21. Second resistance is the 20-day moving average crossing at $13.62. First support is the 50% retracement level of the May-July rally crossing at $12.82 3/4. Second support is the June 28th low crossing at $12.56 3/4.
December soybean meal was slightly higher overnight as it extends the trading range of the past two-weeks. Overnight trading sets the stage for a higher opening when the day session begins trading. Stochastics and the RSI are oversold but remain neutral to bearish signaling that sideways to lower prices are possible near-term. If December extends the decline off July's high, the July 7th low crossing at $384.70 is the next downside target. Closes above last-Monday's gap crossing at $392.40 would temper the bearish outlook. First resistance is last-Monday's gap crossing at $392.40. Second resistance is July's high crossing at $424.70. First support is the July 7th low crossing at $384.70. Second support is the June 29th low crossing at $374.60.
December soybean oil was slightly higher in overnight trading as it extends the trading range of the past two-weeks. Overnight trading sets the stage for a slightly higher opening when the day session begins trading. Stochastics and the RSI are turning neutral to bullish signaling that sideways to higher prices are possible near-term. Closes above the 20-day moving average crossing at 61.39 would temper the bearish outlook. If December extends the decline off July's high, the 50-day moving average crossing at 57.82 is the next downside target. First resistance is the 75% retracement level of the 2022-2023 decline crossing at 65.45. Second resistance is the 87% retracement level of the 2022-2023 decline crossing at 68.81. First support is Tuesday's low crossing at 57.86. Second support is the 50-day moving average crossing at 57.82.
Thanks tallpine!
USDA report 11am. That means everything.
The weather has been turning more bullish and probably why we hit a bottom earlier this week.........however, its almost impossible to go up in the Summer during a rain event in a key area and rains right now in huge soy producer IL are probably pressuring the beans for the moment.
++++++++++++++++++
This link below provides some great data. After going to the link, hit "Mesoanalysis" then, the center of any box for the area that you want, then go to observation on the far left, then surface observations to get constantly updated surface observations or hit another of the dozens of choices.
 Found a great new link/site that shows us how much precip fell(from 1 hr to 72 hours) for different periods to share with you. https://www.iweathernet.com/total-rainfall-map-24-hours-to-72-hours Data Update Cycle: The 1-hr mosaic is updated every 5 min (approx). All other mosaics are now updated hourly, including the 48h and 72h maps. The site does not allow me to copy the actual images/data here, as we do with all the other links above..........so just go to the link! |
There's a bit more uncertainty than usual for the late August weather pattern and its getting late in the growing season.
But it looks like increasing heat and decreasing rains.
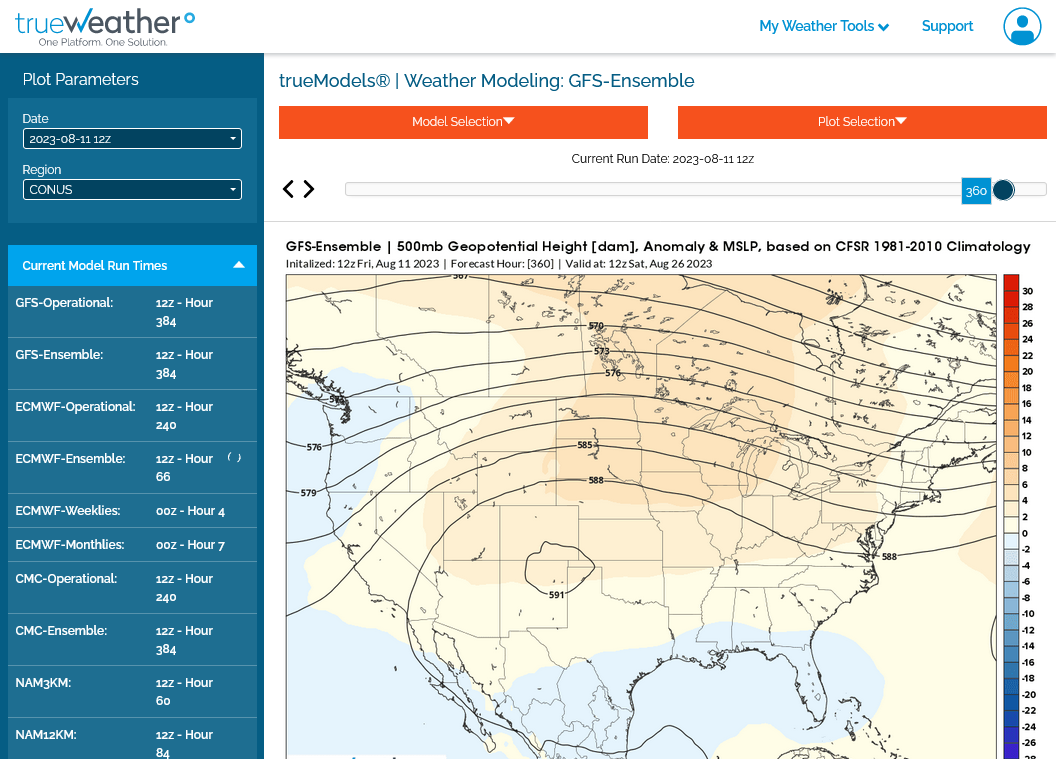
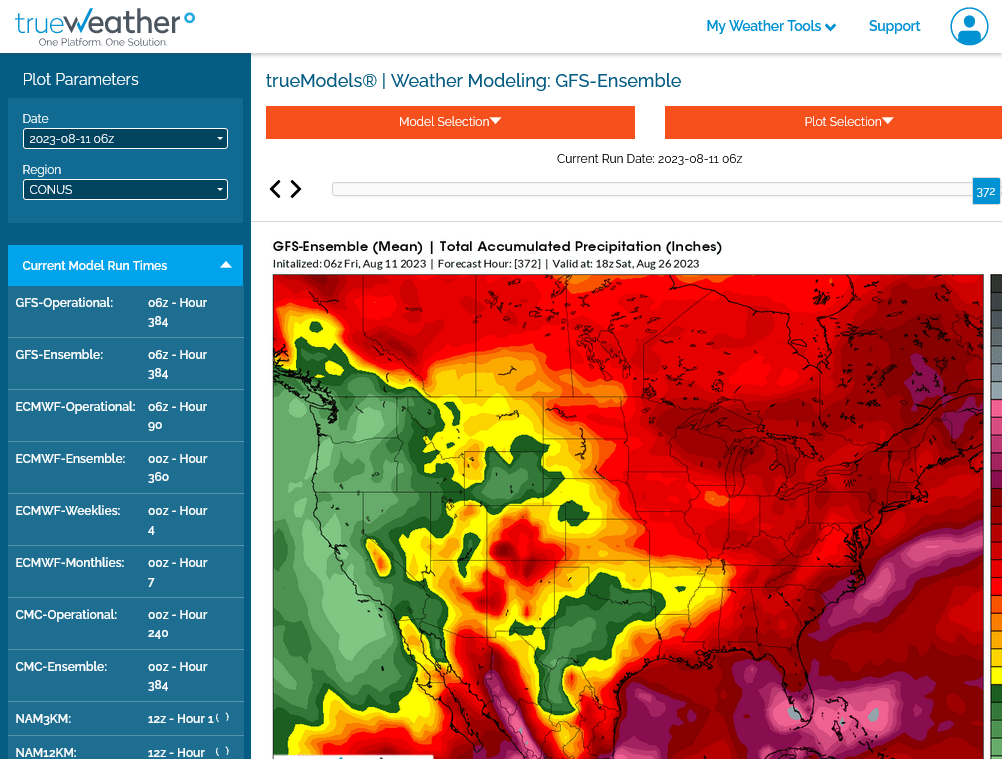
This was the just updated 6z GEFS.
1. 500mb heat ridge is southwest of the Cornbelt with ridging into the Cornbelt. Tricky to forecast rains around the periphery of the dome, which is where we'll be. This is a hot pattern. Trough along the East Coast mean less heat there(a bit bearish ng) but no Bermuda High means no moisture pump for the Midwest.
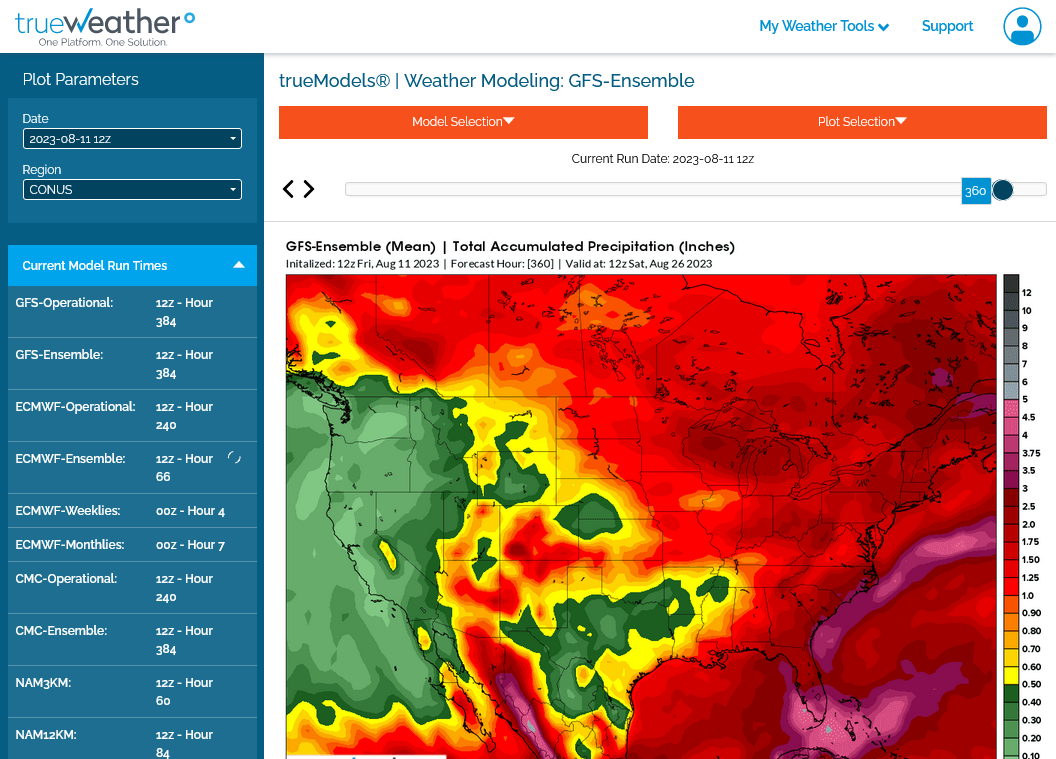
2. Total rains. There will likely be some places with less than average. Along with the heat, it means crop ratings could drop to end the growing season. Also heat fill for late kernel filling to finish the corn crop. The mild temps most of this Summer have the corn crop at close to average maturity, despite the early planting. Kernel filling temps have been pretty good so far, other than brief invasions of modest heat.
HeatFill for Corn
Started by metmike - July 14, 2023, 2:47 p.m.
https://www.marketforum.com/forum/topic/97257/
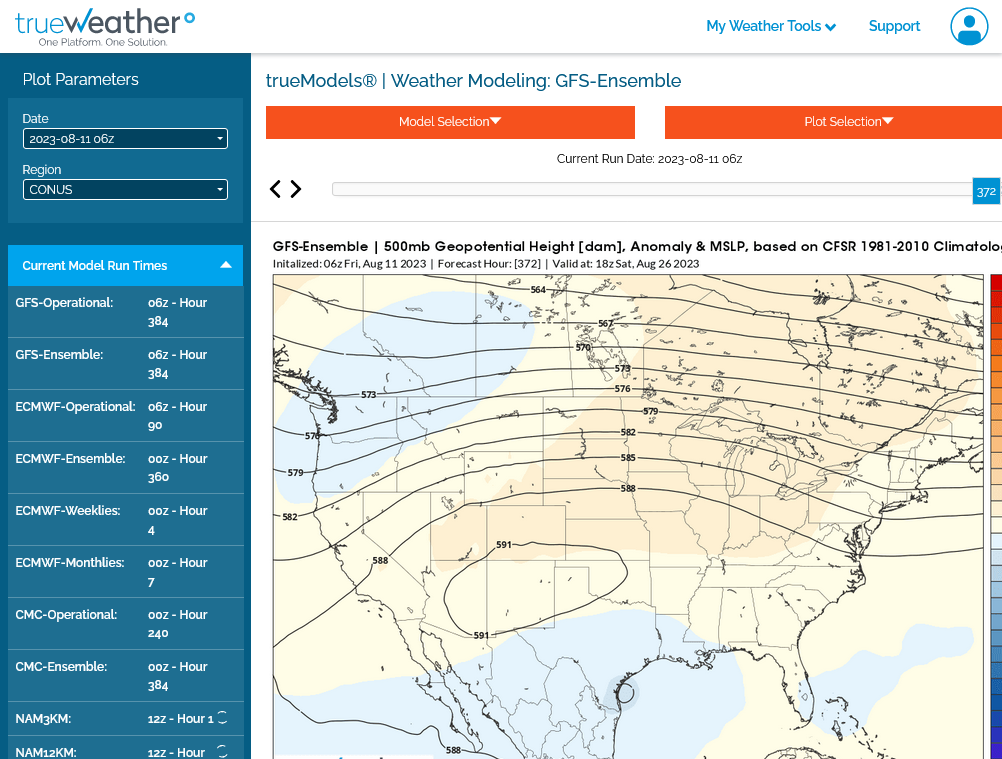
The 12z GEFS was on the bullish side but its getting late for weather
1. August 26 upper levels-dome is southwest of the cornbelt but heat ridge extends into the Midwest. Tricky rain forecast around the periphery of the heat ridge
2. Total rains.