
Hey Mike,
Today at AmericanWx, Blizzard92 posted a link to an article referring to a study suggesting that the wetter MW of the last few decades is partially attributed to AGW. In response, I posted this:
——————————
From this article:
“But that doesn’t mean global warming has somehow skipped the central US: In a weird twist, climate change may be partly responsible for this gap.”
“Interestingly enough, the conditions that contribute to the hole actually begin thousands of miles to the west, in the tropical Pacific. ‘Changing ocean surface temperatures, partly caused by global warming and partly caused by naturally occurring variability, are producing the downstream changes in atmospheric circulation over the US,’ says Gerald Meehl, a senior scientist at the National Center for Atmospheric Research, who wasn’t involved in the new research. ‘This paper confirms earlier work that these changes in circulation are bringing this cooler and wetter weather into parts of the eastern US.’”
This seems like a reach to try to attribute the wetter wx in the Midwest to AGW. This is a very weak argument at best imo. I favor calling it a combo of mainly much higher crop production (which has likely been helped by increased CO2) along with natural variability. Besides, an increase in droughts is supposed to occur due to AGW.
I’m not doubting AGW at all (very much unlike Joe Bastardi for example, who’s ignoring scientifically supported facts/evidence). But I do question some of the attempts to attribute too many things to AGW without solid evidence. Overdoing attribution only serves imo to make it more difficult to educate folks about the reality of AGW because I feel it creates straw-men.
Wonderful topic, Larry!
So glad that you brought it up!!!
The science is pretty clear on the biggest contributing factor for this one.
It is related to the increase in CO2 but NOT for the reason they claim. This has nothing to do with the circulation pattern. That explanation is just a result of people stretching a speculative theory beyond what makes sense to try to make it fit a false narrative.
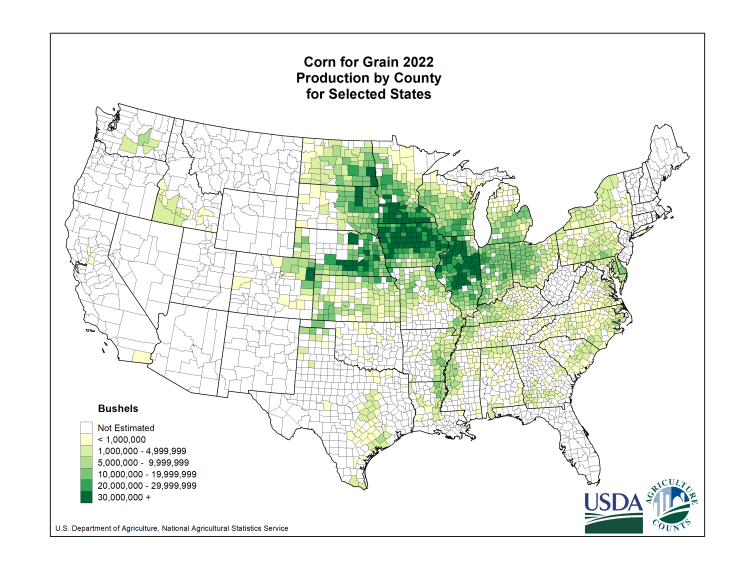
The reason for the Midwest to have experienced cooler daytime readings and more rain in the growing season is the massive increase in evapotranspiration, mostly from tightly packed rows of corn (twice as dense as 5 decades ago-thanks mostly to improvements in technology/hybrids/fertilizer).
The added CO2 is contributing positively to that as an atmospheric fertilizer by boosting vegetative health and growth.
However, the main impact here is from the intensification of crop growing agriculture in this region.
Farmers in the U.S. Midwest have created a micro-climate during the growing season, after their tightly packed rows of corn reach the vegetative state.
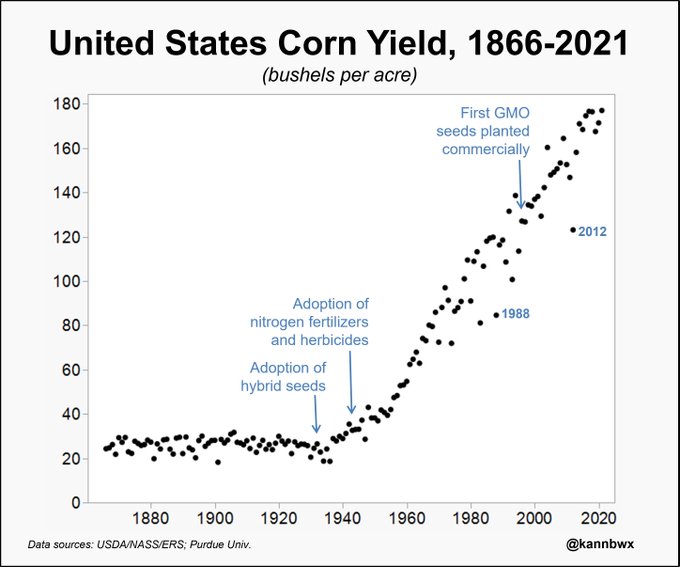
We can see how corn yields have quadrupled since the 1960's but it was the most recent doubling of yields in the last 40 years(that also coincided with climate change) from the increasingly tighter packed rows of corn that has contributed the most significant amount of additional evapotranspiration.
A brief history of U.S. #corn yield growth since the 1860s Notable growth in yields was seen after the adoption of modern fertilizers in the 1940s, which made drought years esp. in the 1980s stand out more than before (compare with 1930s Dust Bowl for example).
https://www.nass.usda.gov/Charts_and_Maps/Crops_County/cr-pr.php
https://journals.ametsoc.org/view/journals/clim/32/17/jcli-d-19-0096.1.xml

Fig. 1. Above
Observed changes in (a) mean surface temperature (CRUTS4.01), (b) precipitation (CRUTS4.01), (c) maximum surface temperature (CRUTS4.02), and (d) evapotranspiration (Livneh et al. 2013). Change shown is the difference between July–August monthly average from 1920–49 to 1970–99. Stippling shows a significant change between the two periods according to a Kolmogorov–Smirnov test at the 5% significance level.
Additional articles that discuss this impact:
https://www.atlasobscura.com/articles/corn-belt-weather
by Eric J. WallaceDecember 3, 2018
“To be successful in this business, you’ve got to pay close attention to the weather,” explains Brandon. In the past 20 years, on top of the above, he’s noted a gradual decrease in 100-degree days during the summer. “That missing digit isn’t something you overlook,” he asserts with a laugh. “High temperatures create a lot of anxiety. If they go on long enough, they’ll scorch your corn and put a hurtin’ on your bottom line!”
A 2018 report issued by climate researchers at the Massachusetts Institute of Technology claims to have solved the mystery and verified farmers’ suspicions: Namely, that large-scale corn production has changed the weather.
Over the past 70 years, farmers in America’s midwestern Corn Belt have made vast leaps in production. From 1950 to 2010, annual harvests increased by more than 400 percent, jumping from 2 billion to 10 billion bushels. In addition to making the area the world’s most productive agricultural region, climate scientists at MIT say the boom has created its own weather patterns.
“We studied data from the past 30 years and found that the intensification of corn production has increased average summer rainfalls by about 35 percent and decreased [average summer] temperatures by as much as one degree Celsius,” says former MIT researcher Ross E. Alter, now a research meteorologist with the U.S. Army Corps of Engineers. Alter was the lead author of a 2018 report published in the journal of the American Geophysical Union that demonstrated how land use has impacted the region’s climate more than greenhouse gas emissions. “What makes these findings so fascinating is that, while global temperatures have risen, areas like eastern Nebraska have actually cooled,” continues Alter, referring to yearly averages. “We think it’s likely heavy agriculture counteracted rising summer temperatures that might have otherwise resulted from increasing greenhouse gases.”
In other words, the man-made shift has been helpful. By increasing yields, farmers have unintentionally created weather patterns that seem to be protecting their crops and helping them grow more corn. (Of course, burning fossil fuels to plant, cultivate, harvest, process, and ship farm products has been shown to be a major contributor to rising levels of greenhouse gases.)
Though similar effects have to some degree been observed in the rice-growing regions of eastern China, the report marks the first time the effects of agriculture on regional climate change in the central U.S. have undergone comprehensive analysis. The findings document the most significant man-made regional climate shift in world history.
But how, specifically, has growing more corn changed the climate? Nebraska associate state climatologist Al Dutcher says it’s complicated.
On one hand, it has to do with what Hunnicutt and other farmers refer to as “corn sweat.” This happens when photosynthesis boosts the amount of water vapor in the air.
“When a plant’s pores, called stomata, open to allow carbon dioxide to enter, they simultaneously allow water to escape,” writes Kimberly Hickok, who covers climate change for Science Magazine and reviewed the report. Known as transpiration, the process cools the plant and surrounding air, and increases the amount of water going into the atmosphere and returning as rainfall. As Hickok notes, “the cycle may continue” as that additional rainwater evaporates back into the atmosphere and causes rainfall on other farms and towns downwind.
Put another way: More corn means more transpiration. Which, in turn, produces slightly cooler temperatures and increased precipitation. The fact that corn is a non-native species boosts the effect.
“The predominant native vegetation in central and eastern Nebraska is grass,” explains Dutcher. Farmers have replaced the area’s vast seas of grass with more than nine million acres of corn, which transpires at a rate 20 percent higher than indigenous grasses. “Agriculture is literally funneling moisture into the atmosphere, and all that humidity has created a kind of protective bubble against rising temperatures.”
Dutcher and Hunnicutt say growing more corn—and thus, creating more transpiration—would have been impossible without advances in farming efficiency. The introduction of high-yielding varieties, better irrigation, and soil management techniques, along with the ability to use computer sensors to closely monitor field conditions, have all contributed to soaring yields.
“One of the biggest factors is the widespread use of cover crops, crop residue management, and no-till farming methods,” writes University of Nebraska-Lincoln Institute of Agriculture and Natural Resources extension engineer Paul Jasa. Together, the practices have erased the need for conventional tillage, dramatically increased organic matter in the soil, reduced evaporation and runoff, and lowered summer surface temperatures. “With time, the [native clay-based] soil has become much healthier and better at retaining water,” Jasa continues. “This has made crops more resilient to traumatic weather events and, in general, much more productive.”
Hunnicutt says automated irrigation has helped boost overall production and allowed him to grow corn in pivot corners where his grandfather could not. Upward of 340 acres that formerly yielded nothing now contribute as much as 180 bushels per acre. In his tenure as a farmer, full-field yields have grown by more than 50 bushels an acre.
An acre of corn can add up to 4,000 gallons of water vapor to the atmosphere per day!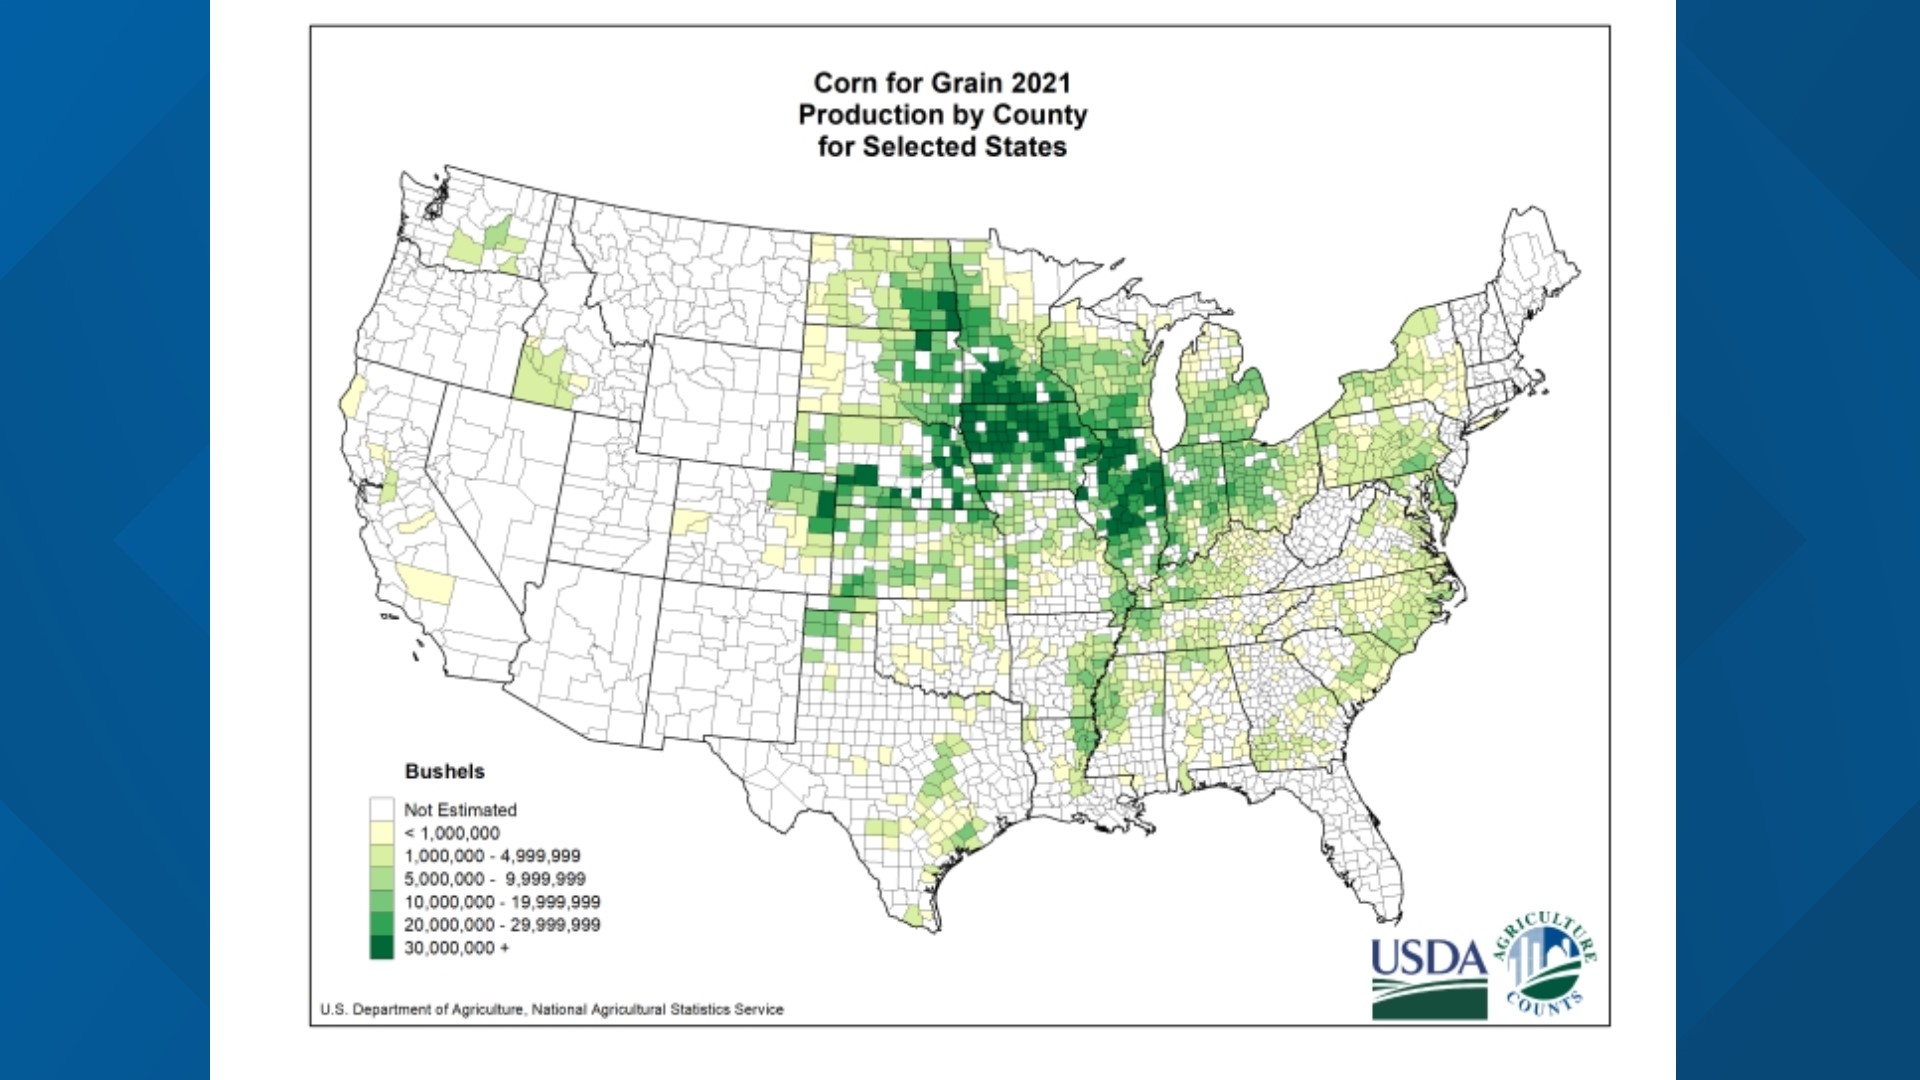
Can you imagine stepping outside to a 90-degree dew point?
https://www.foxweather.com/learn/corn-sweat-midwest-most-oppressive-humidity-united-states
Some 130 miles west of Clarion in Maurice, Iowa, an even higher dew point of 91 degrees was recorded the previous evening, between 5-7 p.m. Central time on July 27, 2021. The 5 p.m. air temperature was 93 degrees, making the heat index an astounding 141 degrees.
According to an August 2011 blog post by weather historian Christopher Burt at Weather Underground, the highest dew point ever reliably measured in the United States was 91 degrees in Melbourne, Florida, at 2 p.m. Eastern time on July 12, 1987. That was accompanied by an air temperature of 95 degrees, so the heat index was a stifling 144 degrees (in case you were keeping score at home).
+++++++++++
https://www.kcrg.com/content/news/WWC-Why-have-dew-points-been-jumping-up-in-the-evening-487803471.html
+++++++++++++
Climate Change Impacts in the Corn Belt
https://addins.wrex.com/blogs/weather/2011/07/why-is-the-humidity-so-high-the-answer-is-pretty-corny
Plentiful crops are changing rainfall and temperature trends
16 Feb 2018 ByKimberly Hickok
https://www.science.org/content/article/america-s-corn-belt-making-its-own-weather
To see whether this increase in crops has influenced the region's unusual weather, researchers at the Massachusetts Institute of Technology in Cambridge used computers to model five different 30-year climate simulations, based on data from 1982 to 2011. First, they compared simulations with high levels of intense agriculture to control simulations with no agricultural influence. Unlike the real-life climate changes, the control simulations showed no change in temperature or rainfall. But 62% of the simulations with intense agriculture resulted in temperature and rainfall changes that mirror the observed changes, the team reports this week in Geophysical Research Letters.

Map of the central United States, showing changes in rainfall during the last third of the 20th century. Areas of increased rainfall are shown in green, with darker colors representing a greater increase.
Massachusetts Institute of Technology
The team then compared its results to historical global simulations from the World Climate Research Programme (WCRP), an international program for the coordination of global climate research sponsored by the International Council for Science, the World Meteorological Organization, and the Intergovernmental Oceanographic Commission of UNESCO. WCRP's models take into account greenhouse gas emissions and other natural and humanmade influences, but do not consider agricultural land use. When researchers ran the numbers for the Corn Belt, the global models fell short of reality: They predicted both temperature and humidity to increase slightly, and rainfall to increase by up to 4%—none of which matches the observed changes.
Other climate simulations that use sea surface temperature variation didn't match observed changes, either. Those simulations matched historical data until 1970; after that, the simulations predicted temperatures to keep increasing, rather than decreasing as they did in reality. This is a strong indication that agriculture, and not changing sea surface temperature, caused the regional changes in climate during the last third of the 20th century, the researchers say.
"The [influence] of agriculture intensification is really an independent problem from greenhouse gas emissions," says Ross Alter, lead author of the study and now a meteorologist with the U.S. Army Corps of Engineers in Hanover, New Hampshire. In fact, Alter says, heavy agriculture likely counteracted rising temperatures regionally that might have otherwise resulted from increasing greenhouse gas emissions. One other place that shows a similar drop in temperatures, he notes, is eastern China, where intensive agriculture is widespread.
But how does agriculture cause increased rainfall and decreased temperatures? The team suspects it has to do with photosynthesis, which leads to more water vapor in the air. When a plant's pores, called stomata, open to allow carbon dioxide to enter, they simultaneously allow water to escape. This increases the amount of water going into the atmosphere and returning as rainfall. The cycle may continue as that rainwater eventually moves back into the atmosphere and causes more rainfall downwind from the original agricultural area.
Rong Fu, a climate scientist at UC Los Angeles, agrees with the team's assessment. She also thinks that though human influence might be "greater than we realize," this regional climate change is probably caused by many factors, including increased irrigation in the region.
+++++++++++++++++
metmike: They are WRONG about this prediction below. Models that use photosynthesis instead of flawed warming equations(with almost 50% more warming from CO2 than has been empirically measured) emphatically show the robust greening and crop yields to continue past the year 2100.
I'll show the proof of that on the next page!
"This squares with a lot of other evidence," says Peter Huybers, a climate scientist at Harvard University, who calls the new study convincing. But he warns that such benefits may not last if greenhouse gas emissions eventually overpower the mitigating effect of agriculture.
Alter agrees, and says it's unlikely that the large increases in U.S. crop production during the 20th century will continue. Other scientists have voiced concern that agricultural production could soon be reaching its limit in many parts of the world.
"Food production is arguably what we're more concerned about with climate change," Mueller says. And understanding how agriculture and climate will continue to affect one another is crucial for developing projections for both climate and agricultural yields. "It's not just greenhouse gasses that we need to be thinking about."
Profound: Smoking Guns!! Proof with accurate 2 decade long measurement of the actual amount of radiative forcing caused by CO2 of 1 irrefutable reason for WHY global climate models continue to be too warm. Climate emergency is really about social justice and brainwashing people. Even MORE confirmation that climate models overstate atmospheric warming. Models clearly too warm yet incredibly programmed to get even HOTTER! August 2020 https://www.marketforum.com/forum/topic/57636/
++++++++++
Started by metmike - Aug. 14, 2020, 6:20 p.m.
RADIATIVE FORCING BY CO2 OBSERVED AT TOP OF ATMOSPHERE FROM 2002-2019
https://arxiv.org/pdf/1911.10605.pdf
"The IPCC Fifth Assessment Report predicted 0.508±0.102 Wm−2RF resulting from this CO2 increase, 42% more forcing than actually observed. The lack of quantitative long-term global OLR studies may be permitting inaccu-racies to persist in general circulation model forecasts of the effects of rising CO2 or other greenhouse gasses."
metmike: The significance of this empirical data.............the actual measurement of the "greenhouse gas affect" from the addition of CO2 cannot be overstated. This data is akin to using a calibrated rain gauge to measure how much rain fell vs wild guessing from seeing how big the puddles/standing water was.
It proves, irrefutably/beyond a shadow of any scientific doubt, PART OF WHY the global climate models that we have been using have been too warm.
+++++++++++++++++++
https://www.marketforum.com/forum/topic/69258/#69259
Below: Look what happens when we use AUTHENTIC SCIENCE. PHOTOSYNTHESIS and THE REAL WORLD instead of speculative, busted global warming equations that are designed as a political tool to scare people with impossible warming scenarios and force agenda based on a fake climate crisis.
https://earthobservatory.nasa.gov/images/146296/global-green-up-slows-warming
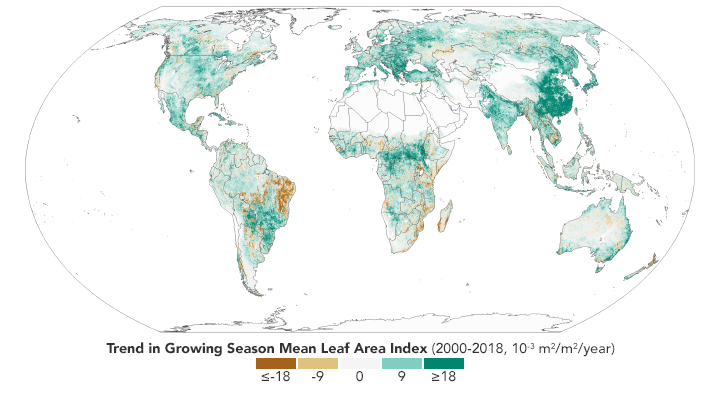
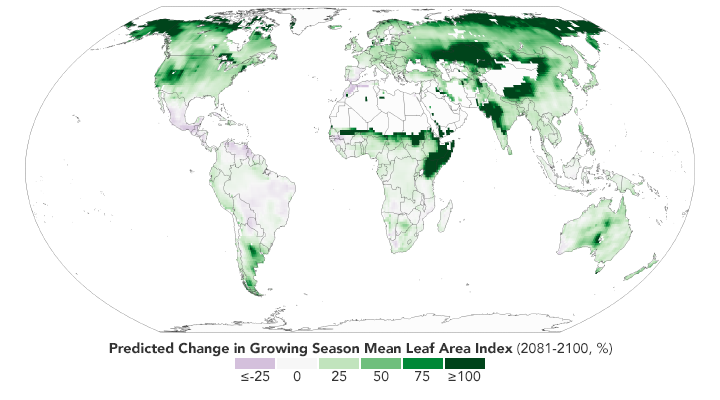
"The paper’s authors reviewed more than 250 published articles that have used satellite data, modeling, and field observations, to understand the causes and consequences of global greening. Among the key results, the authors noted that on a global scale greening can be attributed to the increase of carbon dioxide in the atmosphere. Rising levels of carbon dioxide increase the rate of photosynthesis and growth in plants."
metmike: Why isn't this paper, based on 250........let me repeat that number 250 published articles using the best technology known to science............getting much news coverage?
Because they don't want you to know this.
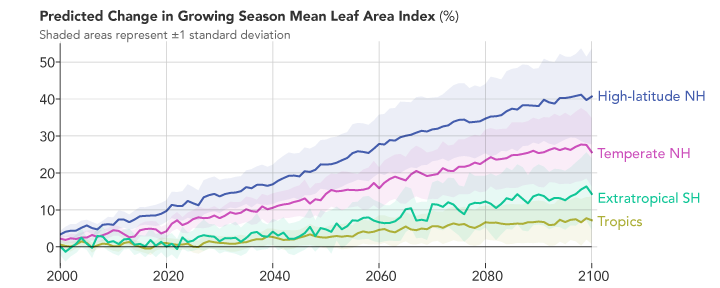
From the projections: According to climate models, the future looks even greener. The second map shows what the green-up might look like in the future based on the Coupled Model Intercomparison Project (CMIP5) climate model, under a scenario in which increases in greenhouse gases lead to almost 5° Celsius (9° Fahrenheit) of warming by the end of the 21st century. Specifically, it shows the predicted change in the growing season’s “leaf area index” from 2081-2100 relative to 1981-2000. The chart below the map shows the predicted changes by latitude. Notice that high latitudes in the Northern Hemisphere are still expected to change the most.
+++++++++++++++++++++++++
metmike: There is almost no chance we will see that amount of warming(+9 Deg. F projections are totally meant to scare people using junk science and impossible simulations designed as political tools to push crony capitalism, corrupted/extremely biasd science, government/political agenda, misguided environmentalism ignorance and media ratings/attention ).
The physics of greenhouse gas warming are real and humans are warming the planet by 2 Deg. F so far. However the information that we get is greatly exaggerated with constant cherry picking and greatly flawed interpretations that NEVER tell us about the massive benefits, including trillions, just from the increase in agricultural production.
There is a near 100% chance that the planet will keep massively greening up with crop yields going higher from the indisputable law of photosynthesis as CO2 increases. The optimal level of this building block for life is 900 parts per million for most life. The current atmospheric level of CO2 is only 420 ppm.

The Social Benefit of Carbon: $3.5 Trillion in Agricultural Productivityhttps://www.drroyspencer.com/2013/10/the-social-benefit-of-carbon-3-5-trillion-in-agricultural-productivity/Craig Idso, an expert on the fertilization effects of elevated CO2 levels on various plant species, has done a new study of the positive externality (unintended economic consequence) of increasing CO2. In the 50 year period, 1961-2011, he estimates that there has been a $3.5 trillion benefit resulting from increased agricultural productivity. The projected benefits in the coming decades are even larger. Egad! How could any by-product of human activity possibly be good? That sure wasn’t what I was taught in school! In our modern age of self-flagellating hand-wringing do-gooders with too much time on their hands and anxious to find some cause to convince others to pay for assuaging their self-imposed guilt (phew), it is seldom we hear any good news about anything related to climate change. And if just the agricultural benefits of increasing CO2 is in the multi-trillion dollar range, what about the prosperity enabled over the last 100 years by access to abundant, affordable energy? How many gazillions of dollars would that be? The Positive Externalities of Carbon Dioxide: Estimating the Monetary Benefits of Rising Atmospheric CO2 Concentrations on Global Food Production http://www.co2science.org/education/reports/co2benefits/MonetaryBenefitsofRisingCO2onGlobalFoodProduction.pdf 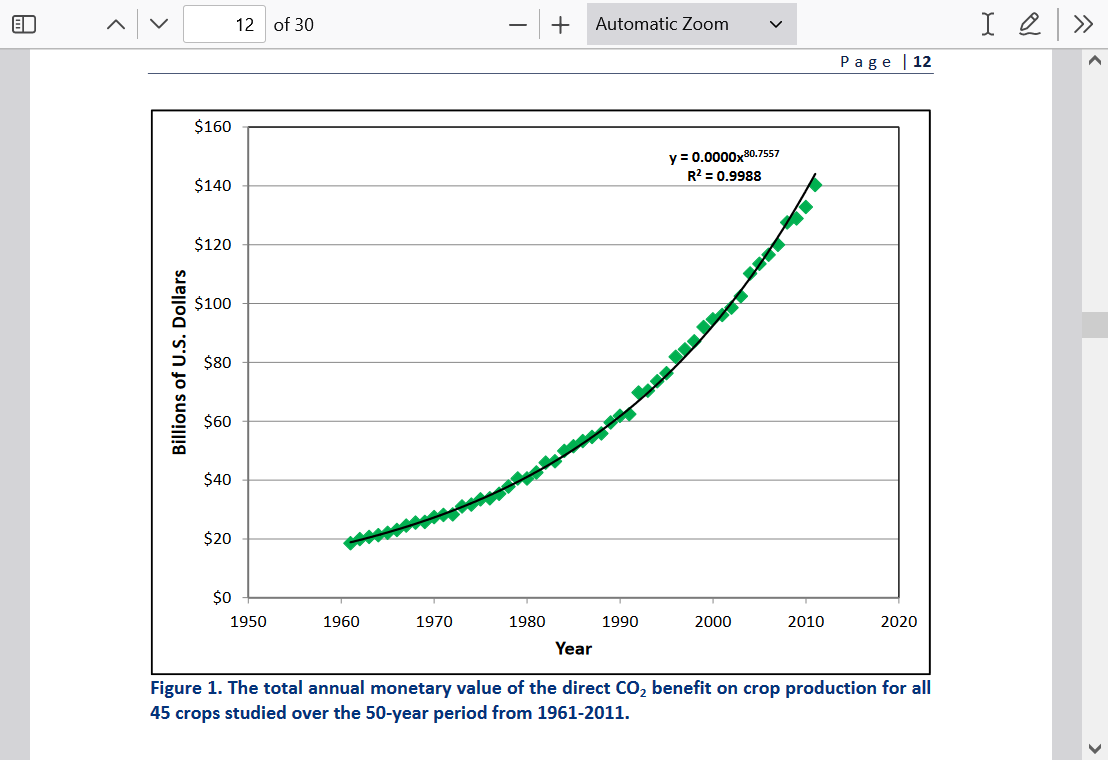 | July 24, 2023, 4:55 p.m. metmike |