The Oct USDA is the first of the new FL orange crop estimates. It used to be a pretty big deal.
Thanks, Larry!
It sure is and who can forget the profound results of last October's USDA Orange production update after major hurricane Ian (-:
"orange production"

I didn't send anything to the tech person for this site a couple of weeks ago when we were getting more brief timed out messages, from being busy at the time. Next time we have it happen more than isolated I'll try to do that.
All trade estimates for USDA's reports due at 11 am CT on Thursday. Trade will be focusing on US corn and soybean production and any potential implications for demand. Both crops are seen shrinking from the Sept. outlooks.
USDA increased #Argentina's upcoming #corn crop by 1 mmt, but all other Argy crop estimates were unch, incl. 23/24 #wheat at 16.5 mmt.No crop changes for #Brazil
U.S. #corn yield slides from last month as lower yields are found in many mid-producing states, as well as in Iowa and Nebraska. Records projected for Indiana and Ohio, with Indiana creeping toward the 200 mark.
U.S. #corn yield: 2022: 173.4 bu/acre 2023: 173.0 bu/acre Differences: Illinois & Minnesota fell significantly off last year's pace (as did Wisc & Missouri), but corn yields were much better than last year in mid-smaller producers, esp in the south.
Yield for U.S. #soybeans is now seen below 50 bu/acre, though top producers Illinois and Iowa are unchanged from last month. Indiana is now seen tying Illinois at 61, though late season dryness in Kansas took a toll on yield potential.
49.6 bu/acre for U.S. #soybeans in both 2022 and 2023, but state-level yield results are not necessarily similar in each year:
The first estimate of the FL all current orange crop was reported as 20.5 mb, which is 30% higher than the prior crop’s final estimate. Keep in mind that that prior crop was the smallest in decades, partially due to the damage from hurricane Ian. So, it was bound to rebound.
buy Mortimer buy!!!!
Sell Mortimer sell!!
Thanks much, Larry! You nailed that one last year.
Florida production has collapsed in the last 2 DECADES )-:
https://www.nass.usda.gov/Statistics_by_State/Florida/Publications/Citrus/Citrus_Forecast/index.php

By Karen Braun

Great one, cutworm and always fun to watch this video clip again, even though the oj price goes thru several limits in a few minutes!!!
Bonus: The Eddie Murphy Rule
One interesting kicker to the story: Trading commodities on inside information obtained from the government wasn't actually illegal when the movie came out, but it's illegal now. It was banned in the 2010 finance-overhaul law, under a special provision often referred to as the Eddie Murphy Rule.
++++++++++++++++++
13-1
ICE Futures U.S.®, Inc.
FCOJ RULES
https://www.ice.com/publicdocs/rulebooks/futures_us/13_FCOJ.pdf
Rule 13.08. Price Limits
(a) For purposes of this Rule the following terms shall have the following meanings:
(i) The Lead Month. The futures delivery month carrying the most open interest;
(ii) Limit Move shall be deemed to have occurred on any trading day when the Daily
Settlement Price of the Lead Month is ten cents (10¢) per pound above or below the
Settlement Price for such month on the previous trading day.
(b) Limits
(i) 10¢ Move
(A) The price limit for any month shall be ten cents (10¢) per pound above and below the
Settlement Price for such month on the previous trading day.
+++++++++++++
Here's my commentary comparing their movie version to reality.
1. Their board shows contract months for every month of the year, including their fake front month, April which we assume they were trading on the show. Reality is that OJ trades main futures contracts of January, March, May, July, September and November.
2. The previous days close for fake April OJ was 98c, so the daily limit up would be $1.08, daily limit down would be 88c.
3. However, before the crop report release on the show, the price gets as high as $1.42, which is well over 4X the daily limit for that day as it was +44c vs the close on the prior day. In reality, after hitting $1.08 it would have been lock limit up with bids at that price exceeding offers and limited trading volume but all trades being at $1.08.
4. After the crop report, the price crashes to a low of 29c, which is the close of that day on their show. This would be almost 7X the daily limit down from being 69c lower than the previous days close. The reality is that when the OJ hit 88c, it would have been lock limit down with limited trading volume because offers at that price would not be matched with enough buyers to do anything but remain locked at the limit down price.
5. The daily trading range was $1.13. The movie was shot in 1983. The low of the day was below the lowest price in history of 31.9c in 1970.
https://www.quantifiedstrategies.com/orange-juice-trading-strategy/
According to the TradingView chart for FCOJ futures (OJ), the lowest price the OJ futures contracts has ever fallen to was 31.90 US cents, which happened in October 1970.
6. The highest price in history by a colossally wide margin was and is RIGHT NOW!!!
WOOOW!!
https://tradingeconomics.com/commodity/orange-juice

Beans have been bombarded with some pretty bullish news during the last week!
The lows should be in!
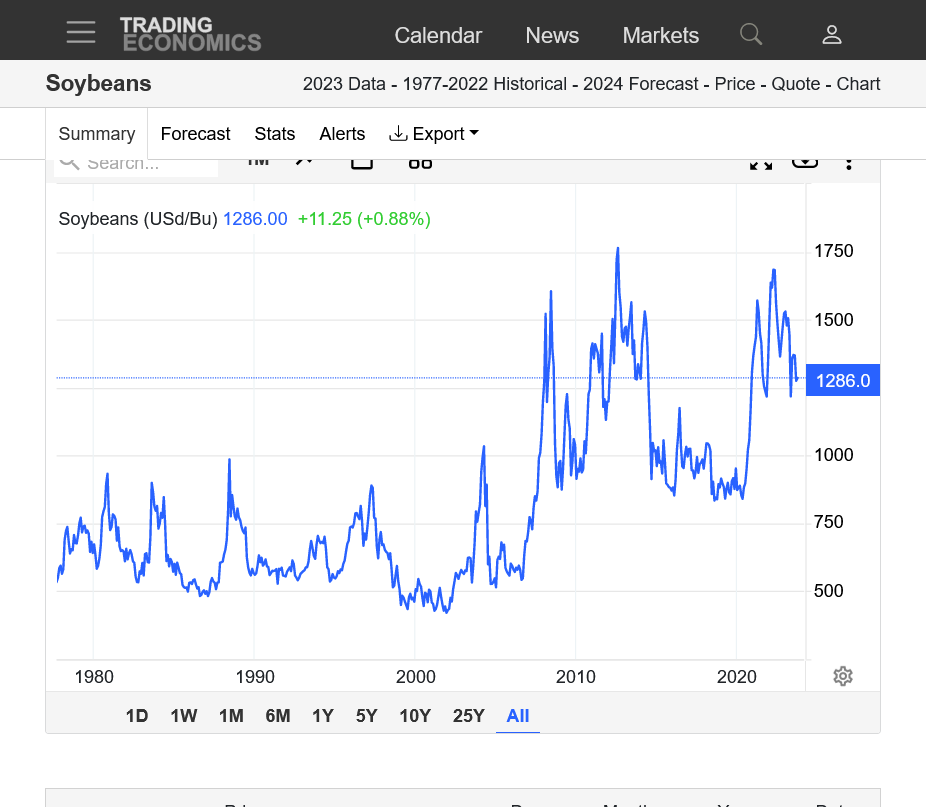
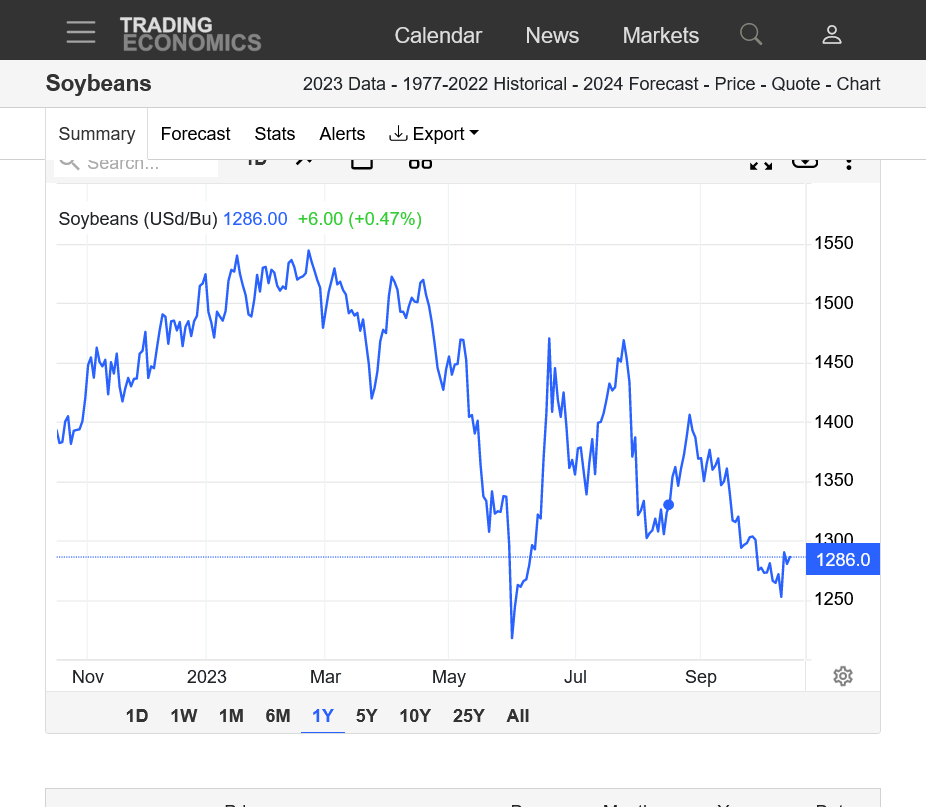
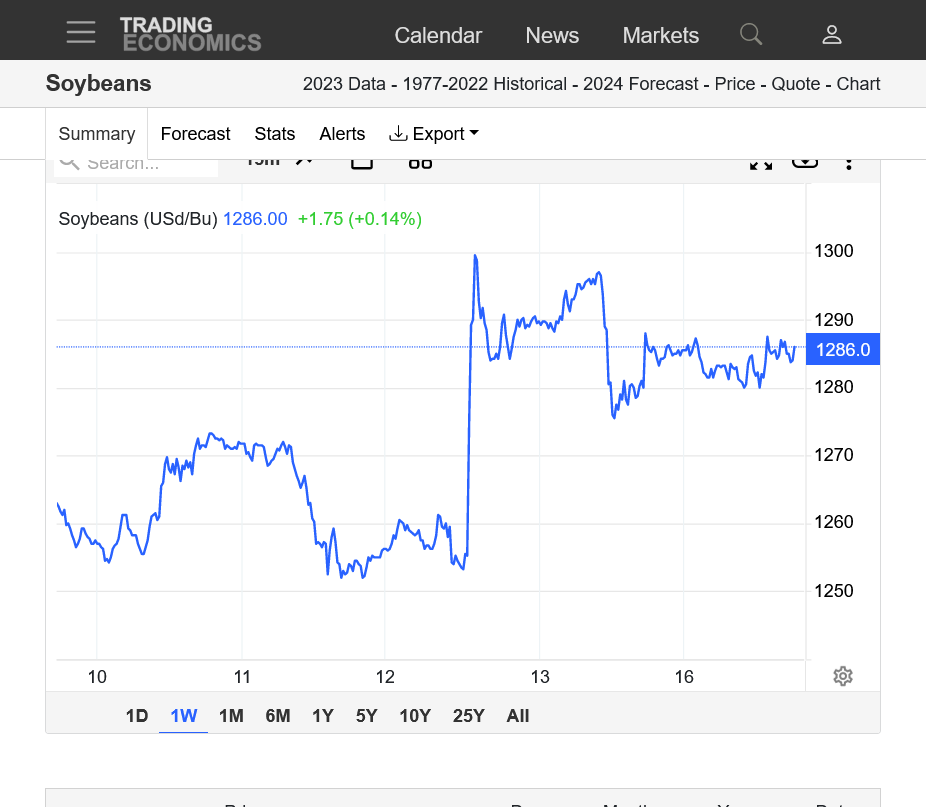
https://tradingeconomics.com/commodity/soybeans
1. 45 years-$16.90 MAJOR high in May 2022
2. 5 years-at major support recently
3. 1 year-double bottom? My guess
OR bear flag?
4. 1 month-dropping to harvest low
5. 1 week-USDA spike higher last Thursday


