
A Magnificent August 7th to you!
Scroll down and enjoy the latest comprehensive weather to the max!!
Rains continue to march south and east.
Mostly dry now Upper Midwest.
The latest rain forecasts are below...........broken down into each period coming up. Then the 1 week totals.
Day 1 below:
http://www.wpc.ncep.noaa.gov/qpf/fill_94qwbg.gif?1526306199054

Day 2 below:
http://www.wpc.ncep.noaa.gov/qpf/fill_98qwbg.gif?1528293750112

Day 3 below:
http://www.wpc.ncep.noaa.gov/qpf/fill_99qwbg.gif?1528293842764

Days 4-5 below:
http://www.wpc.ncep.noaa.gov/qpf/95ep48iwbg_fill.gif?1526306162

Days 6-7 below:
http://www.wpc.ncep.noaa.gov/qpf/97ep48iwbg_fill.gif?1526306162

7 Day Total precipitation below:
http://www.wpc.ncep.noaa.govcdx /qpf/p168i.gif?1530796126

Excessive Rainfall threat. Shifts slowly east and south this week. Rains almost entirely beneficial for Midwest/Plains. See maps below:
Current Day 1 Forecast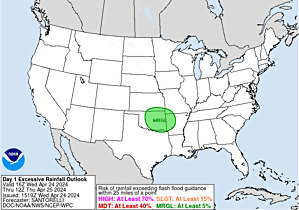 |
Day 1 Threat Area in Text Format
Current Day 2 Forecast |
Day 3 forecast below
Severe Storm Risk. Hit the map for full screen. Eastern Cornbelt/East to S.Plains today........... shifting slowly east/southeast.
https://www.spc.noaa.gov/products/outlook/
Current Day 1 Outlook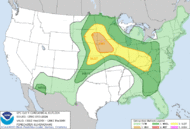 | |
Current Day 2 Outlook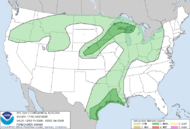 | |
Current Day 3 Outlook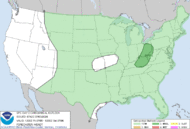 | |
Current Day 4-8 Outlook |
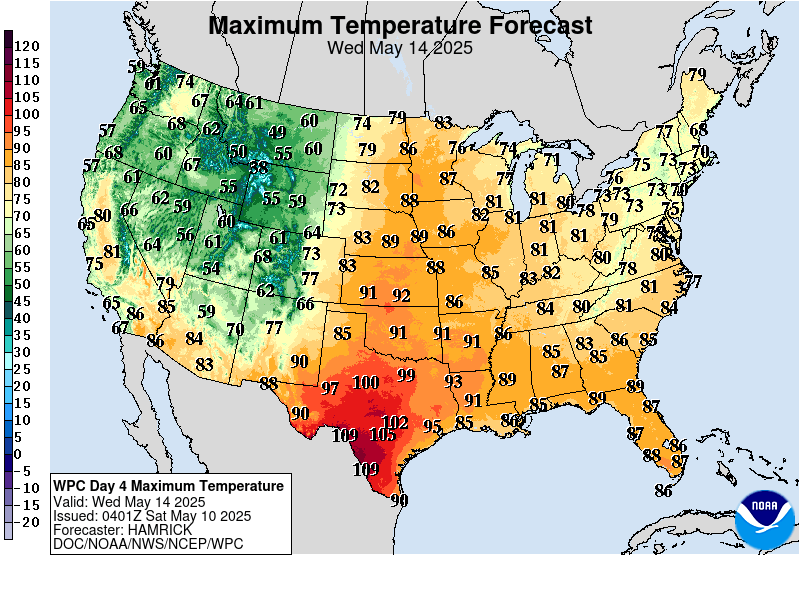
High Temperatures today and Wednesday.
Cooler Midwest/Great Lakes.
Hot along both Coasts and in the South.........much of the country! Record heat along the West Coast up to Canada!!


Dew points. 70+ on this scale makes it feel uncomfortable(sticky air)! Getting more humid with southerly winds over the eastern half of the country....but this moisture is being converted to rains over the next few days as it pools towards the cold front which will be slowly sinking south.
Drier air N.Plains/U.Midwest.

Heat and high humidity COMBINED. Feels like temperature. Feeling sultry over the much of the country. NIce N.PLains/Upper Midwest.
https://www.youtube.com/watch?v=X8Ow1nlafOg

Highs days 3-7.
Great in the Great Lakes and just south/east. Intense heat West moves east into the N.Plains, while the Northwest cools.



Here,in Valley Forge ,Pa., we had a week of high humidity and monsoon like rains. This week we have blazing sunshine,highs in the mid nineties with seventy five percent humidity. Its miserable as !!!
Its good for the plumbing and air conditioning business!
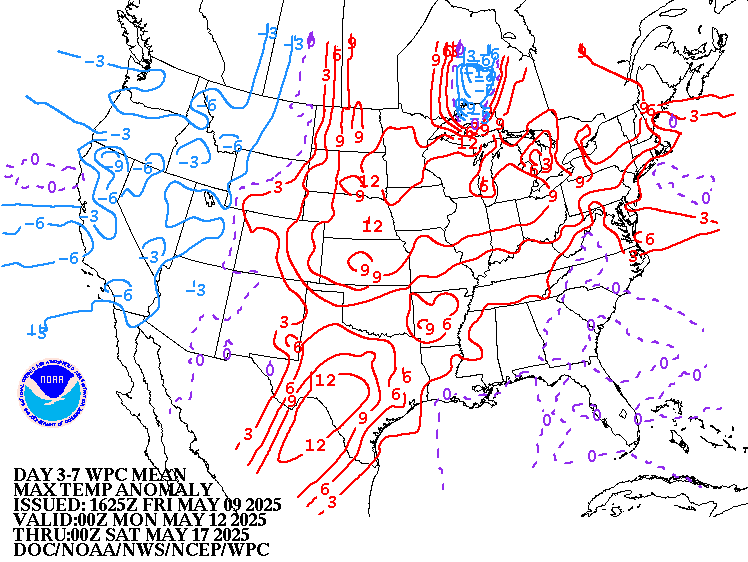
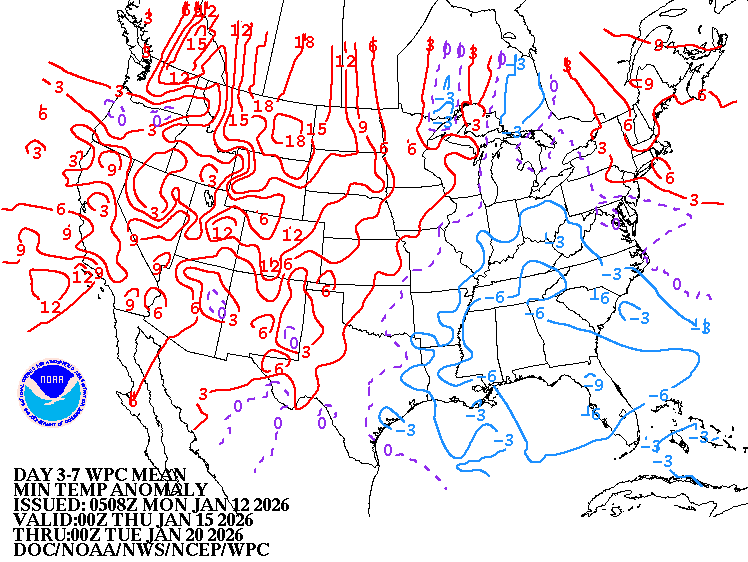
How do these days 3-7 temperatures compare to average at this time of year? We have now past the climatological time of year when temperatures are the hottest.
Above average West/Rockies to N.Plains and eventually Upper Midwest. A bit below S.Plains.
High temperature departures:
Low Temperature Departures:
Weather system from Plains to Great Lakes/Ohio Valley. High pressure Southeast........pumping in the heat and Gulf moisture on its backside.
https://weather.com/maps/currentusweather

Satellite picture. Clouds from the Eastern Great Lakes/Ohio Valley to Midwest to S.Plains.

Rains the past 24 hours. Much of the Cornbelt.
![]()
Missouri to S.Plains in bad shape....too dry. Singing in the rains. 
You can go to this link to see rain totals from recent time periods:
https://water.weather.gov/precip/
Go to precipitation, then scroll down to pick a time frame. Hit states to get the borders to see locations better. Under products, you can hit "observed" or "Percent of normal"
Below are rains compared to average of the last 7, 14, 30 and 60 days. Usually not updated for previous day until late the next day.
https://www.atmos.illinois.edu/~snodgrss/Ag_Wx.html


Drought Monitor. This product is updated every Thursday.
http://droughtmonitor.unl.edu/Maps/CompareTwoWeeks.aspx

The low skill, longer range CFS model for weeks 3 and 4. Hot West! Cool and dry East.

Precip below:

12Z operational GFS is much warmer/hot compared to the previous 6z run but the one before that, the 0z run was also this hot. Note the heat ridge over the East below.
This is supporting the upside breakout for natural gas.
With regards to rains...........not alot for the northwest half of the Cornbelt.
gfs_namer_348_200_wnd_ht | gfs_namer_348_500_vort_ht |
gfs_namer_348_1000_500_thick | F372_precip_ptot.gif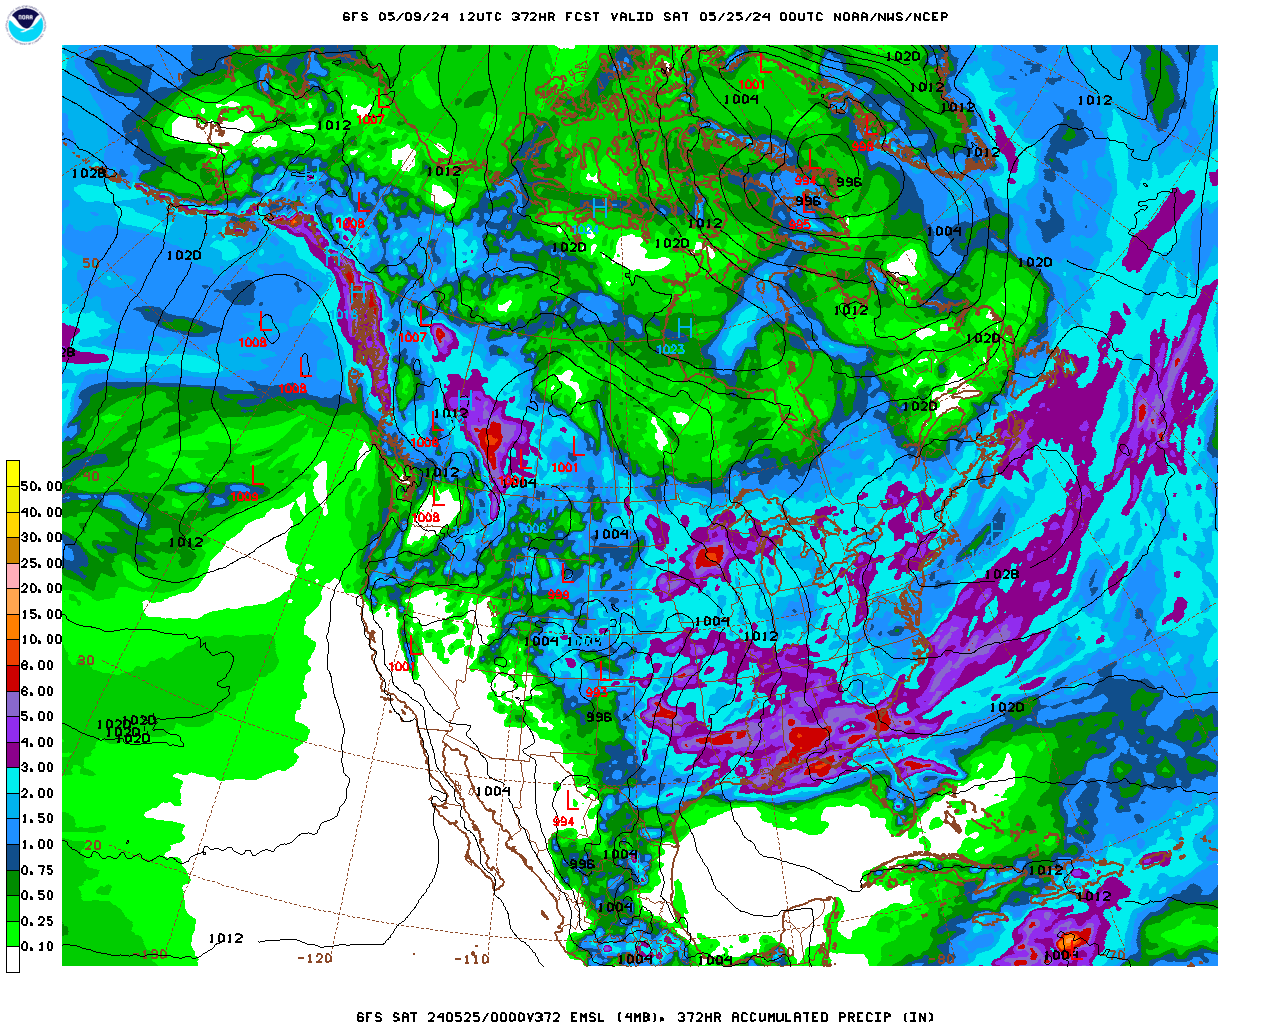 |
All of the just updated 12z Canadian model ensembles have a very impressive heat ridge somewhere in the country.
Massive disparity on where to put it. This will make all the difference with regaarrds to where the high heat will be and where it won't be quite as hot.
384h GZ 500 forecast valid on Aug 23, 2018 12 UTC
Forecasts for the control (GEM 0) and the 20 ensemble members (global model not av
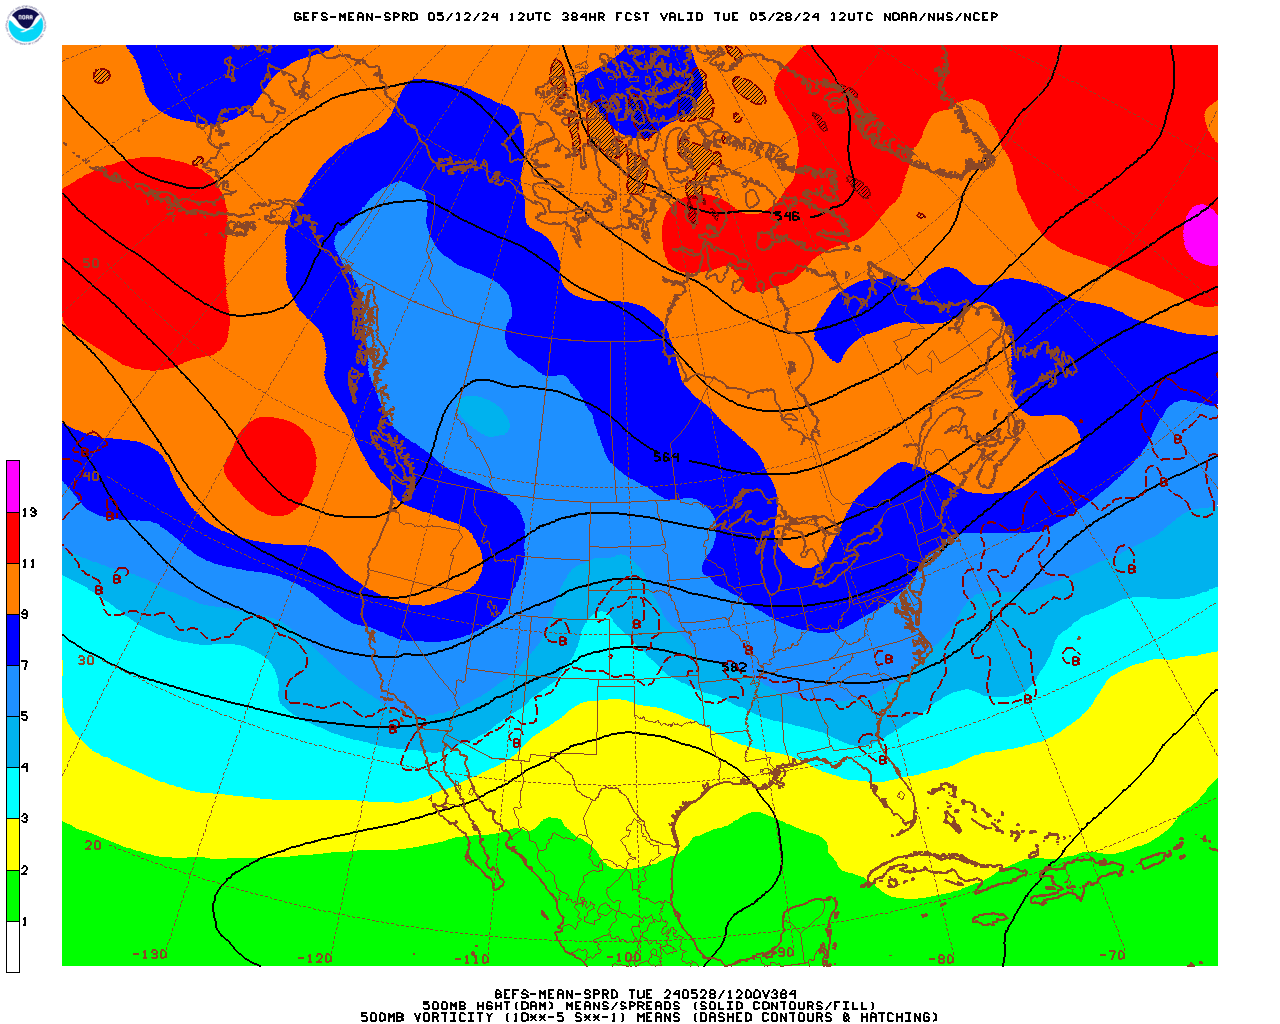
12 Z GFS ensembles/mean looking very impressive with the upper level ridge in the southern 2/3rd of the country with widespread heat up to the Canadian border during week 2:
Forecast Hour: 384
Image URL: http://mag.ncep.noaa.gov/data/gefs-mean-sprd/12/gefs-mean-sprd_namer_384_500_vort_ht.gif
"Here,in Valley Forge ,Pa., we had a week of high humidity and monsoon like rains. This week we have blazing sunshine,highs in the mid nineties with seventy five percent humidity. Its miserable as !!!
Its good for the plumbing and air conditioning business!"
Thanks Mike!
Especially since this reminded me that I need to clean out the condenser coils in our air conditioners!
The maps below are from the NWS extended outlooks. The week 2 period is very uncertain right now, partly because of the very active Eastern Pacific which could change initial conditions that are fed into computer forecast models. Changes can amplify downstream with time and greatly effect the weather in North America.
The forecasts below have plenty of above normal temperatures and there is normal to above normal rain in many places.
Tomorrows forecast could be different.
6-10 day Temperature Probability | |
Precipitation Probability | |
8-14 day Temperature Probability | |
Precipitation Probability | |
Extreme weather days 3-7:
Heat in N.Rockies into the N.Plains. Elevated Wildfire risk east of the Cascades the next several days.....until 8-10.
Heavy rain in TX............welcome to help drought.

The last 18z GFS was a great deal cooler in the Midwest/East than the previous, 12z run was during week 2.
It looks more like the European model. Recent GFS model output has had a warm bias.
gfs_namer_240_200_wnd_ht | gfs_namer_240_500_vort_ht |
gfs_namer_240_1000_500_thick | gfs_namer_240_850_temp_ht |