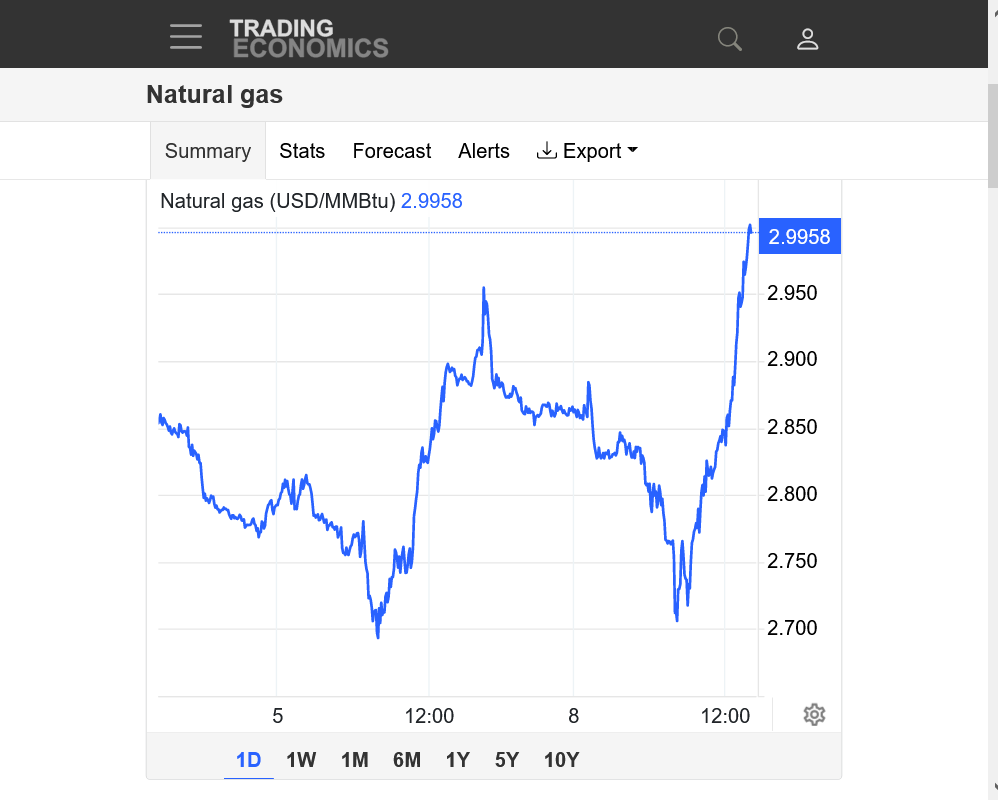
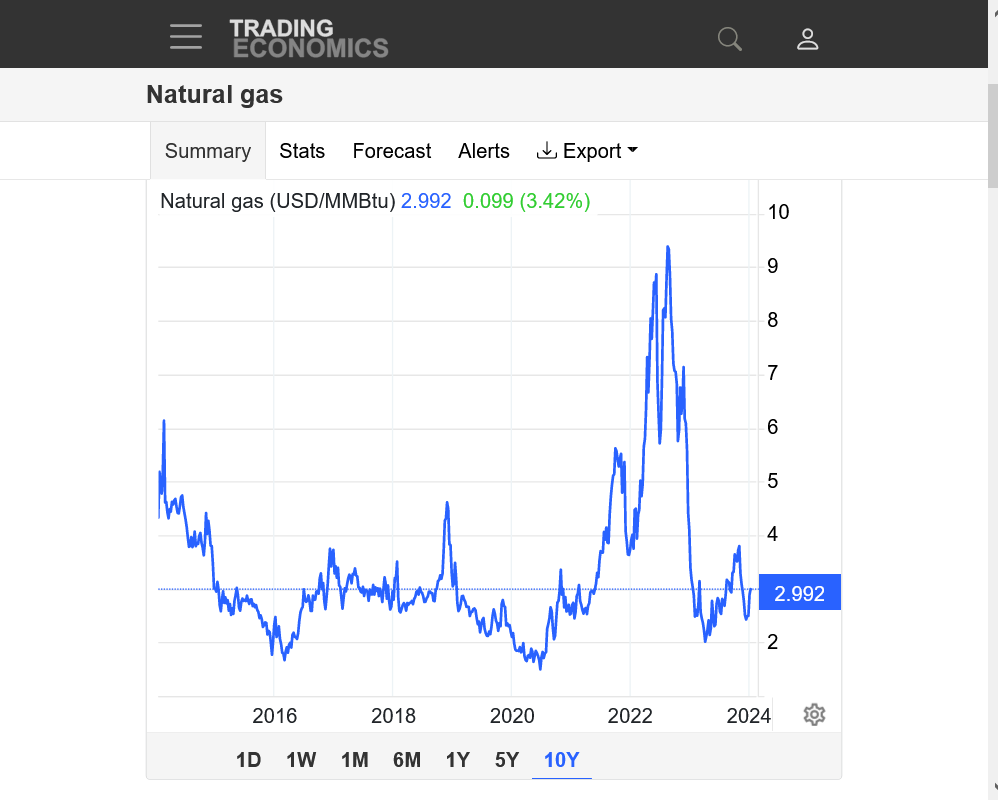
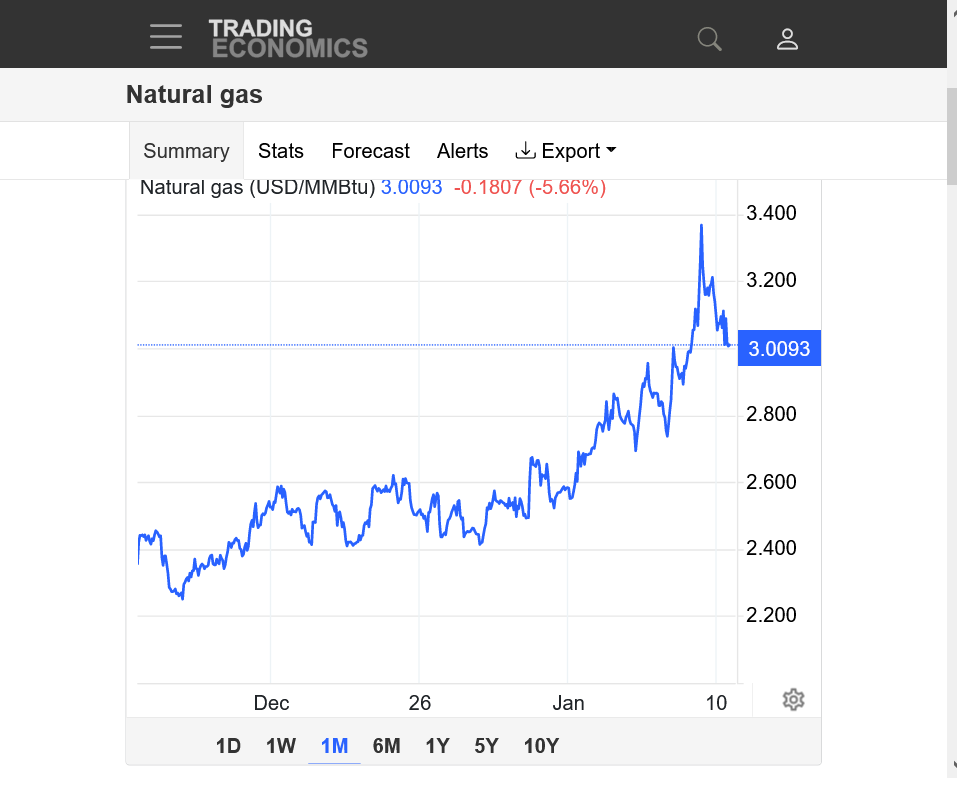
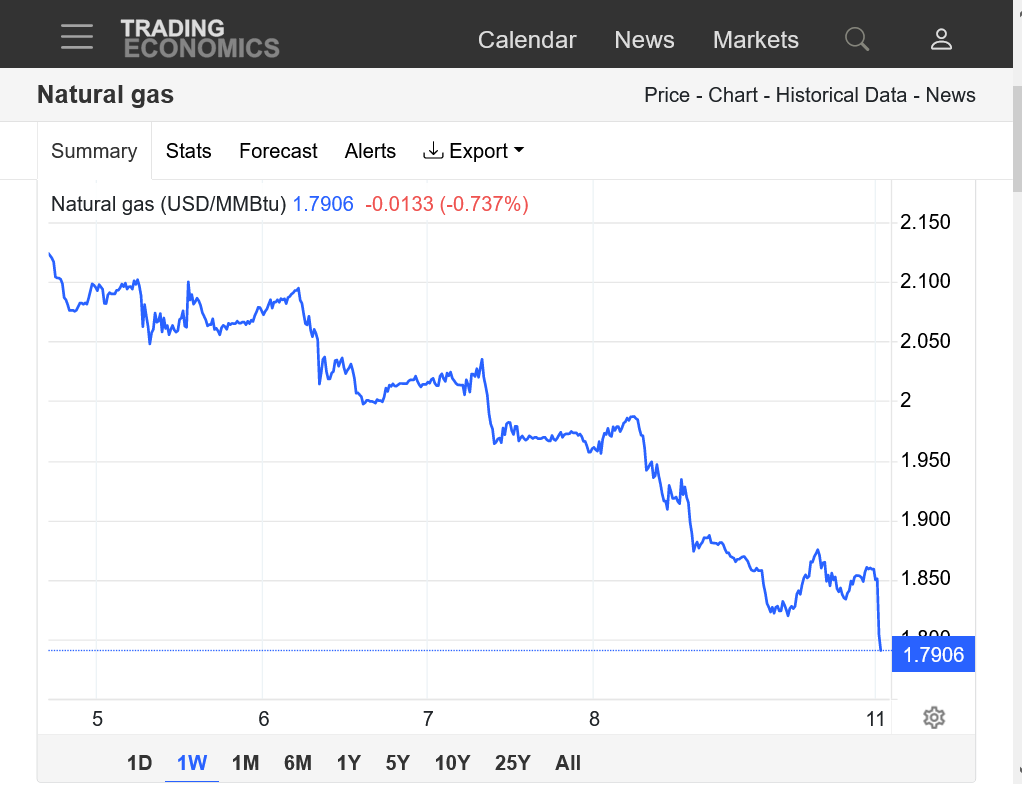
Wild, volatile trading in NG to start the work week.
Gap higher last night filled quickly, providing a buying exhaustion gap after a long move higher that is usually a powerful technical formation.
This occurred because of all the weather models agreeing on the cold rapidly moderating during week 2 and the weather turning bearish. We continued to plunge overnight and were $2,500/contract lower from the sharply higher open at 8am this morning.
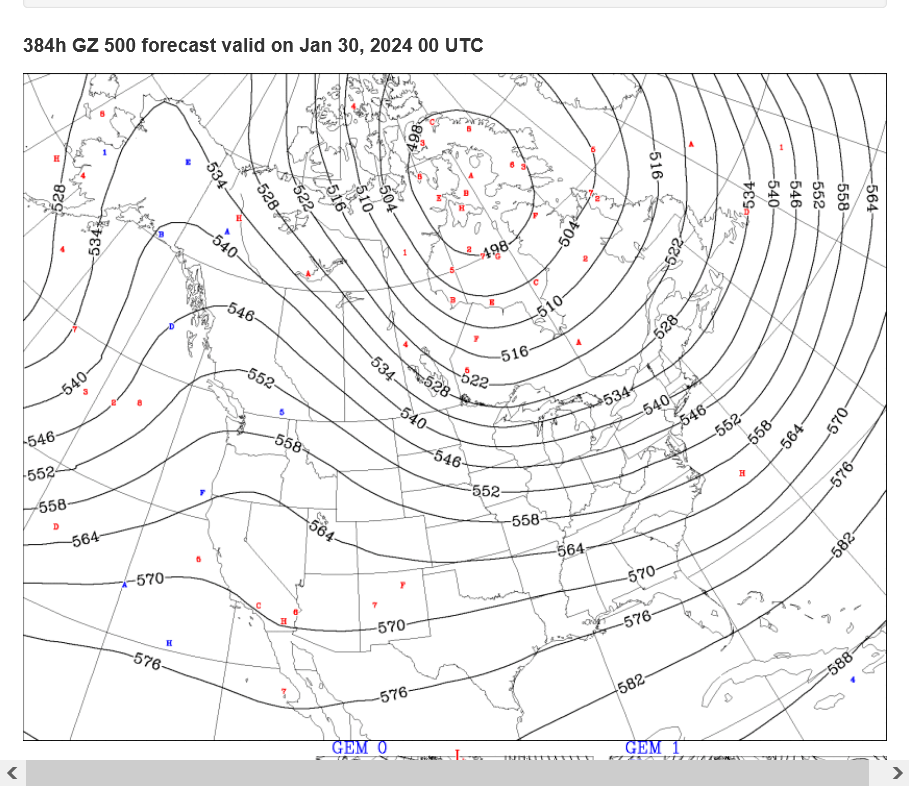
........but then the weather models added tons of cold with the 12z updates and we reversed up and are +3,000/contract from those lows and making new highs above the psychological resistance price level of $3.
+++++++++++++
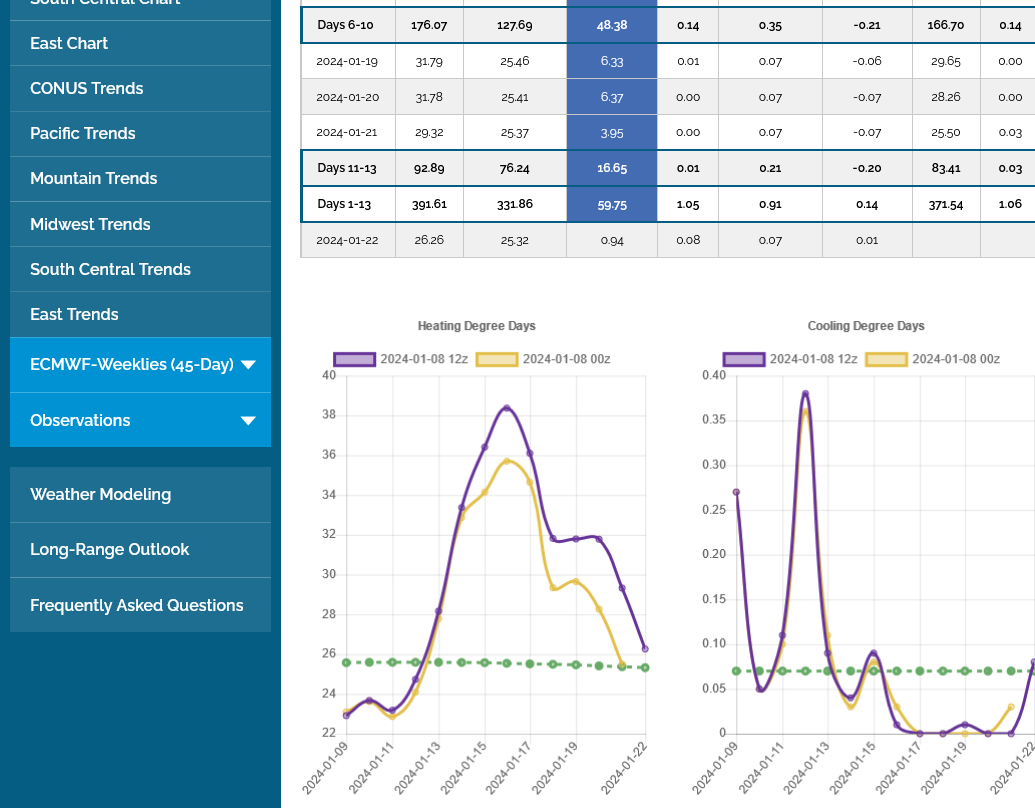
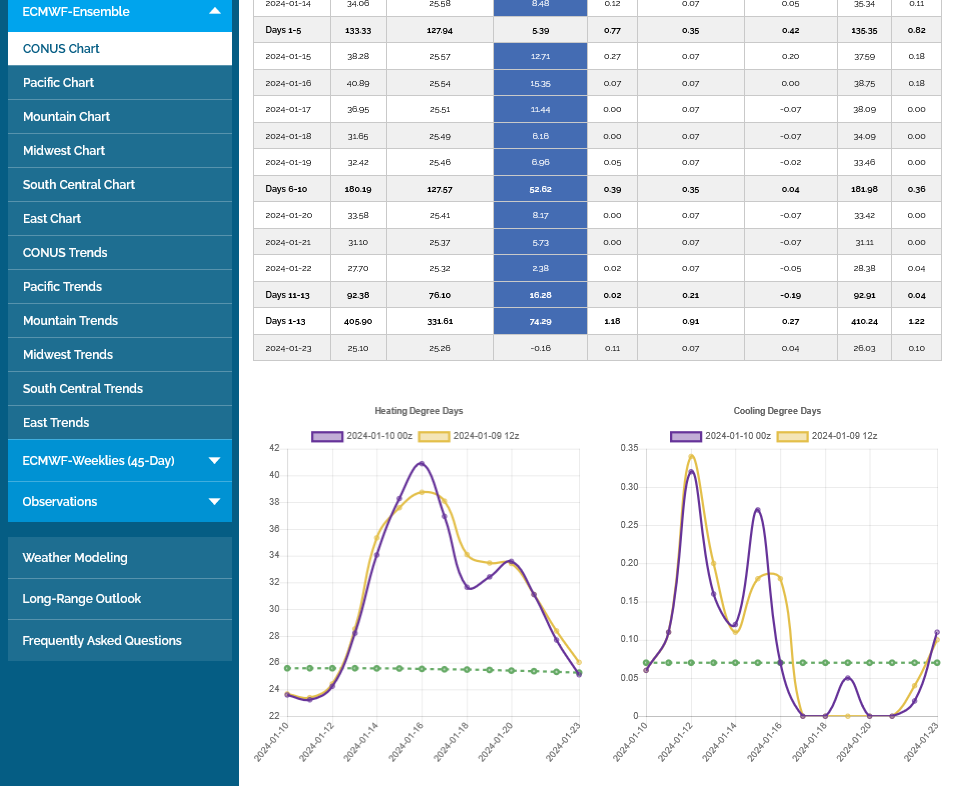
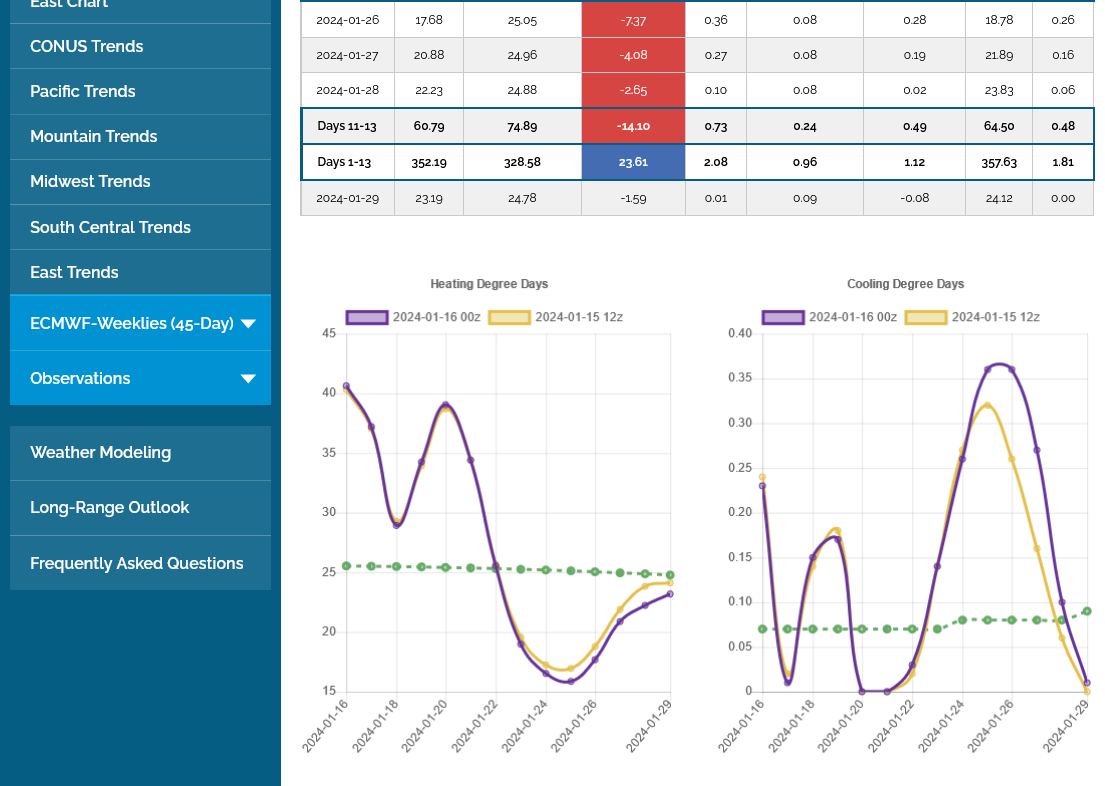
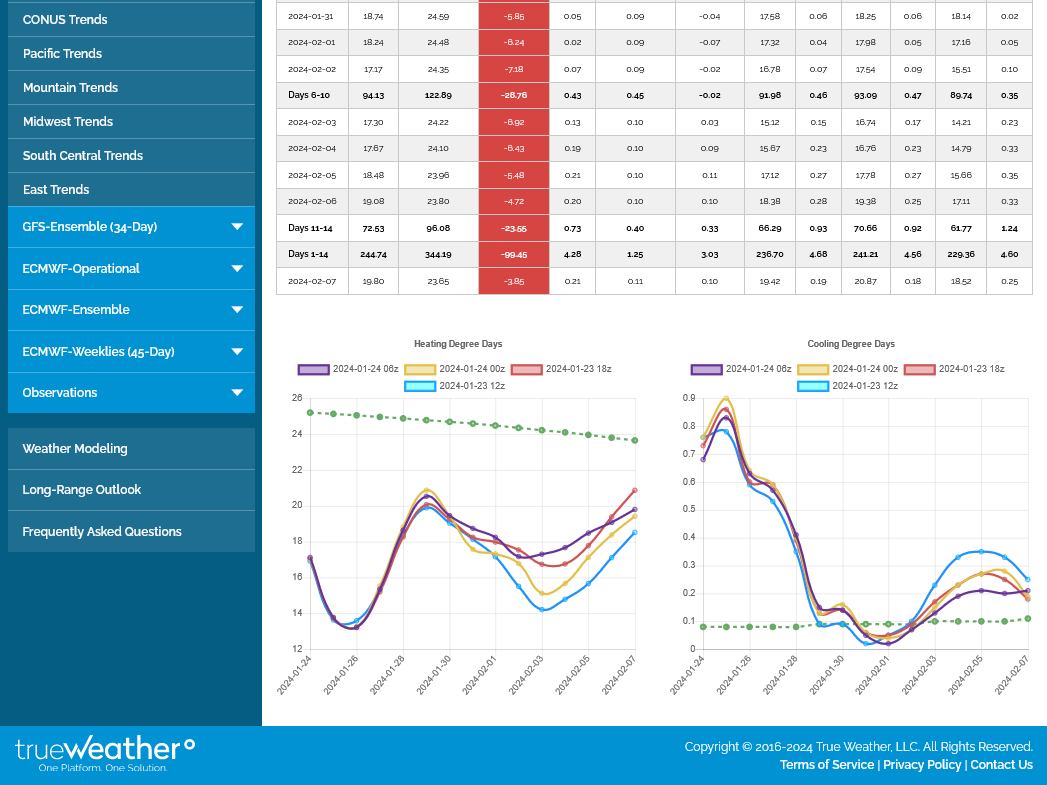
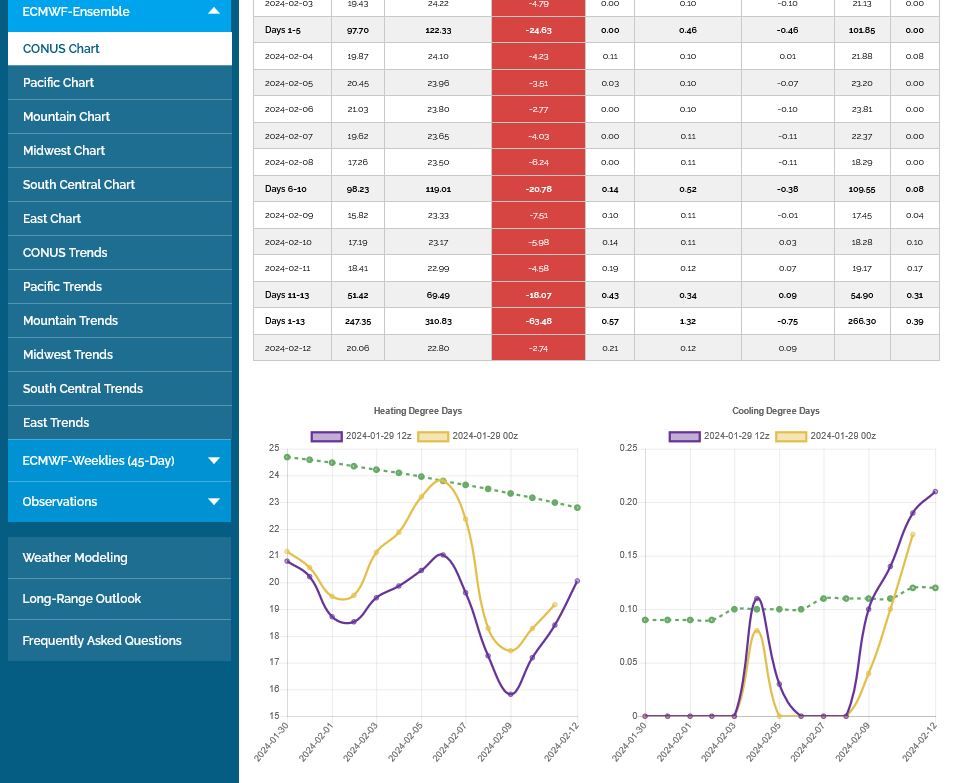
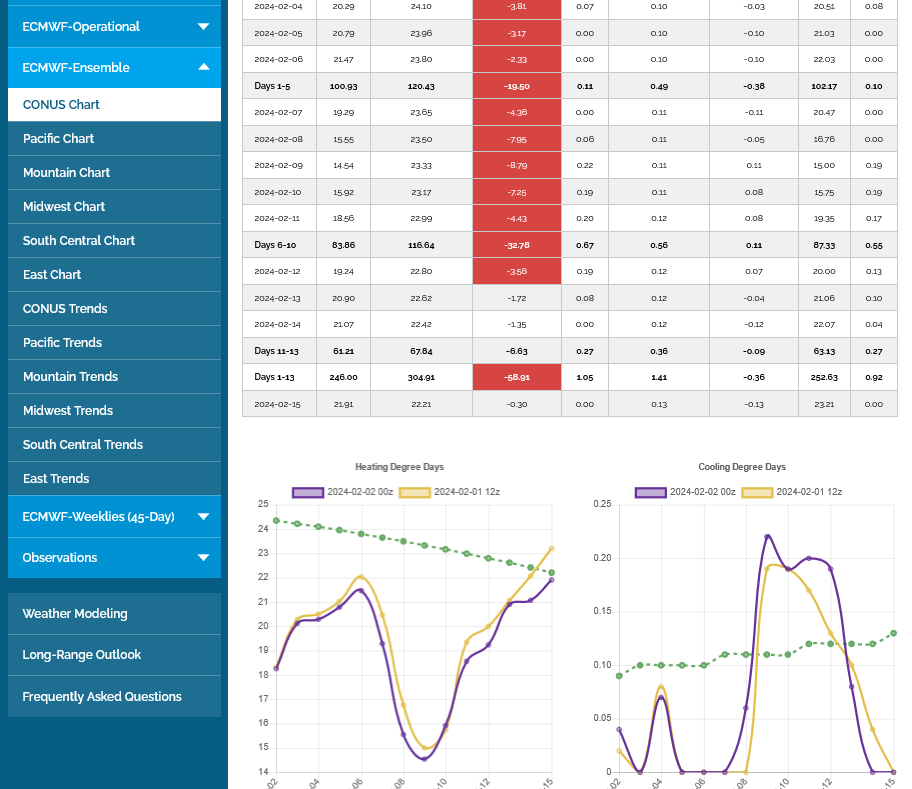
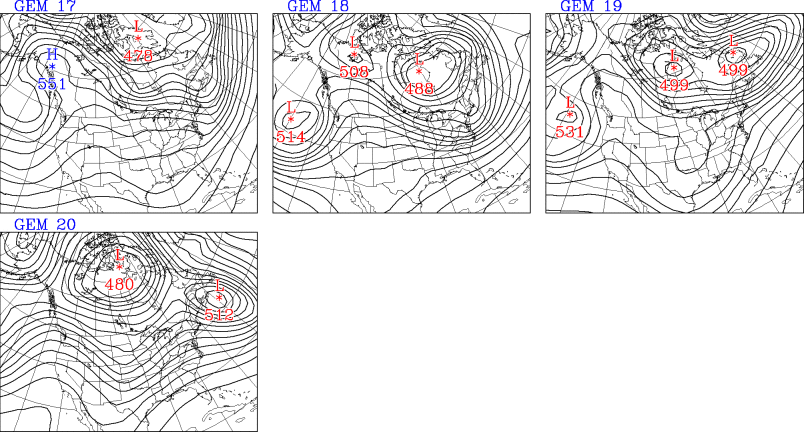
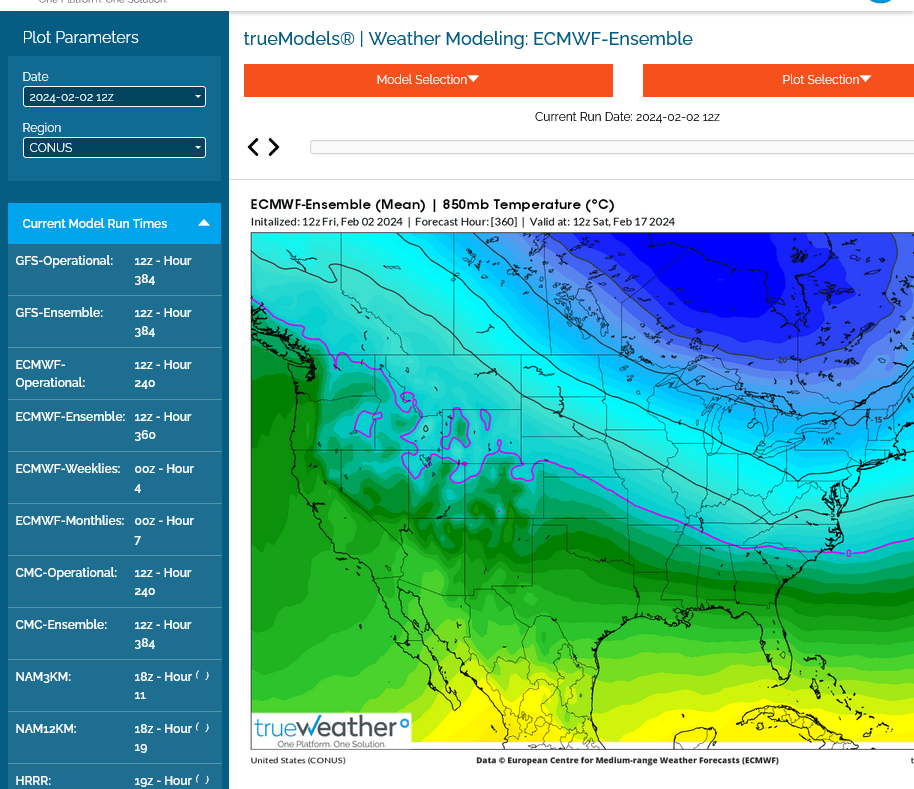
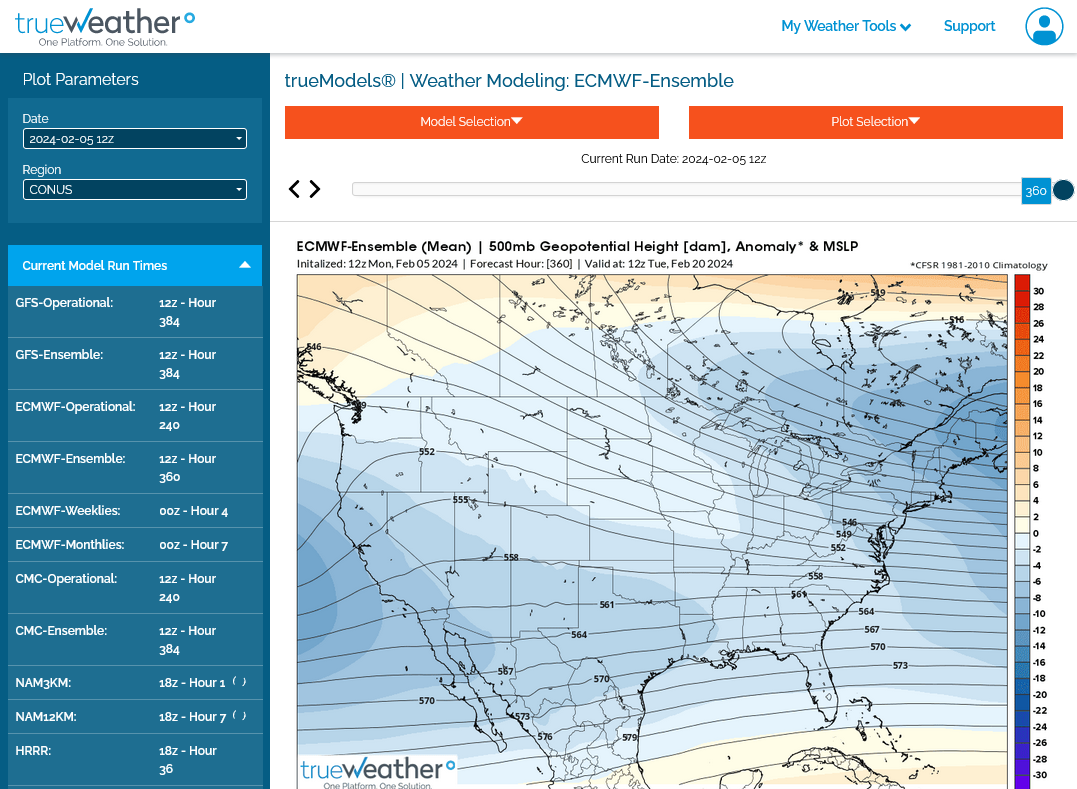
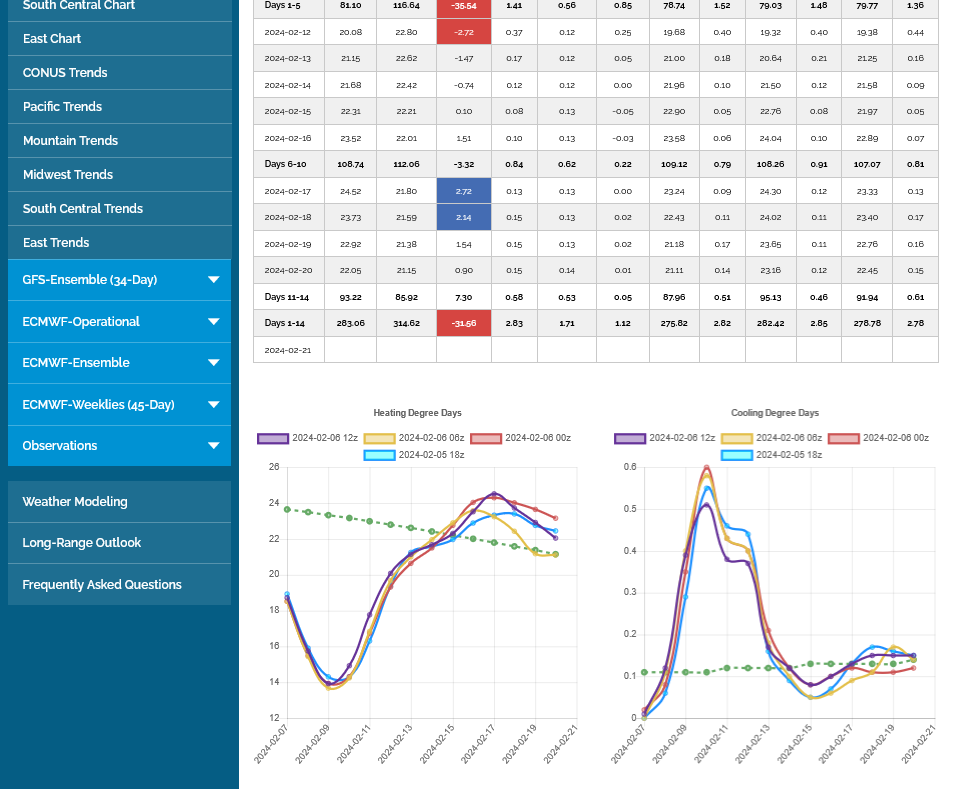
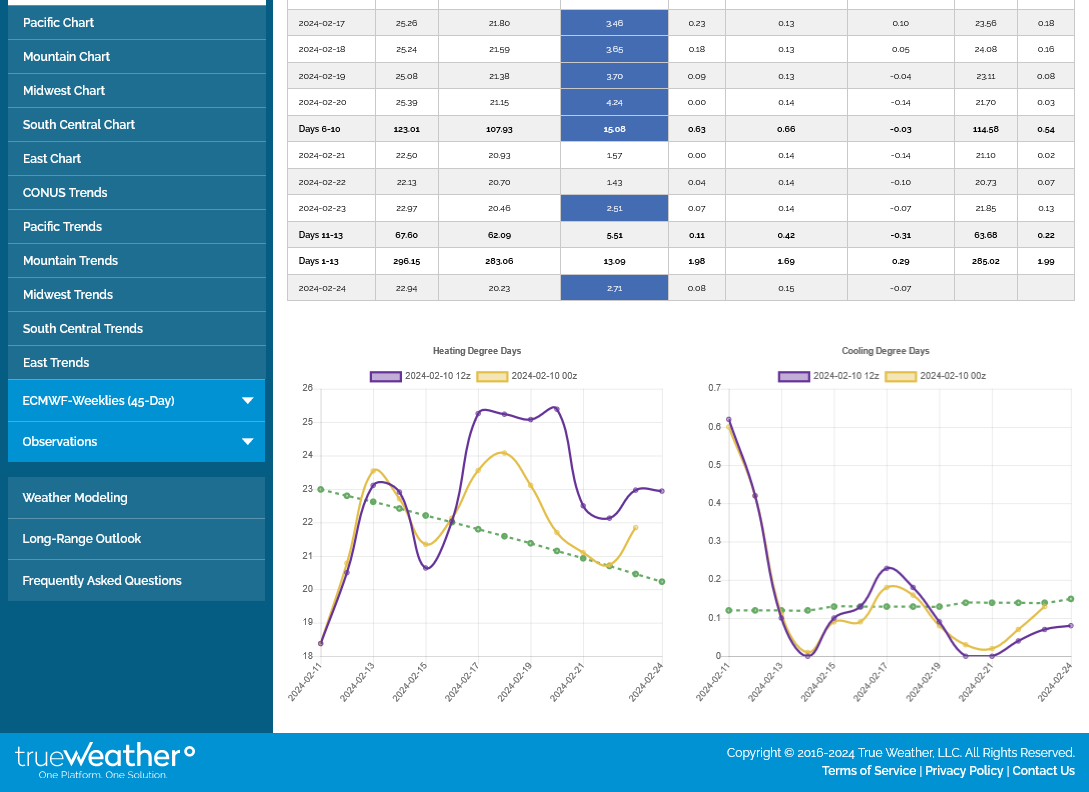
This was the last 12z European Ensemble model forecast for 2 weeks in purple on the left. An incredible increase of 20 HDDS in just 1 model run, which helped the market to climb up $3,000/contract in less than 6 hours. The green is average. This is the first spike higher above average of this magnitude since last Winter.
Note: regardless of the bullish change, there's still no denying the plunge lower at the end of week 2. This will ultimately determine the fate of ng prices. If that plunge remains all week, ng prices will likely drop, especially with such robust storage levels.
Charts below.
1. 1 day-described above
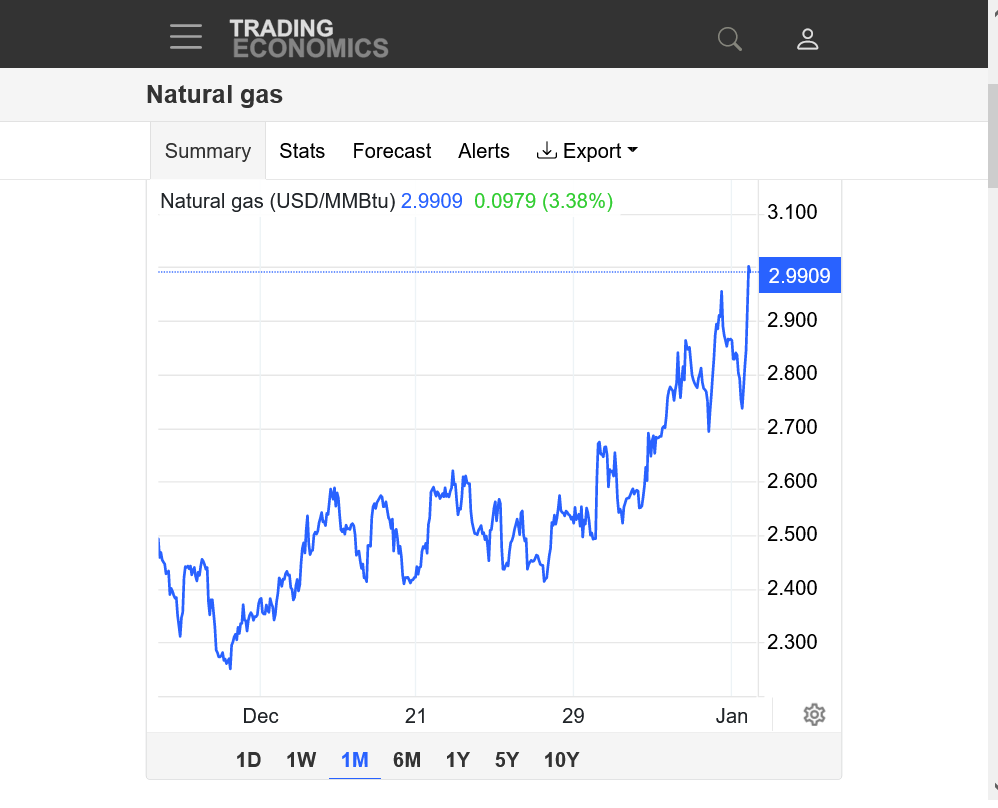
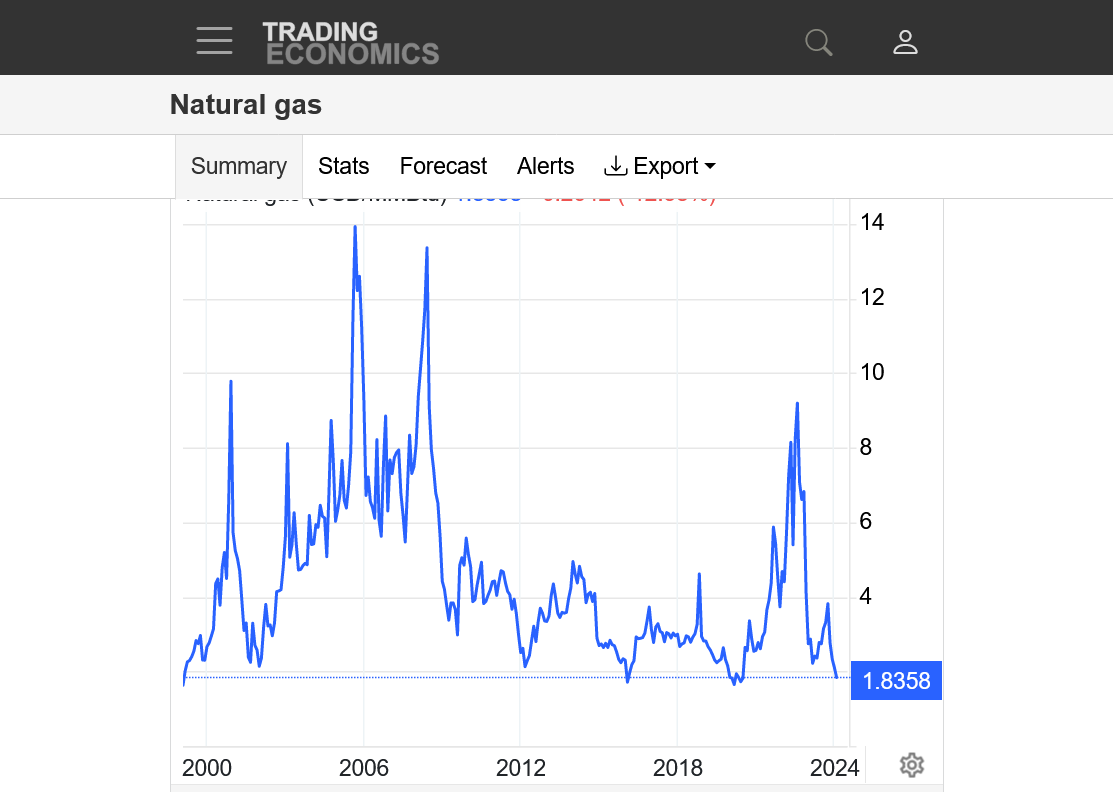
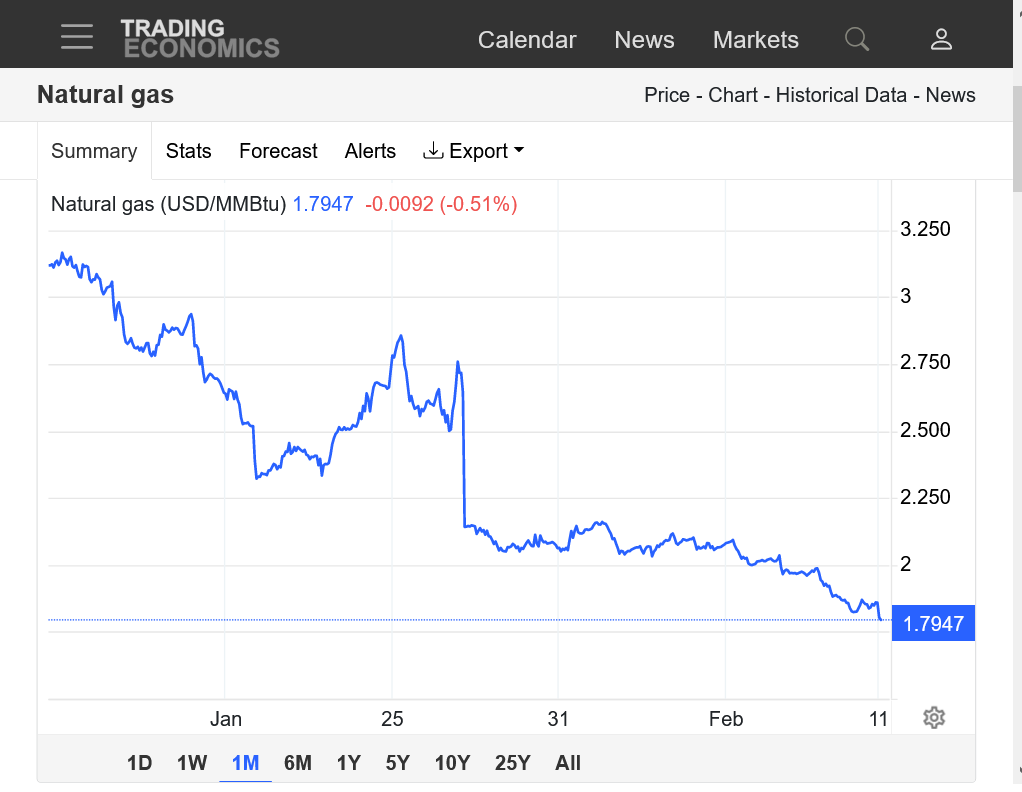
2. 1 month-strong uptrend from upcoming cold being dialed in +$7,000/contract in a month.
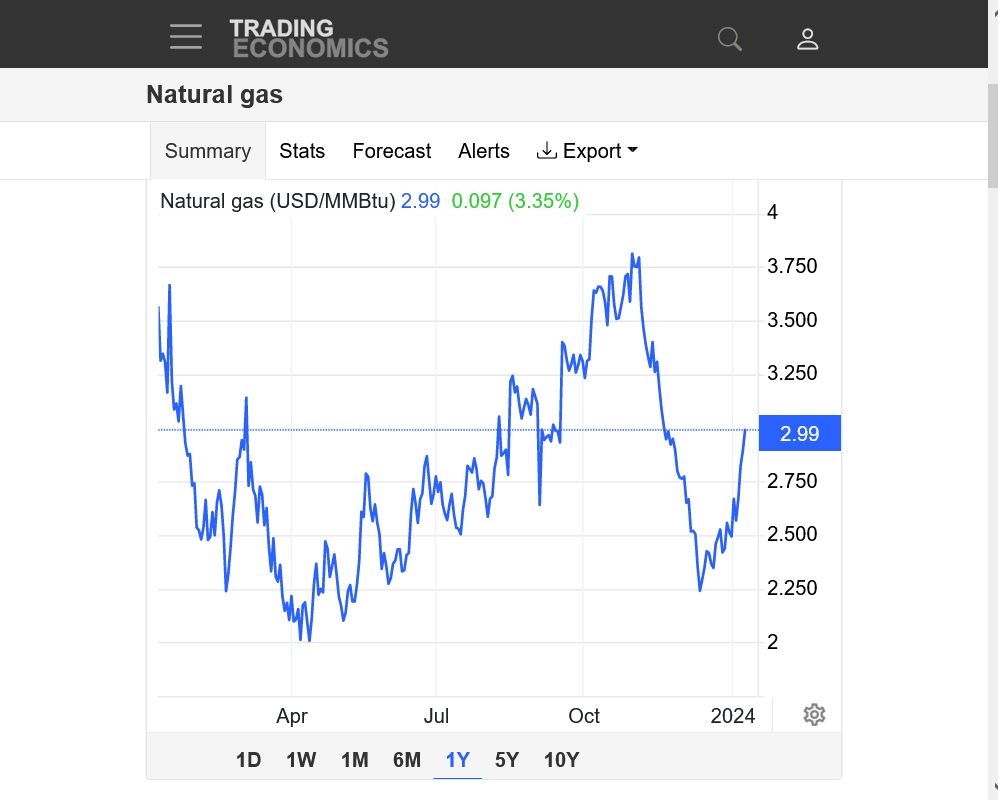
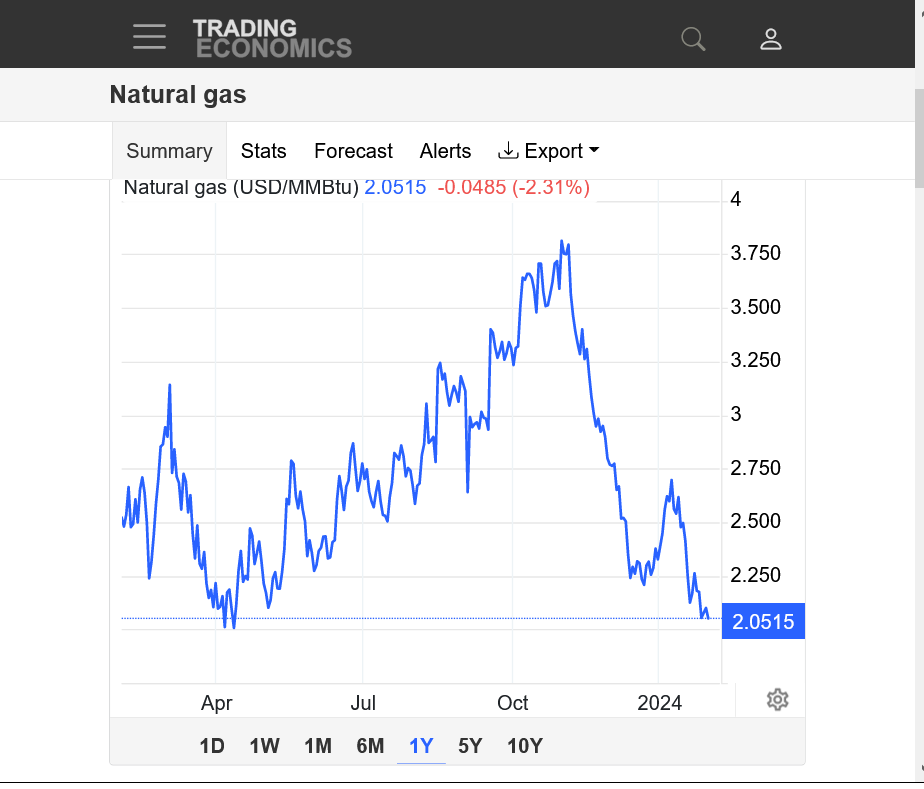
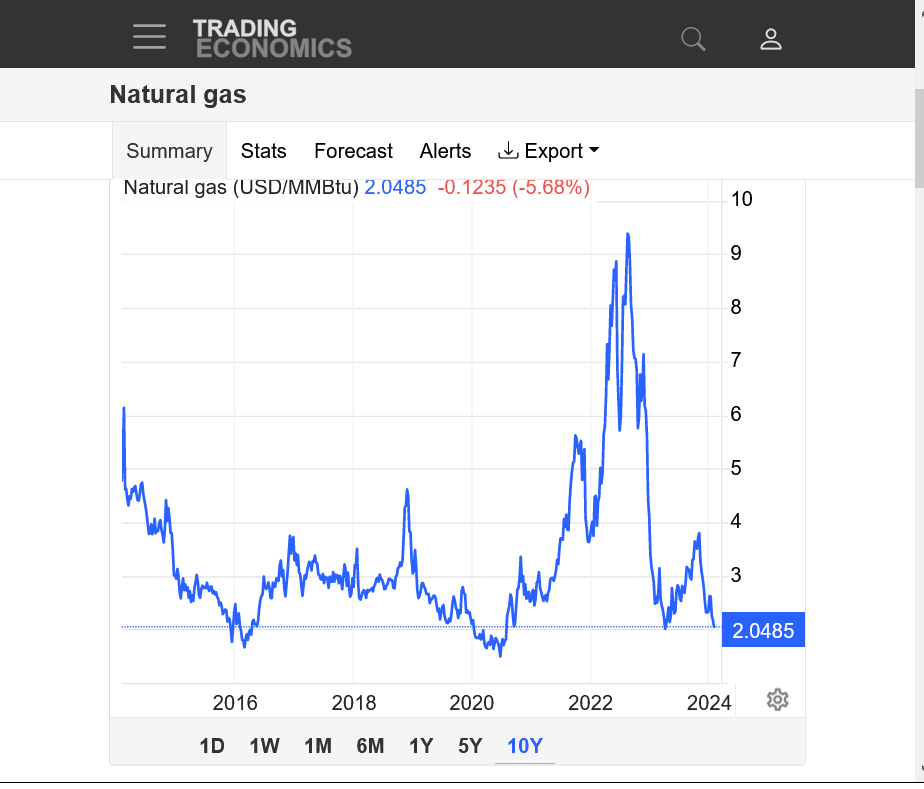
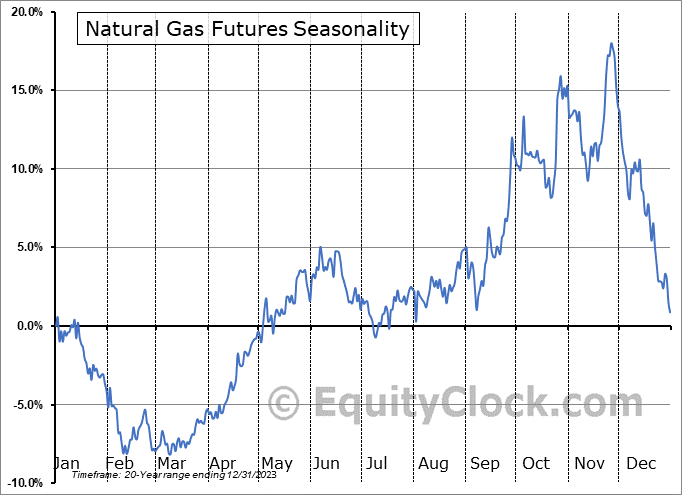
3. 1 year-lows in April, from supply glut, spike seasonal high in late Oct. Spike low in early Dec from mild first part of Winter, then the market started trading cold January weather.
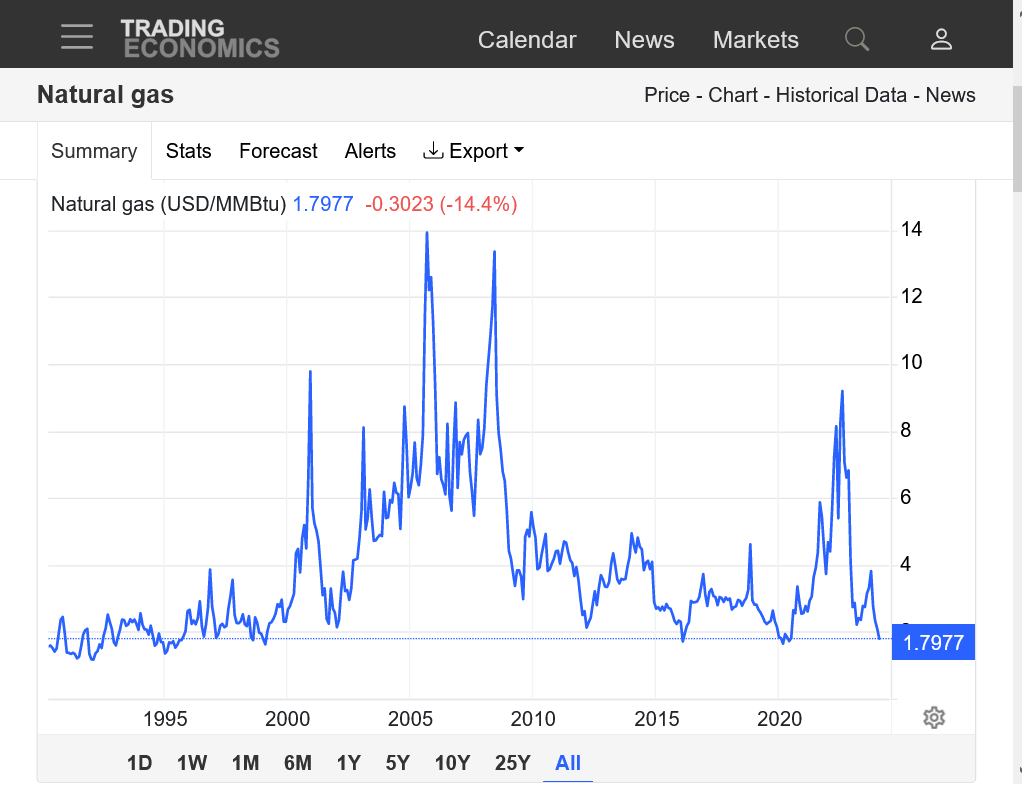
4. 10 years-Mega high in August 2022 from very low ng in storage which provided financial incentive for producers to gush out supplies that made up the storage deficit, then created a massive surplus at the greatest rate in history. This, in combination with a mild Winter caused prices to collapse to extremely low prices by the end of last Winter. The current $7,000/contract move higher in the last month looks like a blip at the end.
https://tradingeconomics.com/commodity/natural-gas
Previous thread:
Natural Gas 11-12-23
55 responses |
Started by metmike - Nov. 12, 2023, 6:38 p.m.
![]()
for week ending December 29, 2023 | Released: January 4, 2024 at 10:30 a.m. | Next Release: January 11, 2024
| Working gas in underground storage, Lower 48 states Summary text CSV JSN | |||||||||||||||||||||||||
|---|---|---|---|---|---|---|---|---|---|---|---|---|---|---|---|---|---|---|---|---|---|---|---|---|---|
| Historical Comparisons | |||||||||||||||||||||||||
| Stocks billion cubic feet (Bcf) | Year ago (12/29/22) | 5-year average (2018-22) | |||||||||||||||||||||||
| Region | 12/29/23 | 12/22/23 | net change | implied flow | Bcf | % change | Bcf | % change | |||||||||||||||||
| East | 799 | 805 | -6 | -6 | 699 | 14.3 | 736 | 8.6 | |||||||||||||||||
| Midwest | 968 | 985 | -17 | -17 | 848 | 14.2 | 877 | 10.4 | |||||||||||||||||
| Mountain | 228 | 232 | -4 | -4 | 158 | 44.3 | 170 | 34.1 | |||||||||||||||||
| Pacific | 280 | 280 | 0 | 0 | 165 | 69.7 | 228 | 22.8 | |||||||||||||||||
| South Central | 1,201 | 1,187 | 14 | 14 | 1,054 | 13.9 | 1,066 | 12.7 | |||||||||||||||||
| Salt | 344 | 329 | 15 | 15 | 278 | 23.7 | 313 | 9.9 | |||||||||||||||||
| Nonsalt | 857 | 858 | -1 | -1 | 776 | 10.4 | 753 | 13.8 | |||||||||||||||||
| Total | 3,476 | 3,490 | -14 | -14 | 2,923 | 18.9 | 3,077 | 13.0 | |||||||||||||||||
Totals may not equal sum of components because of independent rounding. | |||||||||||||||||||||||||
Working gas in storage was 3,476 Bcf as of Friday, December 29, 2023, according to EIA estimates. This represents a net decrease of 14 Bcf from the previous week. Stocks were 553 Bcf higher than last year at this time and 399 Bcf above the five-year average of 3,077 Bcf. At 3,476 Bcf, total working gas is above the five-year historical range.
For information on sampling error in this report, see Estimated Measures of Sampling Variability table below.

Note: The shaded area indicates the range between the historical minimum and maximum values for the weekly series from 2018 through 2022. The dashed vertical lines indicate current and year-ago weekly periods.
++++++++++++
The amount of natural gas in storage is at or above the most in history for this time of year!!
These were the amazingly mild temperatures for that last EIA report:
These were last weeks temps that will go into this Thursdays. 9:30am release. Mild Northern half/West, chilly Southeast(where a lot of people live and don't like cold):
Natural gas futures pared their recent gains early Wednesday as updated weather models moderated for later this month, while in the nearer term, cold was already showing signs of hampering production. After rallying 21.0 cents in Tuesday’s session, the February Nymex contract was down 14.2 cents to $3.048/MMBtu at around 8:36 a.m. ET. Both the…
++++++++++++++++
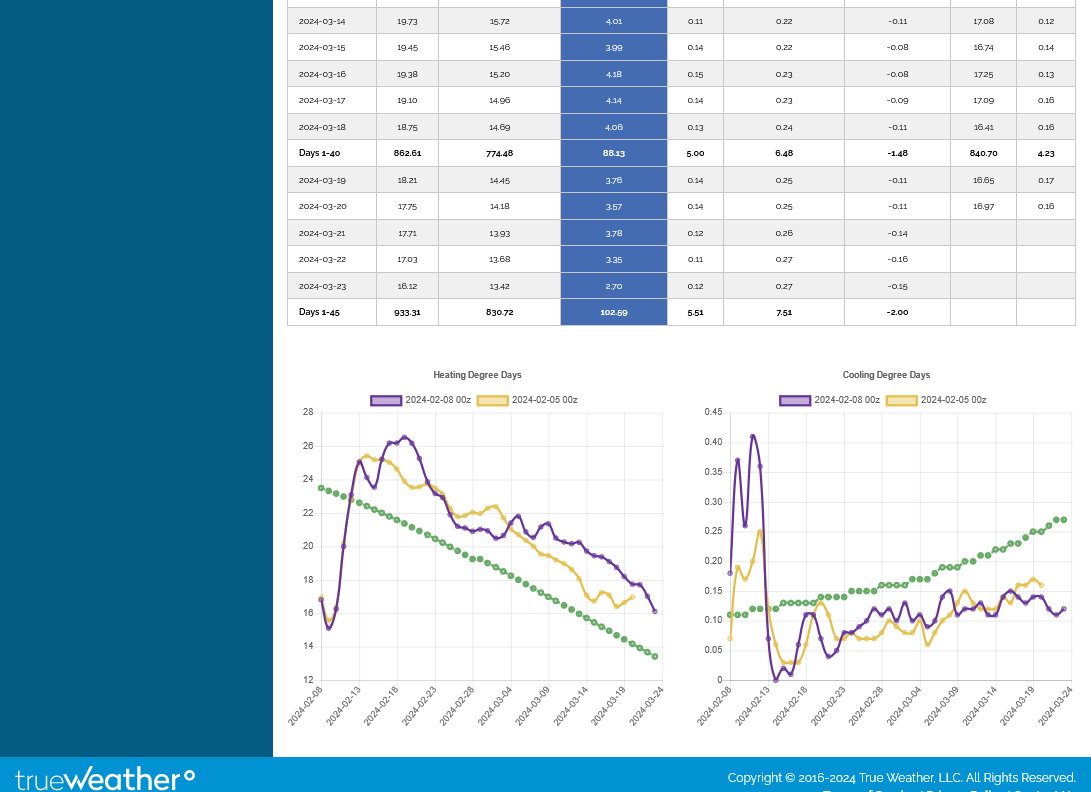
The highs are in!!!! Unless the pattern unexpectedly turns much colder. The last 0z European model was -4 HDDS overnight.
It's the purple in on the left. The brown line is the previous run. The green dashed line is the average which is starting to slowly drop seasonally now. The period below is 2 weeks.
Note the spike higher in HDDs is brief and we plunge back to average at the end of 2 weeks(and turn milder than that in week 3). The market is ALWAYS looking ahead and dialing in NEW information, usually weeks before it happens.
We had a massive spike higher yesterday, to almost 3.400 and $11,000+/contract above the price a month ago. This should have marked the top for this move with moderate confidence.
Mainly a huge change to much colder in week 2 and beyond will break those highs. We have some massive drawdowns coming up but there is RECORD HIGH NG IN STORAGE and half the heating season is over. The market has dialed in all the cold with this current pattern. We need NEW COLD, not in the forecast to generate NEW HIGHS.
https://tradingeconomics.com/commodity/natural-gas
Natural gas futures on Wednesday floundered for the first time this year, with speculators hesitant to hold positions and bears seizing upon forecasts for a late January warm-up. Following gains every regular session of 2024 through Tuesday, when prices jumped 21.0 cents, the February Nymex gas futures contract on Wednesday shed 15.1 cents day/day and…
+++++++++++++++
We added +8 HDDs on the 12z European model late in the regular session. This is bullish but could only generate a dead cat bounce of +1,000/contract off the lows because, as you can see below, it's THE SAME PATTERN CHANGE to rapidly eroding extreme cold.
+8 HDDs because of colder individual days on 1 model run have extremely limiting power to move the market beyond a `1 day, knee jerk reaction. THE MARKET TRADES THE OVERALL WEATHER PATTERN!
If the pattern is CHANGING, then it will have staying power. The pattern IS CHANGING...........to milder in week 2. Bullish market speculators are not going to buy aggressively and hold when they know that the new days tomorrow at the end of the forecast period, replacing the currently expiring days at the front of the forecast WILL BE MILDER.
That's sort of the key principle to trading natural gas 101 for profits in Winter.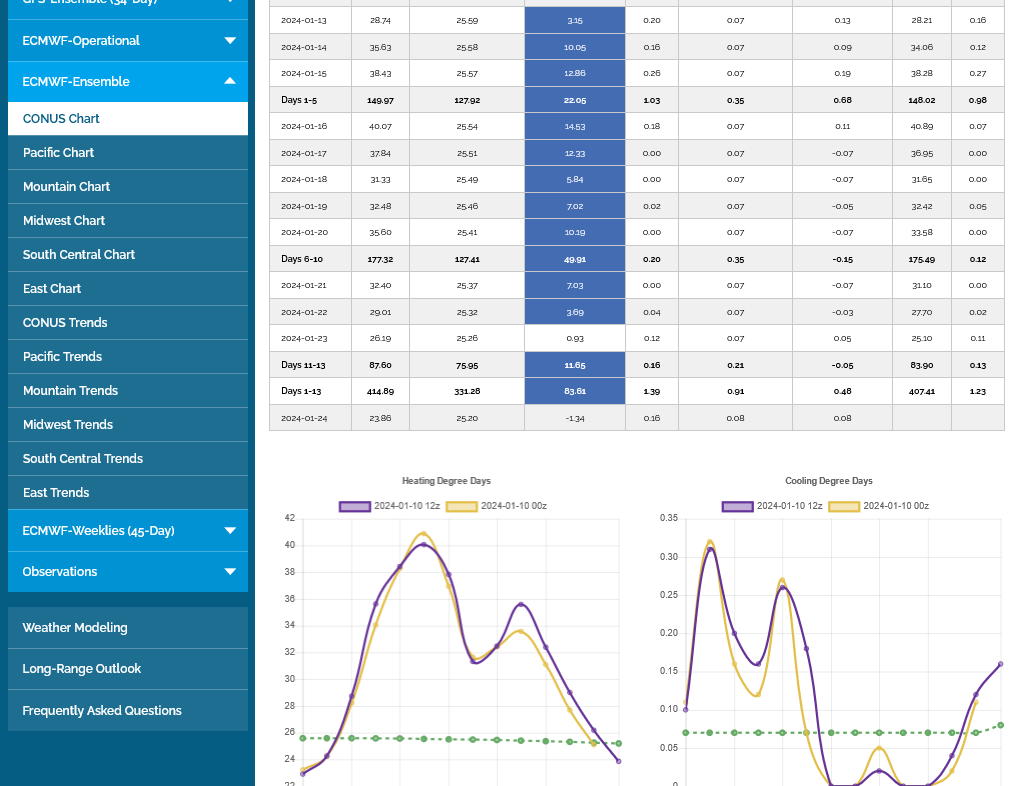
+++++++++++++++++++++++++++++++++++
January 11, 2024
Natural gas futures slipped below the $3/MMBtu mark early Thursday as a mid-January full of arctic chills for the Lower 48 appeared likely to give way to a warm-up later this month.
+++++++++++++++++++++++++++++
metmike: The pattern changing to milder in week 2 CAN CHANGE BACK TO COLDER. In fact, there are signs of that which means that we could get enough support for the price to hold at the least.
That's what makes weather forecasting so challenging and fun and applying it to trading even more challenging and profitable/fun(when you get it right). .
Dangerous and costly when you're wrong because you have 20+ times more leverage with your money than with trading/investing in stocks.
![]()
https://ir.eia.gov/ngs/ngs.html
for week ending January 5, 2024 | Released: January 11, 2024 at 10:30 a.m. | Next Release: January 18, 2024
| Working gas in underground storage, Lower 48 states Summary text CSV JSN | |||||||||||||||||||||||||
|---|---|---|---|---|---|---|---|---|---|---|---|---|---|---|---|---|---|---|---|---|---|---|---|---|---|
| Historical Comparisons | |||||||||||||||||||||||||
| Stocks billion cubic feet (Bcf) | Year ago (01/05/23) | 5-year average (2019-23) | |||||||||||||||||||||||
| Region | 01/05/24 | 12/29/23 | net change | implied flow | Bcf | % change | Bcf | % change | |||||||||||||||||
| East | 757 | 799 | -42 | -42 | 699 | 8.3 | 715 | 5.9 | |||||||||||||||||
| Midwest | 924 | 968 | -44 | -44 | 825 | 12.0 | 842 | 9.7 | |||||||||||||||||
| Mountain | 220 | 228 | -8 | -8 | 154 | 42.9 | 161 | 36.6 | |||||||||||||||||
| Pacific | 275 | 280 | -5 | -5 | 161 | 70.8 | 219 | 25.6 | |||||||||||||||||
| South Central | 1,160 | 1,201 | -41 | -41 | 1,063 | 9.1 | 1,053 | 10.2 | |||||||||||||||||
| Salt | 332 | 344 | -12 | -12 | 291 | 14.1 | 316 | 5.1 | |||||||||||||||||
| Nonsalt | 828 | 857 | -29 | -29 | 772 | 7.3 | 737 | 12.3 | |||||||||||||||||
| Total | 3,336 | 3,476 | -140 | -140 | 2,900 | 15.0 | 2,988 | 11.6 | |||||||||||||||||
Totals may not equal sum of components because of independent rounding. | |||||||||||||||||||||||||
Working gas in storage was 3,336 Bcf as of Friday, January 5, 2024, according to EIA estimates. This represents a net decrease of 140 Bcf from the previous week. Stocks were 436 Bcf higher than last year at this time and 348 Bcf above the five-year average of 2,988 Bcf. At 3,336 Bcf, total working gas is above the five-year historical range.
For information on sampling error in this report, see Estimated Measures of Sampling Variability table below.
Note: The shaded area indicates the range between the historical minimum and maximum values for the weekly series from 2019 through 2023. The dashed vertical lines indicate current and year-ago weekly periods.
++++++++++++++++++++++
metmike: The market has been pretty strong since the release. ALSO, as noted earlier this morning, the milder PATTERN in week 2 is trying to morph into a colder PATTERN at the very end of the period........this is supportive.
The U.S. Energy Information Administration (EIA) on Thursday printed a withdrawal of 140 Bcf natural gas from storage for the week ended Jan 5. The result exceeded most expectations and the five-year average decrease of 89 Bcf. Prior to the report, draw estimates submitted to Reuters averaged 119 Bcf. NGI modeled a pull of 121…
++++++++++++++++
This was a bullish surprise. It was from weather that ALREADY happened and that would have limited bullish ammo, if not for the models late in week 2 to be POTENTIALLY reinstating a cold pattern.
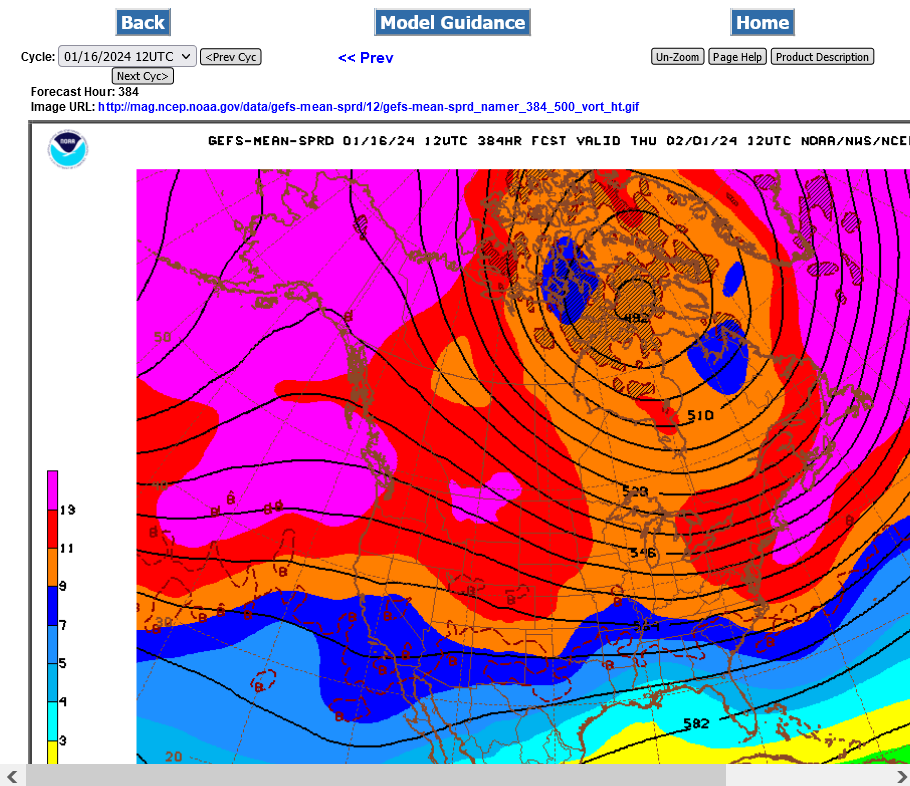
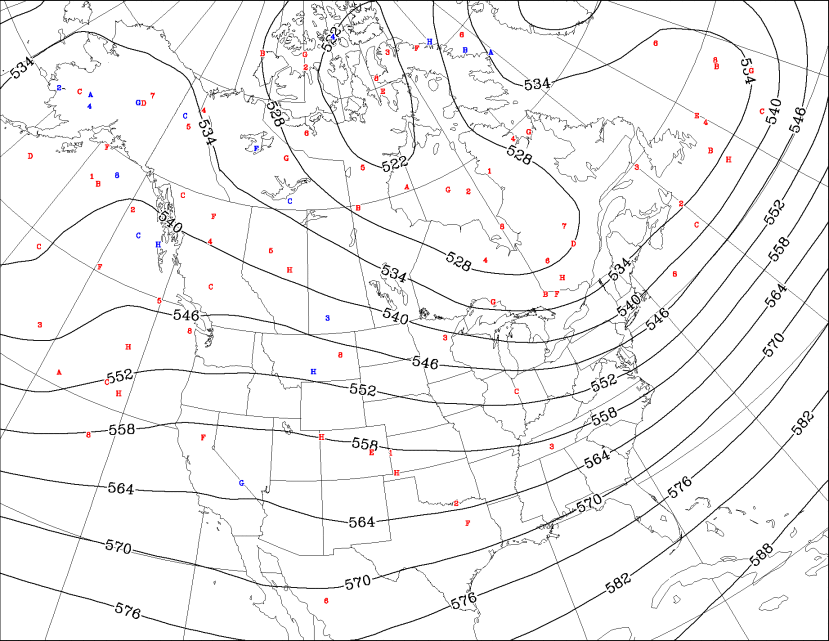
Note the just out 12z Canadian ensemble mean model solution(its been the coldest recently). There is CROSS POLAR flow, dumping frigid air from Siberia into Canada, with weather systems in the US tapping into that.
Late January is a long time from now and models will change between now and then.
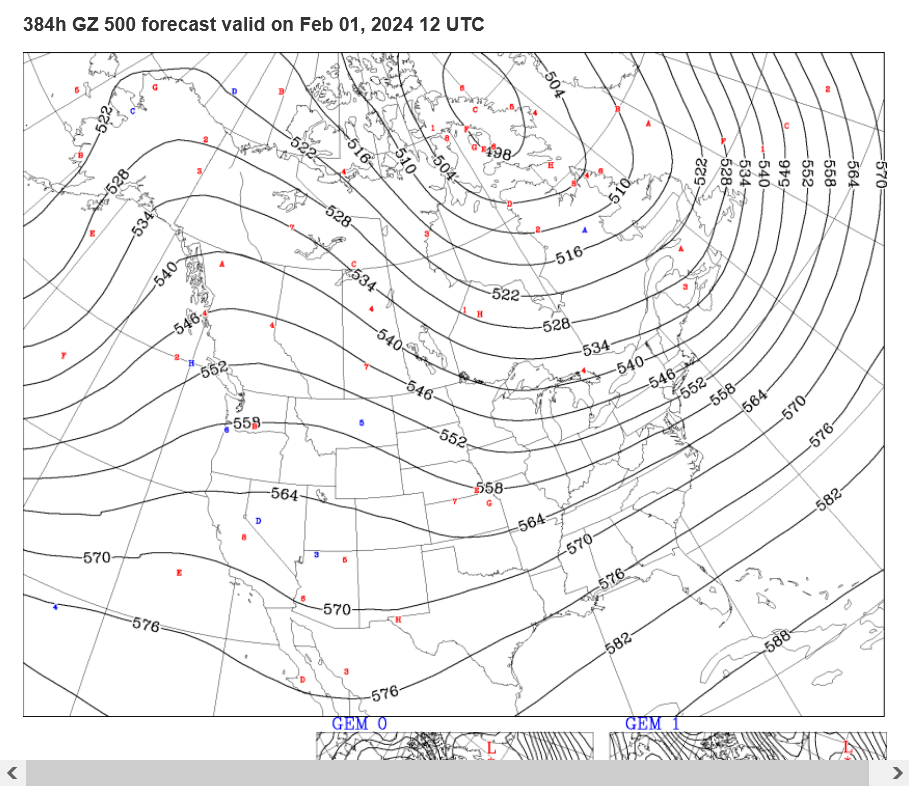
https://weather.gc.ca/ensemble/charts_e.html?Hour=384&Day=0&RunTime=12&Type=gz
384h GZ 500 forecast valid on Jan 27, 2024 12 UTC

384h sea level pressure forecast valid on Jan 27, 2024 12UTC

Re: Re: Re: Re: Re: Re: Re: Winter Storms week of 1-7-23
By tjc - Jan. 12, 2024, 1:59 p.m.
MetMike
You know me! Time to buy NG PUT!?
++++++++++++++
No response, so I bought Feb put. 208 pm cst
++++++++++++++
Re: Re: Re: Re: Re: Winter Storms week of 1-7-23
By metmike - Jan. 14, 2024, 6:14 p.m.
Great Call tjc! Glad you didn't wait to hear from me (-:
Huge moderation in week 2 with above average temperatures but threatening to turn very cold again in week 3. NG in storage is at a record level for mid January, which reduces the upside potential but I wouldn't want to be short if we turn VERY cold again in the high population centers of the Midwest/East/South.
Despite the $2,000/contract lower open, we're still within the trading range of Friday, although we spiked lower than that in the first couple of minutes.
Mike and Larry
Any chance Feb NG "falls" to match March? Not being greedy, just want your opinions!
It's all about weather tjc!
If the threat for major, widespread cold to return at the end of week 2 goes away, NG should collapse lower. The legit threat is there right now, which is holding back the collapse.
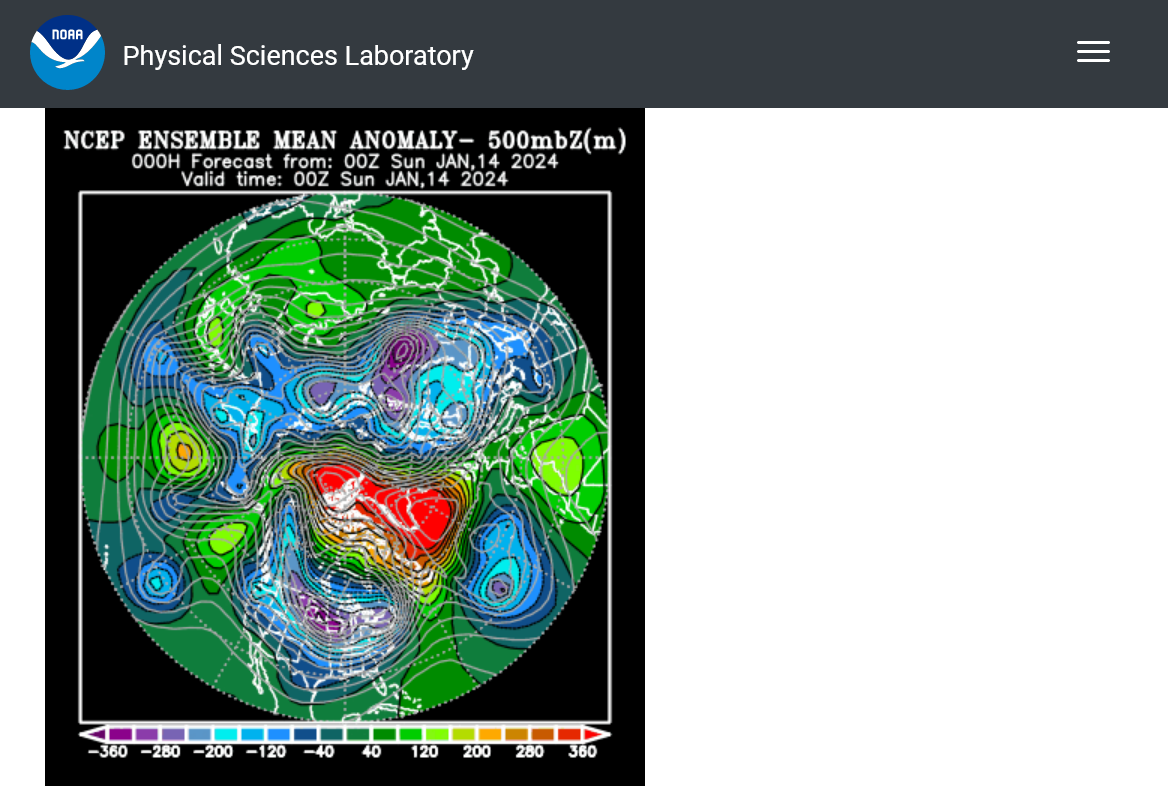
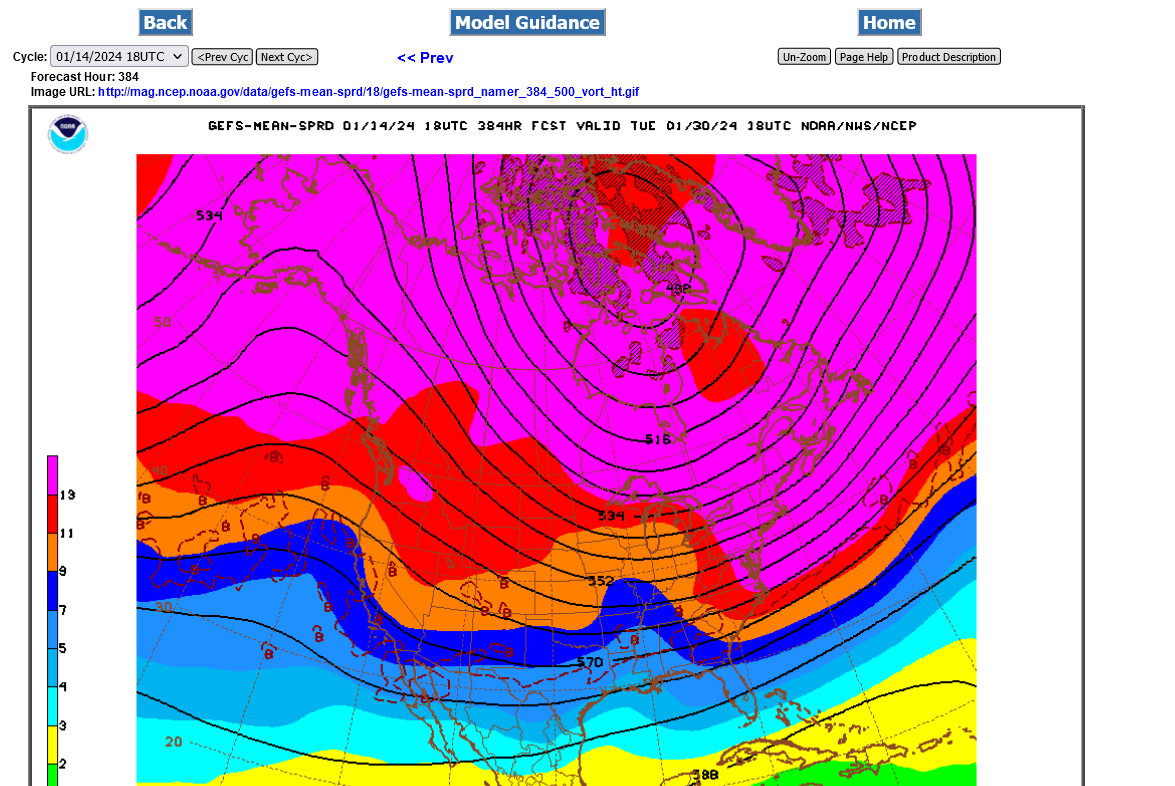
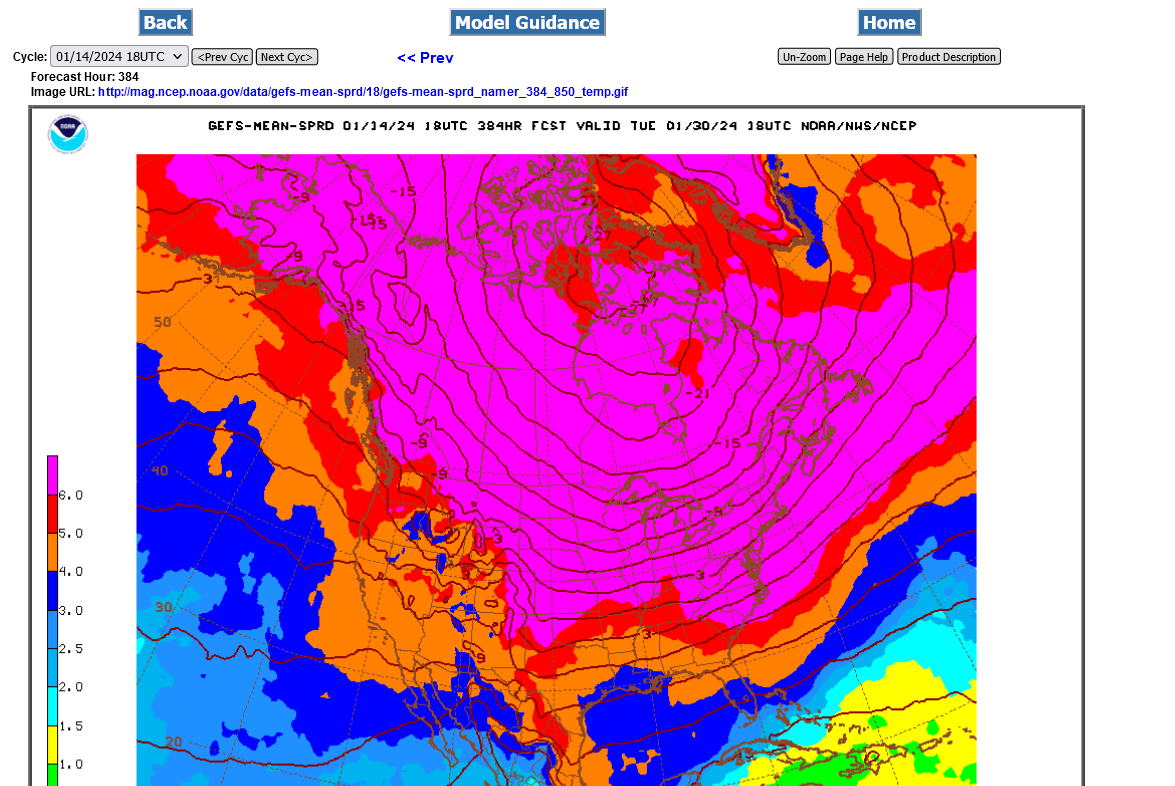
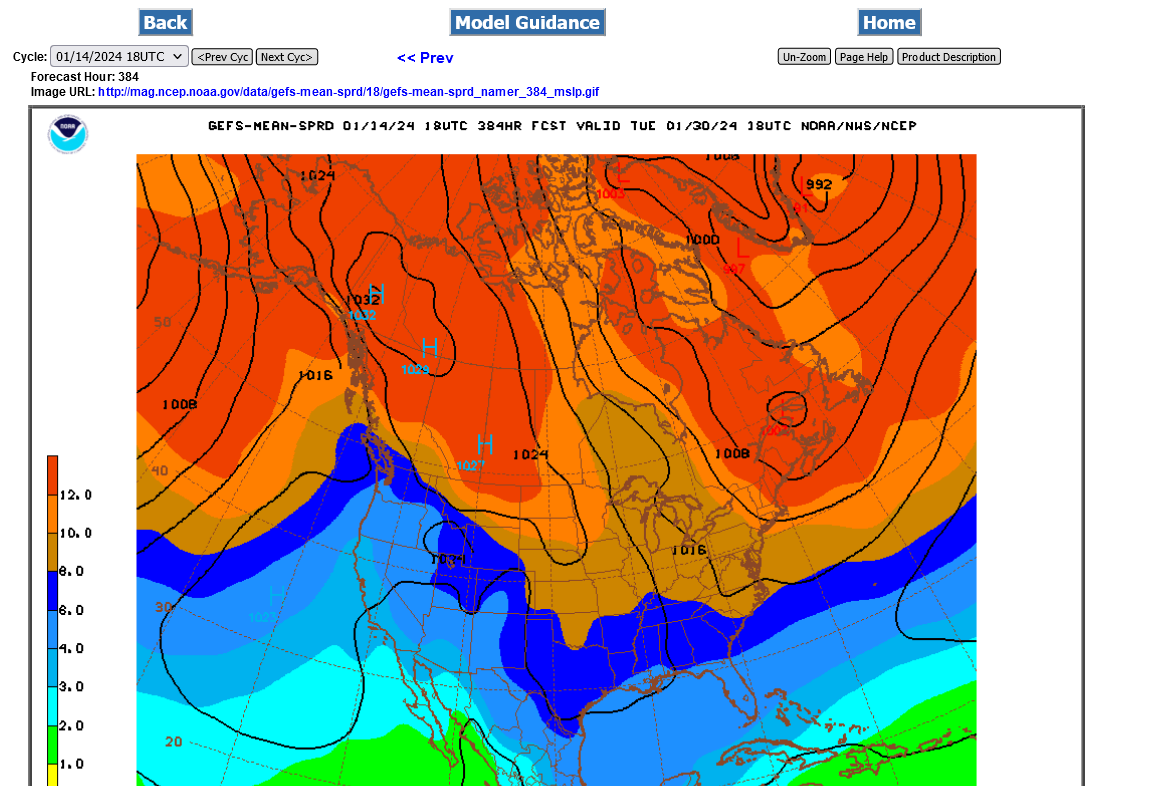
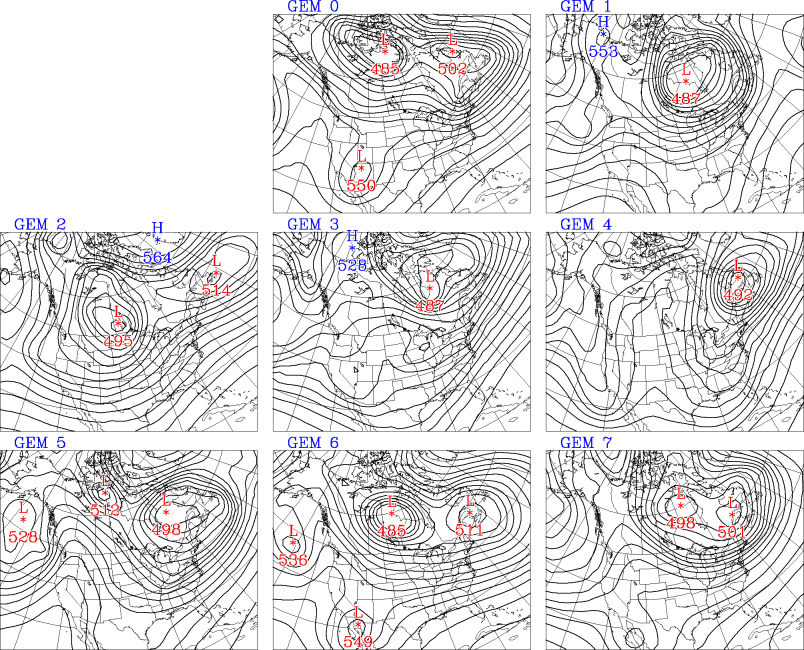
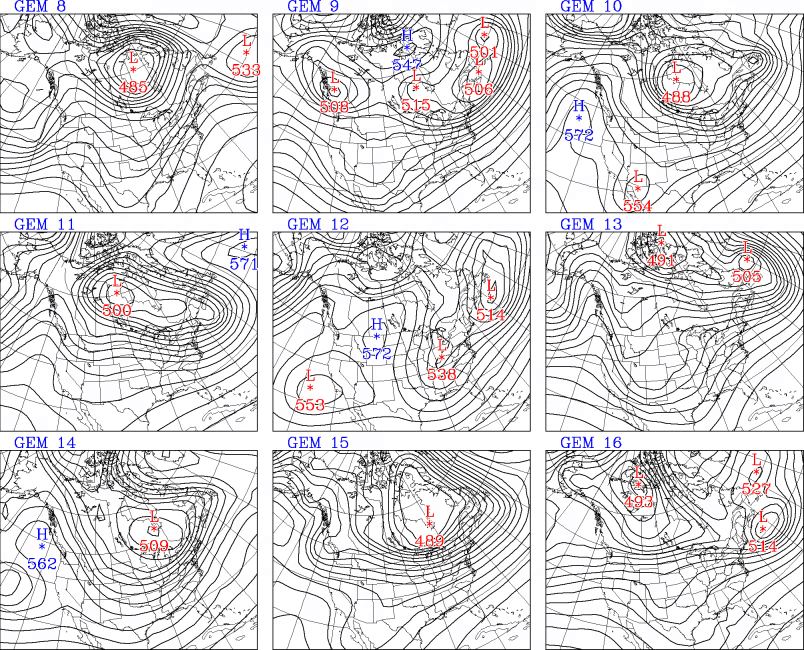
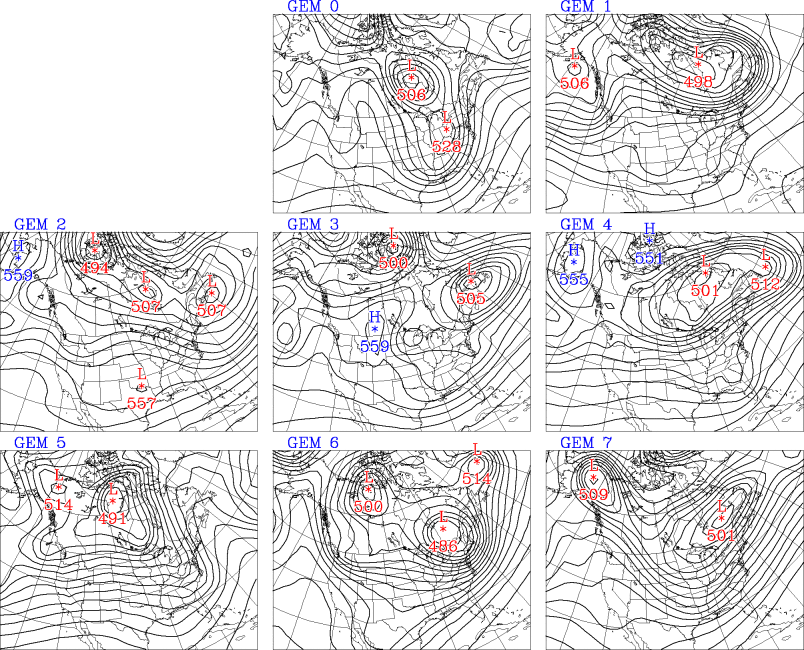
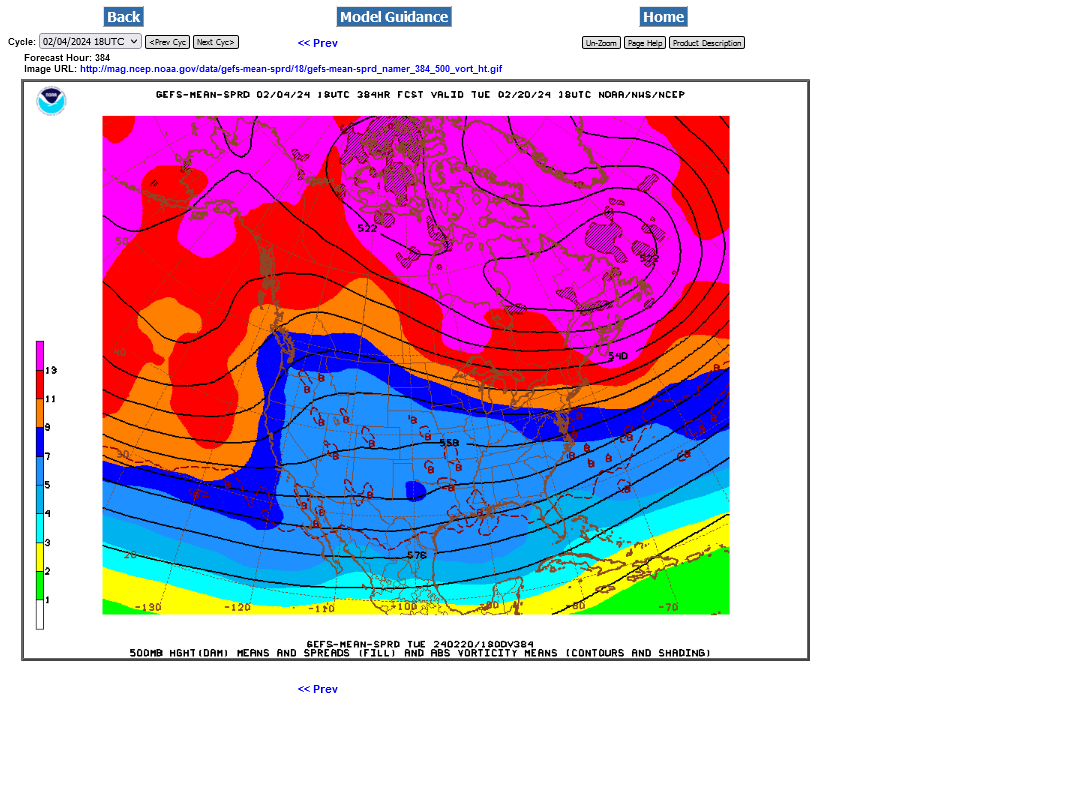
Last 18z GEFS maps 3, 4 ,5 below. NOT NEARLY AS COLD AS THIS because this is featuring the polar vortex on top of us!!!
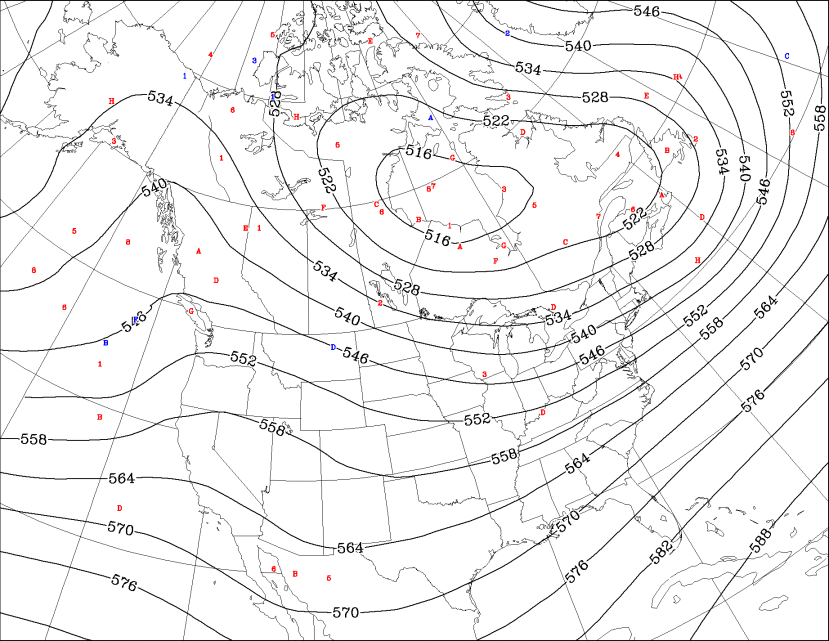
1. Current 500 mb-upper levels. That's the main piece of the Polar Vortex on top of us. That only happens every few years. Off the color chart extreme positive anomaly across C.Canada to Greenland. This is where the Polar Vortex is usually located.
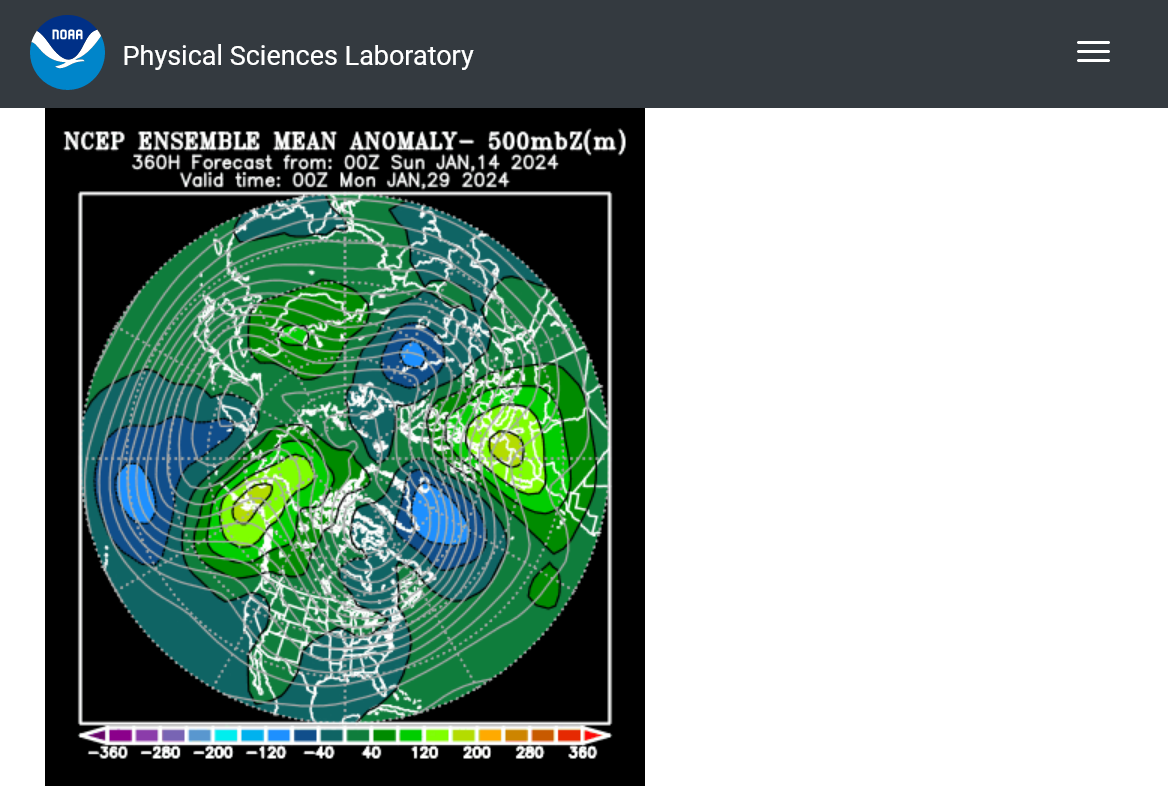
2. Same map in 2 weeks: 500 mb-upper levels- Strong positive anomaly in Alaska/NW Canada, extension to Siberia which is the potential high level feature to drive down cold.
3. 384 hours- 500 mb/upper levels-cross polar flow, flooding Canada with frigid air from Siberia
4. 850 mb lower levels COLD being dumped south from Canada
5. Surface pattern-that's another (weaker) Arctic high in W.Canada dropping down.
We're actually having a stronger SSW this time than the one earlier in the month that caused this cold.
Winds are actually dropping to ZERO this time!
That jacks up the potential for extreme cold in February. The Arctic will not have time to build up the cold that we had plummeting down this time, so its unlikely to be this cold again for the rest of the season......even with the same pattern, should it manage to get as extreme which is extraordinarily unlikely in itself.
https://www.marketforum.com/forum/topic/101402/#101728
Before then, a massive warm up the last 10 days of January.
The overnight 0z European model lost 8 HDDs(bearish) on its last run, mainly from the milder week 2 part of the forecast.
We are also seeing near average days on the back end, replacing frigid days on the front end.
It's the purple line below/left. Brown was the previous 12z run. You can see the green dashed average has started to fall(less HDDs from temps just starting to warm up from the coldest time of year, seasonally from this point on)
Huge warm up coming in week 2! This will be followed by a resumption of colder temps but very unlikely to be anything like what we're experiencing right now.
These are the 7 day temps for the EIA storage updated, released at 9:30 am on Thursdays.
This bitter cold was just beginning to plunge south out of Canada with the early period, especially in the Northeast quadrant causing the average to be milder than what was hitting late in the period.
https://www.cpc.ncep.noaa.gov/products/tanal/temp_analyses.php
This was the last report:
https://www.marketforum.com/forum/topic/101635/#101687
This extreme cold will result in the reports on 1-25 and 2-1 having MASSIVE drawdowns, probably well over 200 Bcf but all that will do is bring the amount in storage to back inside the very top of the 5 year average and show up as a 2 week small, downward blip on the longer range graph of storage.......unless it turns cold and stays cold for February which then could further erode the huge surplus but the natural gas market has plenty of gas to make it thru the Winter. A very cold Feb could get us down to just under the 5 year average. A cold March too could get us well under that BUT NOT close to the 5 year lows unless we have sustained cold for most of Feb AND March.
+++++++++++++
This was the temp anomaly from Sunday. Keep in mind that the extreme cold had not hit the high population density (and heating demand base) East Coast/ Northeast yet.
The Southwest is about the only place missing out on the Siberian blast.
The just out 12z GEFS still likes the idea of strong cross polar flow dumping frigid air into Canada which will be plunging into the Northern/Eastern US in early Feb.
However, the just out 12z Canadian model, that has been one of the coldest, dropping another polar vortex into Central/Eastern Canada with an extension into the US at the end of the period.........HAS WARMED UP.
It's looking much more zonal(west to east) vs meridional(north to south) with the flow and much milder than runs earlier this week.
This is how it looked just 2 days ago. Note the tight gradient flow from across the Arctic from Siberia with strong north to south winds flushing thru Canada.
The map above from the last run, deflects the majority of that with milder Pacific flow pushing in strongly.
Well, learned another valuable trading 'lesson' over this MLK weekend.
That is, NG options have NO liquidity!! Did not get a bid/ask on my front month option all day Monday (even though futures traded). First real bid/asks came around 8am cst. Since then, liquidity is fine.
Once 'opened', I was out at nearly a double, 12 cent profit.
Since exiting, the front Feb month HAS made new lows, but not the March.
Sooo, buy March, sell Feb??
Thanks, tjc!
I never trade options but know exactly what you mean about liquidity over the holidays when the big traders are not trading options.
Sometimes (not this one) even the futures have extremely low volume over some holidays.
We are really crashing lower now. This last 12z European model came out another -3 HDDs, all from the end of the 2 week forecast.
++++++++++++
Congrats again on a great call on Friday and profit!!
I've been tied up with chess stuff the last month and not traded but I would have definitely missed the optimal time to sell (which is when you did), being overly concerned about the cold returning in February when the warm up coming next week is what really matters.
We're down $4,500/contract from the Friday close right now!!
Any thoughts on the spread---sell feb, buy march?
Selling ngg futures or the front month and buying ngh or the next deferred month is a bear spread that has a pretty good seasonal correlation during the back half of Winter when:
1. Amount in storage is robust
2. The weather is mild
3. There isn't an unusual underlying NEAR TERM bullish fundamental
A thought behind this is that end users are buying the back months for coverage/hedging needs later this year which supports them and NOT the front month(s) which were covered months ago, when end users dialed in an average Winter while buying/covering last Fall and storage is in great shape now and can take care of needs.
The main caveat would be another frigid outbreak or sustained cold that persists in the high population areas.
But Feb will be expiring in less than 2 weeks. If there's no cold in sight, it could spike lower, like I think you are hinting at.
REVERSAL on Wednesday
COLDER??
tjc,
The European model was actually another -4 HDDs MILDER. However:
We're having a pretty stout SSW event right now that gives a potential for more major cold as we end Jan and start Feb. This is something I've mentioned all week. The Canadian model has shifted milder since yesterday but the GEFS continues very bullish for cold.
Here's a comprehensive discussion about it:
https://www.marketforum.com/forum/topic/101402/#101775
Judging from the markets spike lower, this -154 Bcf drawdown must be bearish vs expectations.
Next weeks drawdown will be massive and the 1 after that close to it.......but the market dialed that into the price with the spike higher last week when we KNEW it was going to happen.
Like Joe K used to say, we call the markets FUTURES not PASTures.
We continue to have a record amount of NG in storage for this far into Winter(which just crossed the halfway point with regards to average daily HDDs). Note the blue line on the graph below is still ABOVE the previous range.
https://ir.eia.gov/ngs/ngs.html
![]()
for week ending January 12, 2024 | Released: January 18, 2024 at 10:30 a.m. | Next Release: January 25, 2024
| Working gas in underground storage, Lower 48 states Summary text CSV JSN | |||||||||||||||||||||||||
|---|---|---|---|---|---|---|---|---|---|---|---|---|---|---|---|---|---|---|---|---|---|---|---|---|---|
| Historical Comparisons | |||||||||||||||||||||||||
| Stocks billion cubic feet (Bcf) | Year ago (01/12/23) | 5-year average (2019-23) | |||||||||||||||||||||||
| Region | 01/12/24 | 01/05/24 | net change | implied flow | Bcf | % change | Bcf | % change | |||||||||||||||||
| East | 715 | 757 | -42 | -42 | 667 | 7.2 | 675 | 5.9 | |||||||||||||||||
| Midwest | 873 | 924 | -51 | -51 | 790 | 10.5 | 798 | 9.4 | |||||||||||||||||
| Mountain | 208 | 220 | -12 | -12 | 148 | 40.5 | 153 | 35.9 | |||||||||||||||||
| Pacific | 257 | 275 | -18 | -18 | 157 | 63.7 | 212 | 21.2 | |||||||||||||||||
| South Central | 1,128 | 1,160 | -32 | -32 | 1,069 | 5.5 | 1,024 | 10.2 | |||||||||||||||||
| Salt | 332 | 332 | 0 | 0 | 305 | 8.9 | 311 | 6.8 | |||||||||||||||||
| Nonsalt | 796 | 828 | -32 | -32 | 763 | 4.3 | 713 | 11.6 | |||||||||||||||||
| Total | 3,182 | 3,336 | -154 | -154 | 2,832 | 12.4 | 2,862 | 11.2 | |||||||||||||||||
Totals may not equal sum of components because of independent rounding. | |||||||||||||||||||||||||
Working gas in storage was 3,182 Bcf as of Friday, January 12, 2024, according to EIA estimates. This represents a net decrease of 154 Bcf from the previous week. Stocks were 350 Bcf higher than last year at this time and 320 Bcf above the five-year average of 2,862 Bcf. At 3,182 Bcf, total working gas is above the five-year historical range.
For information on sampling error in this report, see Estimated Measures of Sampling Variability table below.
The threat for a return of very cold weather late in week 2 went away on all the models overnight.
The Canadian model had been showing this for a couple of days and appears to be the first to recognize that mild Pacific flow will deflect the northern stream and keep most to all of the frigid weather in Canada.
++++++++++++++
Next week could potentially start with a GAP LOWER if the weather doesn't shift colder over the weekend.
how is it looking mike
Hi cc,
No sign of major cold the next 2+ weeks.
I would think a gap lower on the open. The next 2 EIA reports will feature some of the biggest drawdowns ever but the market dialed that into the price earlier this month, when it showed up on forecast models.
It collapsed last week, dialing in this new much milder weather pattern.
How much lower can we go?
After dropping from 3.8 in November to 2.2 in December -16,000/contract from extremely mild weather, we soared from 2.2 to almost 3.4 in short order ahead of this cold +12,000/contract.
In just a week we gave up most of those gains, dropping to 2.5 or a change of almost -9,000/contract from almost 3.4.
I would think that 2.2 is an easy target, the December lows.
2 weeks of really extreme cold is not going to be enough to erode enough supply to change the end of Winter storage enough to reverse the trend.
The Winter season lows typically Occur from mid Feb to the end of March but in an extremely bearish year like 2023, the lows didnt happen until the start of April.
bullish fundamentals cause the lows to happen earlier but the weather matters too.
bearish fundamentals like last year push the lows to later.
Extreme cold in Feb/March will put the lows in earlier. Warmth will do it later.
We got the expected,pretty big gap lower on the open!
Down around 1,400/contract From the close on Friday.
Filli g the gap would suggest a selling exhaustion formation…gap and crap with very low predictability because it’s not at the end of a long lived move like the one that happened in December..
its very doubtful that we fill the gap with this mild weather forecast so it’s a DOWNSIDE BREAKAWAY gap until filled.
A powerful technical signature in this set up.
Down 2,000/contract now.
That 2.2 mentioned earlier as an easy target could come pretty fast at this rate.
Added: However, we've already shed the value of the ENTIRE rally from the extreme cold in just over a week.
NG, as usual is probably OVER reacting.........too far too fast based on the fundamentals.
We went down too far in Nov/Dec, up too far with the cold spike and down way too fast/far with this collapse.
At the current (past week) rate of descent, the price will be near 0 in early February!
++++++++++
We got some buying traction overnight/this morning after the gap lower and continued follow thru last evening.
We ran out of aggressive sellers that were piling on since the pattern change showed up a week ago. We can definitely assume that the market knows about and has fully dialed in the milder weather coming up.
New items, including changes to weather outlooks will play a big role moving forward.
The 2.2 area is still a potential target on the downside and also serves as a major low from extremely mild temps that could serve as rock solid support.
Last evenings low, just above 2.3 will also serve as solid short term support.
We are threatening to have a gap and crap reversal up, if the gap lower from last night is filled today, as mentioned yesterday after the open.
In this particular spot with extremely volatile trading, I wouldn't give it a tremendous amount of weight. There could be sellers waiting on any rallies in this environment if the weather forecast remains mild.
In the absence of massive weather pattern changes like we've had over the last month, which makes predicting ng prices a skillful venture, I won't pretend to know where natural gas is going right now.
There's also the fact that we have 2, extremely bullish EIA numbers on the way, the next 2 Thursdays, especially this week. Even though the market knows this, new sellers may wait until we get those numbers/report out of the way.
We made a run at trying to fill the gap lower that failed miserably as the market uncovered abundant, fresh selling at those levels BELOW the top of the gap(below Friday's close).
This has pressed us back down close to the open last night, down $1,000+/contract.
A mild temperature outlook stretching into early February continued to put pressure on natural gas futures in early trading Tuesday. The February Nymex contract was down 6.5 cents to $2.354/MMBtu at around 8:45 a.m. ET. March was off 2.5 cents to $2.100. Updated forecast maps from Maxar’s Weather Desk Tuesday continued to show predominantly warmer-than-normal…
+++++++++++++++++++++
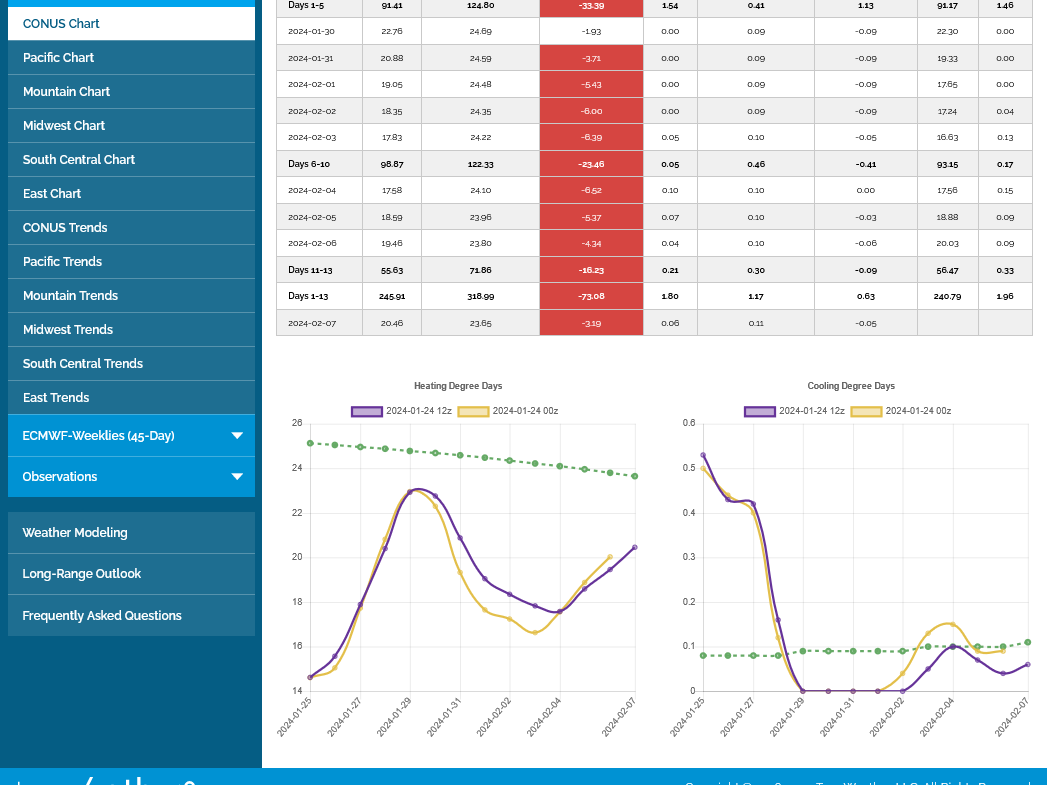
The last 0z European model lost another -4HDDs overnight. Its the purple line on the left. The tan line was the previous 12z run from 12 hours earlier. The green line is the slowly declining average HDDs. We're just past the halfway point for Winter! Note how far below the green average HDDs will be the next 2 weeks. Extremely bearish but the market has been chewing on this for over a week now and most of its dialed into the current price. A continuation of this pattern BEYOND the high confidence period, 2 weeks can add some NEW bearish ammo. ......or it can turn the weather more bullish!
Comprehensive weather: https://www.marketforum.com/forum/topic/83844/
Sucks to look back sometimes.
310 put----woulda, coulda, shoulda held the put. 70 instead of 27!! Was NOT a looser, but sure could have been $4000 more!
Yes, I was thinking the same thing last week tjc.
I know the feeling extremely well and its much tougher to pick the exit price than the entry price and in recent years, I've had trouble with both, mainly with pulling the trigger on entries, which means no trade at all to exit.
Clearly, you've acquired some great skill at picking bottoms and tops. That's your bread and butter. That's my favorite trade too. Note my bean post last Friday.
https://www.marketforum.com/forum/topic/101013/#101806
So there are all sorts of ways for a trader to profit and the biggest profits often happen really fast when a market reverses from a high or low......but that can also be a time of high risk and volatility. You minimized the risk by buying puts, instead of futures.
You may have spent some time over a weekend being nervous and then MLK day realizing there was no volume in the options on holidays, making you even more nervous. Then, the market finally responded on Tuesday and after days of being concerned, it was just too tempting to cash in your reward for picking the top and eliminate the stress for the rest of the week.
BUT THEN, the worst part. Every day the market crashed lower, you calculated how much you WOULD HAVE been up and wished hard for the market to go back up so that you didn't have to keep torturing yourself by calculating what could have, what should have been a massive profit.
I do that, not only on every exited trade but on every trade I didn't take......including short natural gas this time. While you were kicking yourself for not staying in.........which is much worse because you took the initiative to be short and actually had the position............I was kicking myself every day for not being short even 1 hour of 1 day and making 0.
At least you made money and there will be 1,000 other trades.
Thats not to say that early exits are always bad. When they preserve capital, after recognizing a bad trade or with a well placed stop that prevents an even bigger, unlimited costly loss........it's a good early exit.
I'm glad that you made this comment today, tjc. I think that every active speculator/trader that uses short term positions goes thru this. I congratulate and thank you very much for honestly and generously sharing your authentic trades here too! Conversations with you are especially enjoyable.
The best part of all, tjc is that you've acquired a skill for identifying entry points for overdone markets, especially at tops and bottoms that is based on finely tuned observations and experience that nobody can take away from you.
I imagine that you will be able to continue to exploit that skill(which very few people have) for years to come in the same markets you've been trading for a very long time.
This last European model added a whopping +9 HDDs! The market had already come off its 8am-ish lows, around $1,500/contract lower than this but this colder solution helped to double the recovery amount in less than 2 hours.
The Canadian model that comes out 2 hours earlier really showed much more cold entering from Canada. There are also some subtle changes that suggest the potential for high latitude blocking and positive anomalies evolving and forming a couplet with a negative anomaly at mid latitudes, especially in the Southern US(where a lot of people live). This would favor colder air moving into some places of the US.
We're back up, approaching yesterdays highs and within striking distance of filling the gap lower on Sunday Night. We need another +$300 or so.
MetMike
Thank you for kind words.
The upsetting thing is the magnitude of the failure to let it ride! YOU 100% detailed the anxiousness contributing to the COVER--no, none, notta Bid Ask for 3 days!
I am very concerned about being long the energy market in 2024. PRODUCTION will out pace consumption. Only isolated instances of say Middle East issues will provide upward movement.
LOOK for long cotton as a longer term trade.
Yes, the magnitude was enormous. I know it well.
On the liquid energies, the tensions in the Middle East make them unusually risky. The likelihood of a Trump presidency is also a factor about which, I have no idea how much impact of the market dials in the "drill baby, drill" mentality.
The storage surplus in NG is a record right now and will still be robust after the next 2 weeks of massive draw downs.
Extremely interesting technical place for NG at the moment. The evening open actually left a tiny gap above the highs from Mon/Tue. If we have follow thru, it would leave behind a 2 day island, gap reversal pattern.
I would not put a great amount of stock in this at the moment, as mentioned Sunday because its not at the end of a long move, however, maybe the extreme over reaction (market dropped an incredible $12,000/contract in just over a week) made up for the lack of time that it took for the move to play out.
Island Reversal – Reversal Candlestick Pattern
https://www.tradingsim.com/blog/island-reversal
We haven't even filled Sunday Night's gap yet, the top of that, I think is 2.518, so until that happens, this is still a downside break away gap, with a potential, 2 day island reversal now also at play.
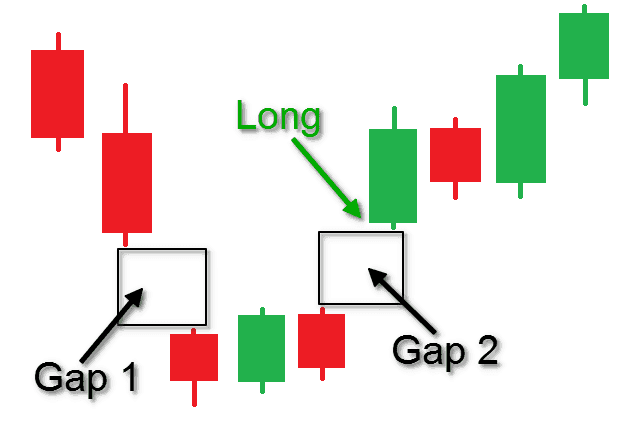
Gap 1 above was the fairly sizable Sunday Night, downside break away gap.
Gap 2 was 30 minutes ago on the open, very tiny.
Only if the upcoming models turn much colder do I think this has legs. We have a monstrous draw down coming up on Thursday which could keep the bears on the sidelines.
Should we get above, 2.518 it will also mark a gap and crap selling exhaustion pattern where extreme, aggressive and panic type selling caused a big gap lower...........get me out at the market/any price mentality.......that dried up after the panic ended and the market ran out of new selling/sellers and had to seek higher prices to uncover willing sellers.
Now, the question is whether we have tons of orders waiting to sell between here and the low range from last weeks trading. Last weeks lows/broken support can serve as resistance on the way back up.....which is where we are now.
The tiny, 4 tick gap higher for this session, that started at 5pm Central has held. The gap is between the Tue high of 2.492(at the close) and the Wed low of 2.496(at the open).
A couple of hours ago, we went down to test that at 2.498 and it looked like it would be filled.........but instead it held with solid buying interest at that level.
So its a significant technical event and strong daily support level. The island gap and the exhaustion gap(gap and crap) formation are now the valid technical indicators, replacing the downside break away gap interpretation from Sun/Mon/Tue.
We should keep in mind that technical indicators and can change quickly in volatile markets. They are anything but perfect at predicting the future and only map out the market mentality at the points in time when they occurred.
Buyers and sellers are driven by a host of factors and they don't all just look at a technical chart to tell them what to do, which is what pure technical traders try to do when reading a chart and using it to trade.
Some people like to claim that the technicals tell us the weather but I claim its the other way around most of the time.
Technicals are usually responding to the change in the weather from traders that are "in the know" about the weather first, while traders using old weather get left in the dust.
A combination of technical momentum and colder adjustments to a still-mild weather outlook helped natural gas futures recover in early trading Wednesday, building on a strong finish to the previous session. The February Nymex contract was up 7.4 cents to $2.524/MMBtu at around 8:30 a.m. ET. March was up 4.6 cents to $2.213. The front…
++++++++++++++
The graph below/left are the HDDs for the last 4 runs of the GEFS model. Purple is the last one. We can see the INCREASE in the HDDs compared to previous runs but the mild overall pattern is causing ALL the lines to be well below the average green line. So the +8 HDDs on the last run is still in a bearish weather pattern but FOR NOW, just LESS bearish than before.
LESS Bearish = BULLISH for a very short trader.
LESS Bearish might still be BEARISH for a position/longer term trader, depending on whether the changes are perturbations in the still intact bearish trend or whether they are foreboding A CHANGE IN THE LONGER TERM TREND to being BULLISH.
The slowly falling, dashed green line shows that we've passed the mid-point of Winter(when HDDs peak).
The lines below need to stay AT OR ABOVE the green line to be considered BULLISH.
I've been tracking just the Feb NG(NGG) but just noticed what's going on in the March NG(NGH).
March already has 3 times the volume as Feb, 98,000 vs 34,000 just before 11 am Central. This disparity will grow fast as we approach expiration of the NGG next week.
March is only +$700 vs Feb at +$1,700.
Not unusual for the front month to have much stronger price changes than back months(when it was going down last week, Feb dropped the most).
So on the way up, a bull spread (long Feb/short March) would make money.
Last week, I mentioned a seasonal for the bear spread to work well here. This is true on days or moves that DO NOT feature big price increases. In those situations, the BULL spread is profitable.
I have never traded spreads, though being very familiar with them in a comprehensive way. I don't ever use options either because you pay out the whazoo to lessen risk that options SELLERS charge you for. They work well for guys like tjc and sometimes farmers that are trying to lessen the risk of production.
Natural gas futures rose for a second day Wednesday, supported by still-mild weather forecasts shedding some of their spring-like warmth and a burst of technical momentum across the forward curve. At A Glance: Plus-300 Bcf storage draw expected Forecast remains warmest in 45 years Production rises to 103 Bcf/d Building on a 3.1-cent gain Tuesday,…
+++++++++++
The updated late morning, 12z GEFS, (model shown previously) was -5 HDDS compared to its previous run, which caused a drop in price........then the 12z European model came out +5 HDDS vs its previous run(shown below) and NG raced to new highs. Tomorrows massive EIA number could cause a wild price spike, following the release at 9:30am.
As expected, the EIA number was MASSIVE and because it was expected, we say buy the rumor, sell the fact price action. LOWER prices AFTER the release because it was based on weather that the market knew was coming 3 weeks ago and traded back then by spiking up the price to dial in that information when it was BRAND NEW. Everybody knew this was coming. Expectations of this coming this week, probably prevented follow thru additional selling earlier in the week after the gap lower.
Also, with this monster draw down, we are at the very top of the 5 year average. Next weeks huge number will get us deeper into the top. Then mild weather in early Feb. will cause the bearish disparity to grow again.......which was dialed in LAST WEEK with the incredible spike down(long before the actual weather happens).
We are also getting to the time of year when the weather is having less and less power to impact prices, especially with such robust storage levels.
![]()
for week ending January 19, 2024 | Released: January 25, 2024 at 10:30 a.m. | Next Release: February 1, 2024
| Working gas in underground storage, Lower 48 states Summary text CSV JSN | |||||||||||||||||||||||||
|---|---|---|---|---|---|---|---|---|---|---|---|---|---|---|---|---|---|---|---|---|---|---|---|---|---|
| Historical Comparisons | |||||||||||||||||||||||||
| Stocks billion cubic feet (Bcf) | Year ago (01/19/23) | 5-year average (2019-23) | |||||||||||||||||||||||
| Region | 01/19/24 | 01/12/24 | net change | implied flow | Bcf | % change | Bcf | % change | |||||||||||||||||
| East | 657 | 715 | -58 | -58 | 628 | 4.6 | 630 | 4.3 | |||||||||||||||||
| Midwest | 788 | 873 | -85 | -85 | 758 | 4.0 | 749 | 5.2 | |||||||||||||||||
| Mountain | 194 | 208 | -14 | -14 | 141 | 37.6 | 146 | 32.9 | |||||||||||||||||
| Pacific | 228 | 257 | -29 | -29 | 151 | 51.0 | 206 | 10.7 | |||||||||||||||||
| South Central | 990 | 1,128 | -138 | -138 | 1,067 | -7.2 | 984 | 0.6 | |||||||||||||||||
| Salt | 269 | 332 | -63 | -63 | 310 | -13.2 | 300 | -10.3 | |||||||||||||||||
| Nonsalt | 721 | 796 | -75 | -75 | 758 | -4.9 | 684 | 5.4 | |||||||||||||||||
| Total | 2,856 | 3,182 | -326 | -326 | 2,746 | 4.0 | 2,714 | 5.2 | |||||||||||||||||
Totals may not equal sum of components because of independent rounding. | |||||||||||||||||||||||||
Working gas in storage was 2,856 Bcf as of Friday, January 19, 2024, according to EIA estimates. This represents a net decrease of 326 Bcf from the previous week. Stocks were 110 Bcf higher than last year at this time and 142 Bcf above the five-year average of 2,714 Bcf. At 2,856 Bcf, total working gas is within the five-year historical range.
For information on sampling error in this report, see Estimated Measures of Sampling Variability table below.
Note: The shaded area indicates the range between the historical minimum and maximum values for the weekly series from 2019 through 2023. The dashed vertical lines indicate current and year-ago weekly periods.
+++++++++++++++++++++++
Story of the day
The U.S. Energy Information Administration (EIA) on Thursday reported a natural gas withdrawal from storage of 326 Bcf for the week ended Jan. 19, the third highest on record, which landed near expectations and blew away the year-earlier decline. Ahead of the 10:30 a.m. ET government report, February Nymex futures were trading up 6.7 cents…
++++++++++++++++++++++++
Expiration volatility! In this case, maybe speculative shorts in the front month covering ahead of the February contract going off the board?
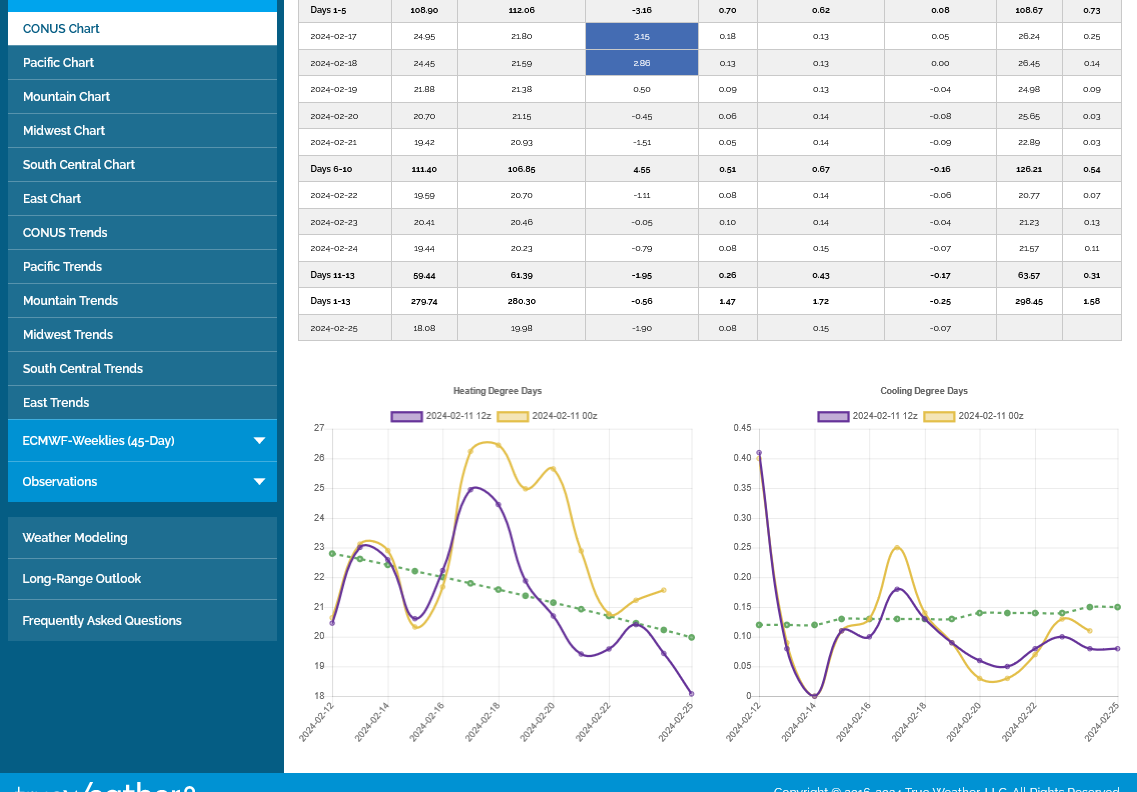
The last 12z European Ensemble model was a whopping +18 HDDs vs the previous 0z run. While this is just a run to run difference with the same pattern and same HDD shape(just shifted higher every day for the last 10 days) it's the biggest that I remember in just 1 run for this ENSEMBLE.(average of 50 individual solutions).
It's the purple line on the left. The previous run is also plotted in tan. The green line is the historical average for those dates which is slowly becoming milder since we're past the halfway point of meteorological Winter.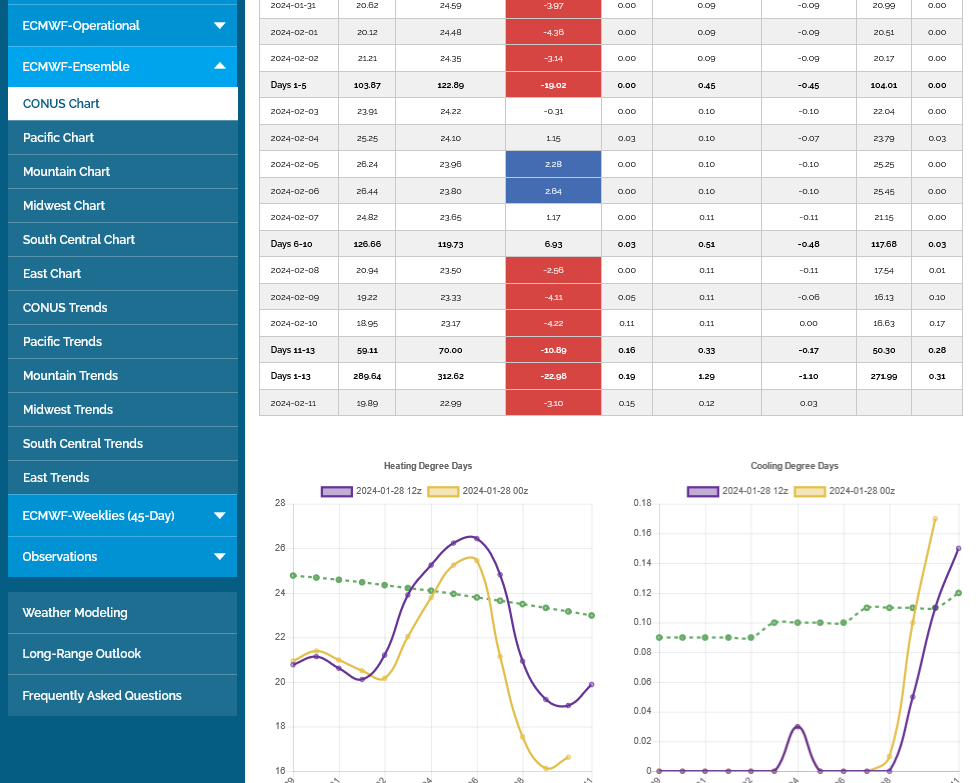
Thanks very much, Jean!!
+++++++++++
++++++++++++++++
Overnight, the 0z European ensemble(purple line of the left) changed by -22 HDDs vs the previous run which was a greater magnitude than the HUGE increase of the previous run and the biggest 1 run change for this product that I remember since following it!!!
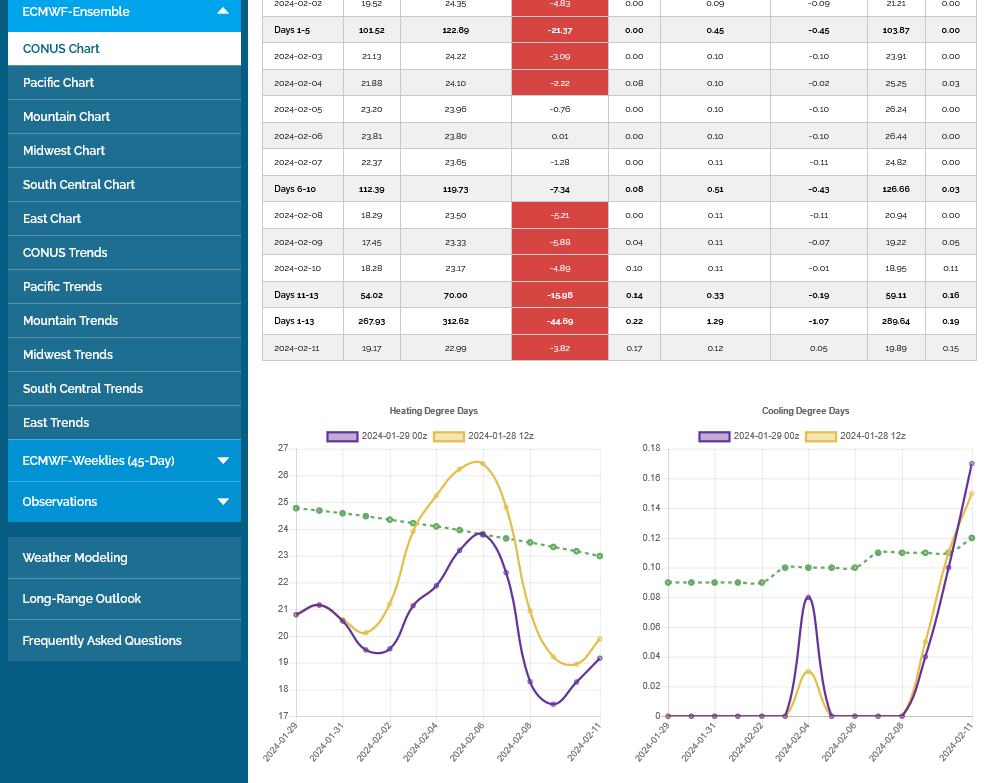
This last 12z European ensemble lost another -19 HDDs vs the previous 0z run that was -22 HDDs for a total of -41 HDDs in 24 hours.
This is MUCH, MUCH greater than anything that I can remember in 24 hours for any ensemble(average of 50 solutions). For an individual model solution, it happens. But NEVER with the average of all 50 solutions in a model.
The interesting thing is that the pattern looks to turn increasingly cold again at the end of 2 weeks(bullish).
NG is struggling to get much buying traction from models shifting to some major cold towards the end of week 2. If this were in the first half of the heating season or if NG in storage were not near record high amounts, I think this increasing cold would have more impact.
Historically, for fundamental reasons, large specs lose interest in buying major cold waves the rest of the heating season, when they can't erode enough storage anymore to impact the price dynamics like they can earlier in the season.......when you can use a bigger time multiplier.
NEW
![]()
Jan 31, 2024
+++++++++++++++++
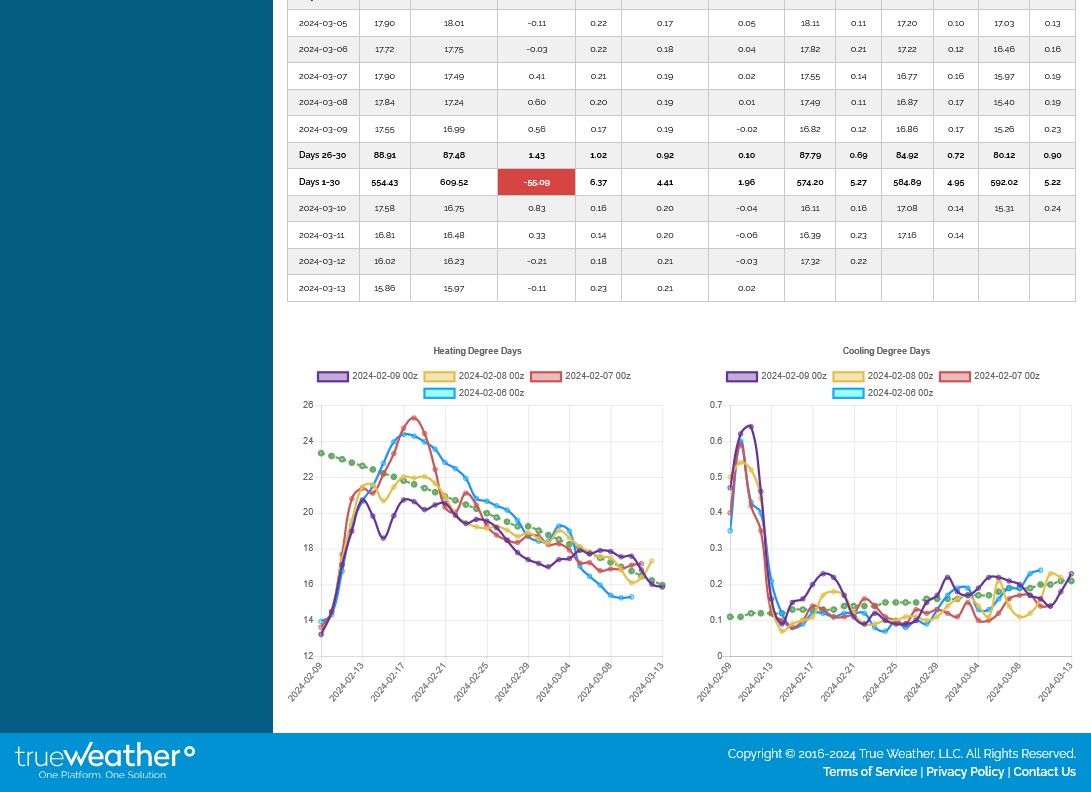
I disagree. Though the last 0z European model was another -4 HDDs, the American model/GEFS has been ADDING HDDs for 3 straight runs. The last 12z run is now +15 HDDs compared to the 18z run on Tuesday evening.
You can see that 12z run in purple below/left. Blue is the oldest, 18z run. Green is the slowly decreasing, seasonal/historical average as we've passed the coldest time of year.
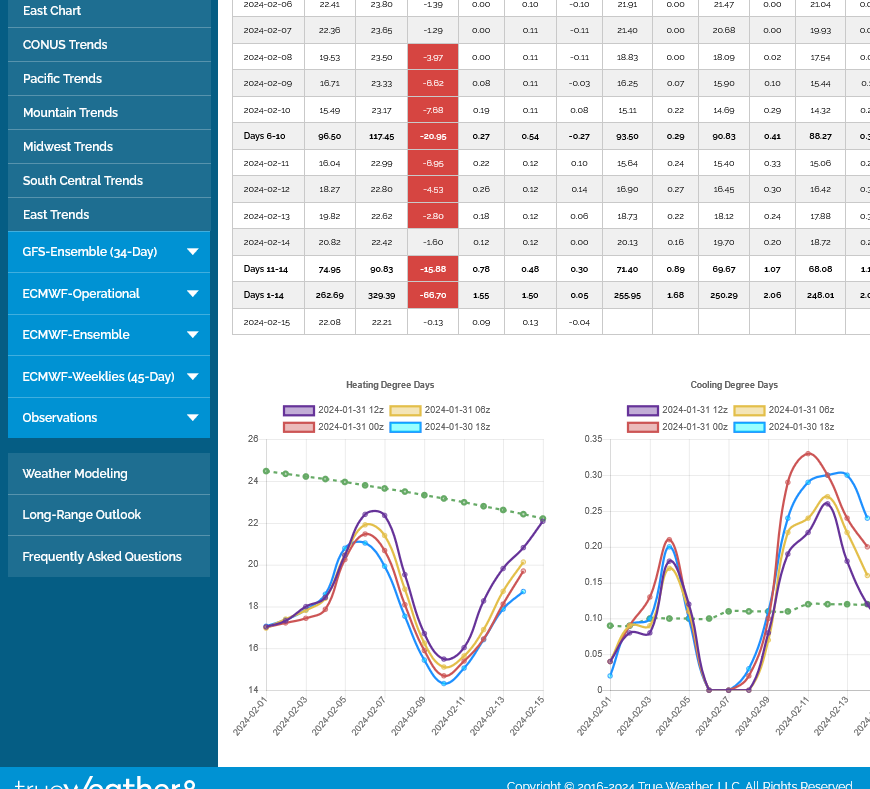
Added: A key part to this forecast is the direction of the lines at the end of this 2 week period below.
Strongly in the UP direction. This is the best indicator that we have for week 3 as Larry also noted in his informative post below.
The extended models *fwiw* and now the end of the regular models have been/are suggesting a major pattern change to much colder in at least the E 1/3 of the US for the 2nd half of Feb and quite possibly extending into at least early March. Moderate to strong El Niño climo supports this colder pattern change to a good extent.
Thanks Larry. The massive surplus in storage is a huge bearish factor.
About as expected at -197 Bcf. The next 2 reports will be pretty small and we will remain at the topside edge of the historical storage average.
However, the pattern is suggesting some pretty robust cold developing at the end of 2 weeks.
https://www.marketforum.com/forum/topic/83844/#102035
It's actually surprising to see how weak ng prices are here with this development. This is an indicator or the other very bearish factors pressuring prices lower and scaring speculative longs away.
1. Buy the rumor/sell the fact type trading ahead of and after the last 2 HUGE ng drawdowns.
2. Very high storage for this time of year.
3. Winter is over half over.
4. Supplies coming in more than ample.
5. Bearish future export news that Jean posted about?
#5 is a stretch because it wouldn't have an impact for many years and could change a great deal before then.
https://ir.eia.gov/ngs/ngs.html
for week ending January 26, 2024 | Released: February 1, 2024 at 10:30 a.m. | Next Release: February 8, 2024
| Working gas in underground storage, Lower 48 states Summary text CSV JSN | |||||||||||||||||||||||||
|---|---|---|---|---|---|---|---|---|---|---|---|---|---|---|---|---|---|---|---|---|---|---|---|---|---|
| Historical Comparisons | |||||||||||||||||||||||||
| Stocks billion cubic feet (Bcf) | Year ago (01/26/23) | 5-year average (2019-23) | |||||||||||||||||||||||
| Region | 01/26/24 | 01/19/24 | net change | implied flow | Bcf | % change | Bcf | % change | |||||||||||||||||
| East | 605 | 657 | -52 | -52 | 584 | 3.6 | 579 | 4.5 | |||||||||||||||||
| Midwest | 727 | 788 | -61 | -61 | 715 | 1.7 | 689 | 5.5 | |||||||||||||||||
| Mountain | 185 | 194 | -9 | -9 | 133 | 39.1 | 137 | 35.0 | |||||||||||||||||
| Pacific | 223 | 228 | -5 | -5 | 141 | 58.2 | 199 | 12.1 | |||||||||||||||||
| South Central | 919 | 990 | -71 | -71 | 1,031 | -10.9 | 925 | -0.6 | |||||||||||||||||
| Salt | 248 | 269 | -21 | -21 | 299 | -17.1 | 279 | -11.1 | |||||||||||||||||
| Nonsalt | 672 | 721 | -49 | -49 | 732 | -8.2 | 646 | 4.0 | |||||||||||||||||
| Total | 2,659 | 2,856 | -197 | -197 | 2,605 | 2.1 | 2,529 | 5.1 | |||||||||||||||||
Totals may not equal sum of components because of independent rounding. | |||||||||||||||||||||||||
Working gas in storage was 2,659 Bcf as of Friday, January 26, 2024, according to EIA estimates. This represents a net decrease of 197 Bcf from the previous week. Stocks were 54 Bcf higher than last year at this time and 130 Bcf above the five-year average of 2,529 Bcf. At 2,659 Bcf, total working gas is within the five-year historical range.
For information on sampling error in this report, see Estimated Measures of Sampling Variability table below.
Note: The shaded area indicates the range between the historical minimum and maximum values for the weekly series from 2019 through 2023. The dashed vertical lines indicate current and year-ago weekly periods.
+++++++++++++++++
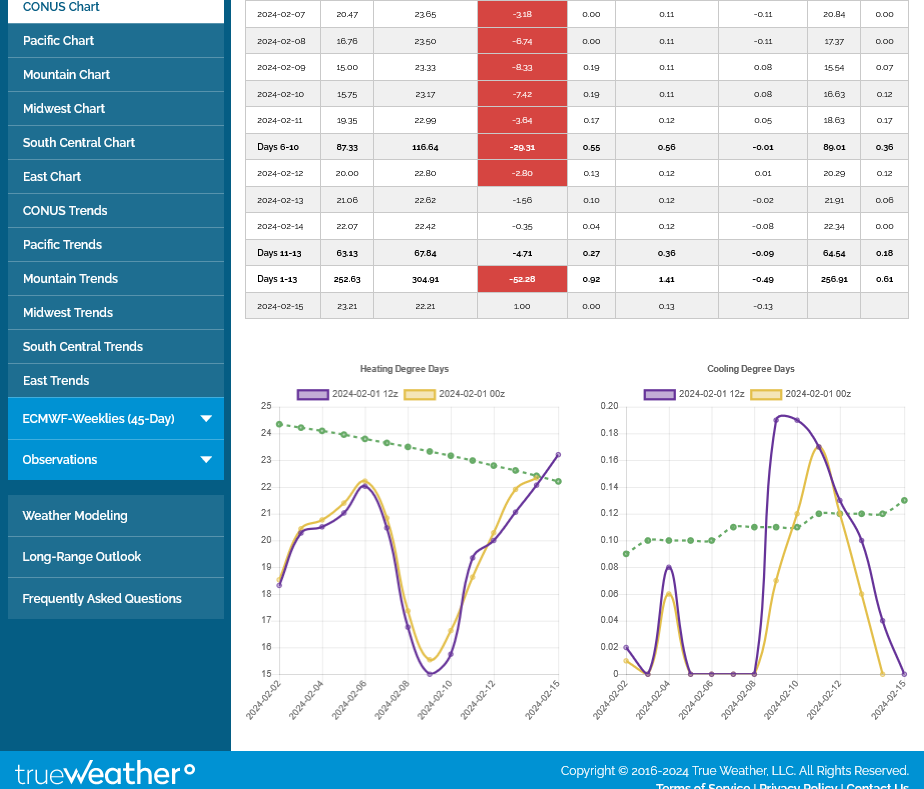
This just out 12z European model was -4 HDDs bearish based entirely on day to day changes. Still the same pattern which is still defined by the spike higher in wee 2 as you can see below.
The direction and slope of this trend when the line disappears on the far right, at the end of week 2, is usually our best indicator for whats coming in week 3.
A month+ ago, with more than half of Winter still ahead, this same thing is what caused the massive price spike higher before the intense cold earlier this month.
However, it's impossible for mid-February cold to generate the same HDDs as mid-January cold and Spring is also a month closer with current storage near the top of historical averages.
If this pattern doesn't change, I have high confidence that NG prices will be higher next week......as the cold gets closer and HDDs start ramping UP, not down as they normally do.
A cold end to the heating season can still erode the surplus by several hundred Bcf and $2 is pretty dang cheap. The cure for low prices is...........low prices because it attracts buyers!
But this is only predicated on the end period pattern NOT changing over the weekend. On that, I barely have moderate confidence.
Speaking of low prices:
1. 1 year chart...at some key support levels.
2. 10 year chart.........prices don't spend much time lower than this. The last spike lower than this in 2020 was entirely from COVID. Unless we are in the early state of a major recession, the economic slowdown which cut into Industrial demand is not going to happen again. However, fake green energy, wind and solar is cutting into X% of the demand(single digits).
https://tradingeconomics.com/commodity/natural-gas
Can't gain any traction
Hi cc,
The models were -4 HDDs bearish over night nased on indivually milder days that added up.
So we spiked lower but held On mega support approaching $2.
The models are still the same with the pattern change to colder as week 2 progresses, potentially MUCH colder at the end of the period and in week 3.
If that tend continues and we are several more days into the new cold regime on model solutions next week, I would be shocked to see us go lower.
I wouldn’t be shocked to see the models chnge to milder over the weekend jut shocked if the market doesn’t get some bullish traction from this same outlook advancing and coming to fruition
i tried to buy the spike lower and missed...i tend to agree with u
Natural gas futures hovered close to even in early trading Friday as the market continued to look to the second half of February for a possible shift away from the exceptionally mild winter weather pressuring prices. The March Nymex contract was unchanged at $2.050/MMBtu at around 8:43 a.m. ET. April was off a fraction of…
++++++++++++++++
This was the last 0z, -7 HDDs last European model.
I'm tempted to be long over the weekend, which I never do but this just out 12z Canadian model tells me to don't do it.
Too many of the ensembles have a very sharp cutoff between the Polar Vortex in Canada and much milder air in the US on this last map at the end of the period(384 hours). It is clearly NOT AS COLD as end period solutions earlier this week.
Meteorologists using guidance like the MJO, which I haven't looked at could be seeing a milder week 3 than what the late week 2 has been showing and that could explain us being so close to the lows, even with this pattern change.
This looks like a wonderful place to buy. The price is extremely cheap, we are at mega technical and psychological support-$2. The yearly/seasonal low is due(this would be early).
However, there's some powerful bearish forces too and that's why we are down here, even with a cold risk late in week 2. Closing near the lows would actually set up a potential gap lower on Sunday Night if the models turned a couple notches LESS cold as the last Canadian model has.
This is certainly NOTHING LIKE the cold outbreak that we had in January at all. That one featured extreme positive anomalies over Greenland and a high magnitude -NAO. The last NAO is just neutral.
That could change over the weekend, however.
Also the market reacted strongly over 3 weeks before the last outbreak. This time.........it doesn't care.
I've learned to listen to the market enough to be leery of a market that knows what I think that I do but doesn't care when I think it should.
So I'll do nothing and not risk wrecking my weekend but am not telling anybody else what to do.
I've had a strong cold bias and bullish bias all week but the market is telling me it doesn't care or that I'm wrong.
https://www.marketforum.com/forum/topic/83844/#83856
https://weather.gc.ca/ensemble/charts_e.html?Hour=384&Day=0&RunTime=12&Type=gz
Related to that last thought. As mentioned several times this week. This cold is coming a month after the mid point of the heating season. Storage levels are near the top of the historical range.
The spike higher in prices from the last cold wave came from large specs that were interested in being long for extreme cold at that point in the Winter, even with record NG in storage.......after a very long near record mild stretch pressured the market to being extremely oversold and there is actually a positive seasonal from mid December to early January. There were several factors more favorable than this to generate that $11,000/contract spike higher in the February contract.
The March/April contracts right now are completely different animals than the January/February contracts.
Despite this, I'm still confident that the price goes higher next week IF the Polar Vortex drops farther south than most of the Canadian ensembles have on that last solution.
Important note. That last statement was a HOPE statement(from a biased bull) and an IF statement (not a forecast).
My honest, updated forecast looking thru the objective meteorologist's eyes is that this last solution, going in the WRONG direction means an immediate adjustment to NEUTRAL.
When the Natural Gas Intelligence headline story above is about traders waiting for the colder pattern shift in mid-February, than everybody knows......and we can't muster any gains ahead of the weekend.
So the question is: What if the maps are NOT colder on Sunday Night?
Answer: A potential gap lower and below $2. You know how natural gas is. It's known for big gaps higher and lower on Sunday Night. It could end up being an exhaustion gap that gets filled.
Regardless, I think that the 12z GEFS and European model solutions the next 2 hours will set the tone and the early week 2 of the GEFS is coming out a bit more bullish.
Many spec traders will also be positioning for Sunday Night.
As mentioned in the last post, the 12z GEFS was coming out colder, it ended up +5 HDDs/bullish.
So we bounced up towards the highs. This was nothing more than a bunch of colder days adding up.
1 hour later: The European model was also +5 HDDs and all of them were from the last 5 days in the 2 week period with a colder increasing rate of HDDs at the end of the period........which is pretty bullish. So were up close to the mid morning highs.
This last map of the European model captures the problem as depicted with negative anomalies that identify/are caused by the 2 distinct jet streams vying for control of our weather/temps.
There is a Northern Stream with its negative anomalies in the Northeast, driving down very cold air in Canada.
However, there's also an El Nino driven Southern Stream in the Southwest. This will be applying forcing on the atmosphere in the OPPOSITE direction and trying to DEFLECT the Northern Stream. 
You can see by this 850 temperature map with its tight, horizontal thermal gradient, that even a slight shift north or south will count A LOT for the Northeast 1/3rd of the country.
Up at the highs right now, the price charts are poised for a GAP HIGHER on Sunday Night if the models stay colder over the weekend!
I never pulled the trigger! Are we gapping up tomorrow night?
Not likely with these maps!
But a small change with this pattern means a huge difference
A small change on the 0z runs caused +10 HDDs for the GEFS and +13 HCDs on the European Ensemble compared to their previous runs.
I have no idea how we'll open but don't think it will be a big change maybe up a tad
The slightly higher open in tandem with a close near the highs has put in a tiny gap higher of 4 ticks, which is $40/contract in natural gas.
Make that 3 ticks and $30.
We've built up on that to being +$420/contract.
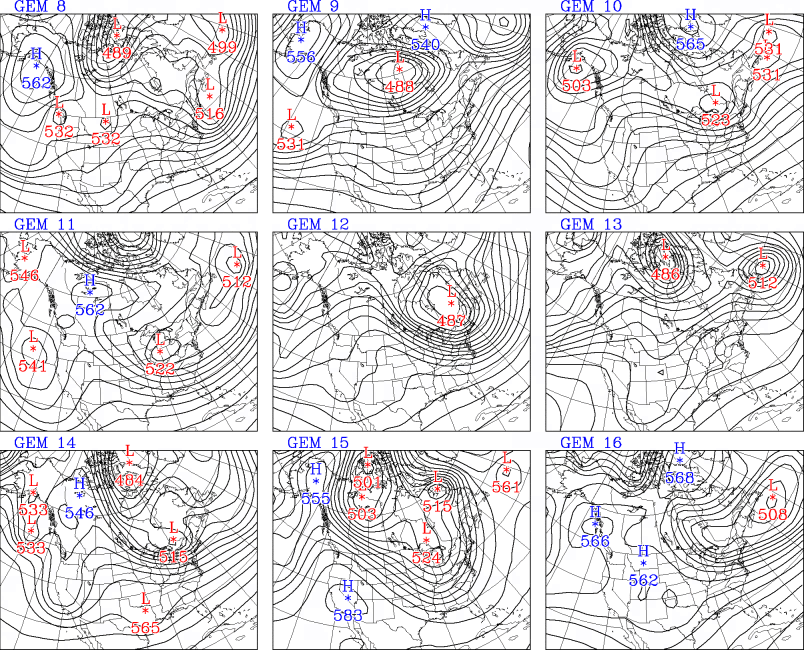
This last Canadian model gives us a good idea of the extreme disparity in solutions that lie, mostly in 2 distinct camps. 1 has a piece of the Polar Vortex sinking close to the US or even south of the border. The other keeps it far enough north for the flow to be mostly mild/Pacific.
The mean/average at the top is on the cold side but doesn't represent most solutions that are colder or milder. As mentioned last week, I'm cold biased here as well as favoring the long side.

The Feb/March period is the one which features the most significant lows in the year. In 2023, with extremely bearish fundamentals and massive storage growth vs average that started in September 2022, that low didn't happen until the start of April.
https://charts.equityclock.com/natural-gas-futures-ng-seasonal-chart
The last 18z GEFS was +2 HDDs. However, the pattern at the very end of the period (384 hours) is widespread zonal flow and almost no northern stream with the displaced Polar Vortex too far north.
We quickly filled the minuscule gap higher from the open. If one were to place any technical significance to this, it would be a tiny gap and crap, buying exhaustion formation which is a negative/bearish formation/indicator.
I would take that indicator with a grain of salt in this situation, especially since its not at the end of a move higher.
It's been a very quiet, low volume session today. Speculators don't have incentive to sell way down here with Winter running out. Or to buy without enough cold and time to erode the surplus in storage.
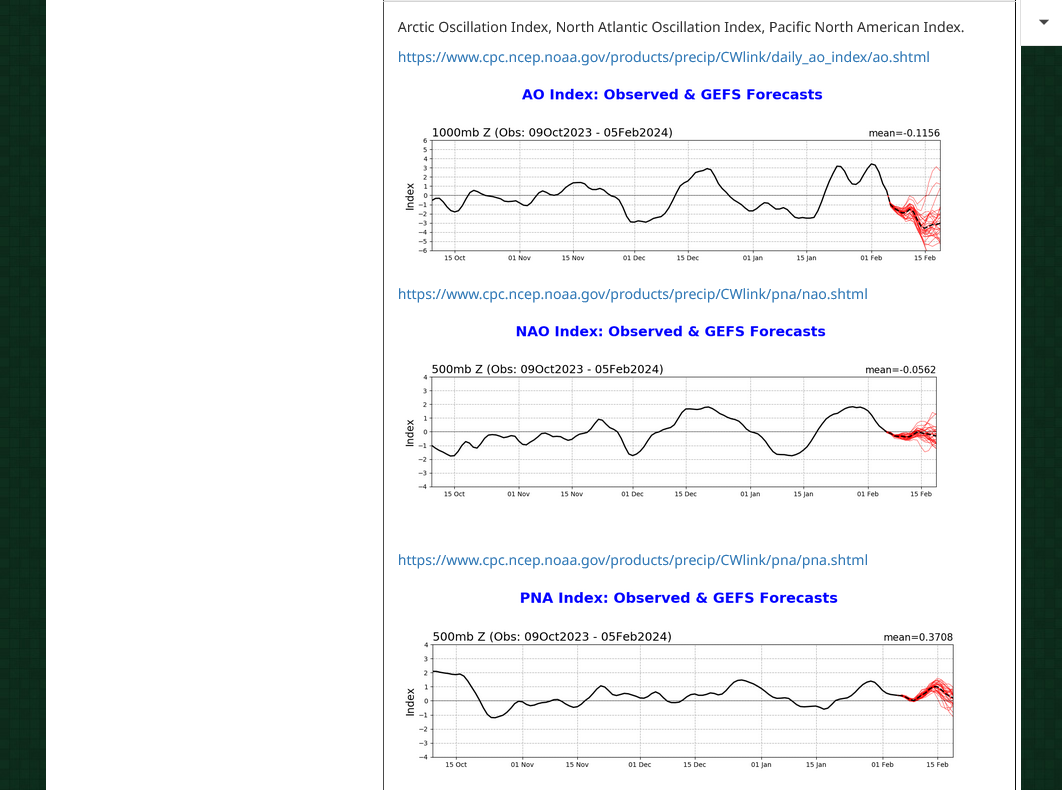
The image on the last post has set the tone for cold expectations LOWER at the end of the forecast period. The biggest POTENTIAL cold factor is the insanely low ---AO at the end of the period. However this is a result of the teleconnection/couplet featuring a displaced Polar Vortex in East and Central Canada with a zonal flow underneath that CUTS OFF the main body of bitter cold transport into the the US.
Getting a much more -NAO would assist the Arctic air transport southward.
Currently the predicted negative anomalies in the Southern US are totally a product of the El Nino drive Pacific Jet Stream and NOT the cold Northern Stream.
Despite these upper levels being unfavorable in the US for a big intrusion of Arctic air, the lower levels will feature some of that colder, more dense air leaking well south of the Canadian border in rapidly moderating form because upper level steering currents will be transporting Pacific air from west to east.
The just updated 12z Canadian model has a significant minority of solutions that still like the idea of a big piece of Polar Vortex shifting much farther south into the Northern US. So the milder solution in the majority, described above is NOT a foregone conclusion!
https://weather.gc.ca/ensemble/charts_e.html?Hour=384&Day=0&RunTime=12&Type=gz
Also, a predicted -3 AO is of a magnitude that doesn't happen that often as you can see on the graph. This is likely being caused by the Sudden Stratospheric Warming event taking place. The models have notoriously low forecasting skill for events like this with regards to the impact in the troposphere, where most of the atmosphere and our weather is.
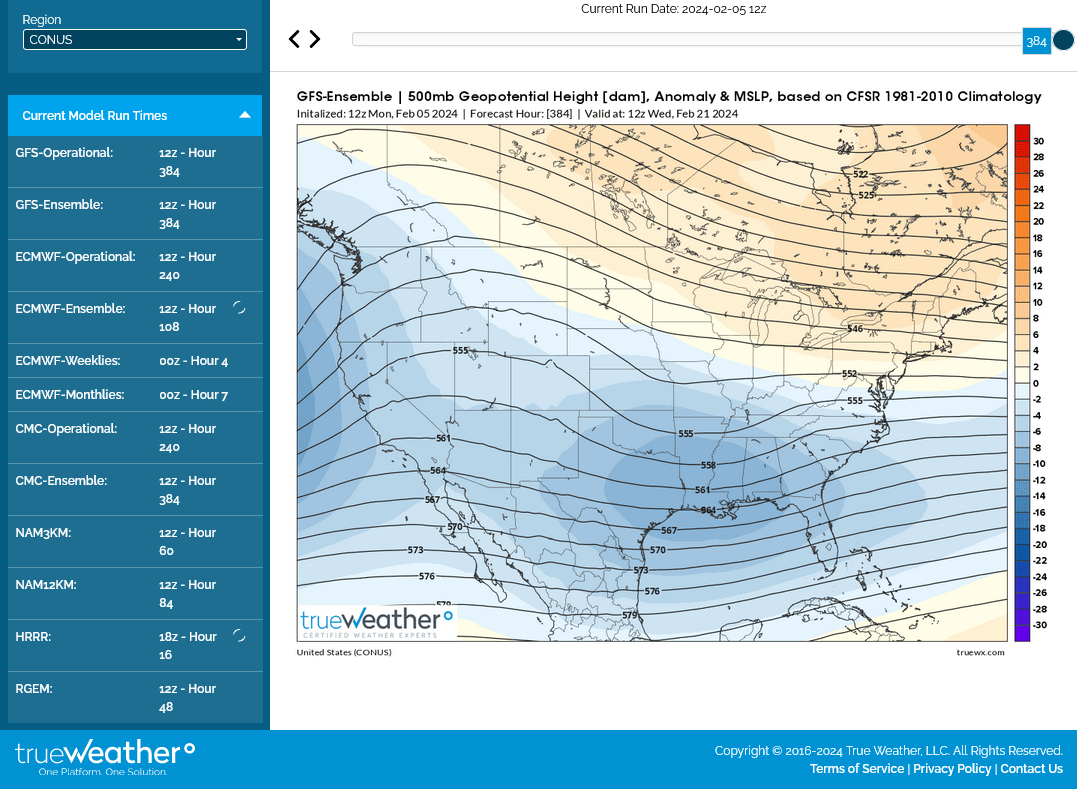
This was the last 500 mb anomaly map for the latest 12 GEFS at 384 hours. Shown to illustrate that the negative anomalies in the south are completely a result of the El Nino, Pacific origin Southern Stream teleconnection.
The displaced Polar Vortex is just above the top of the map. However the SURFACE/LOW LEVEL, dense, very cold air associated with it will get some good pushes south into the United States, thanks in part to some modest ridging in Western Canada to the Rockies in the U.S.
Some of that cold will be captured by the circulations associated with the negative upper level southern stream anomalies.
This COULD result in snow/ice at a latitude unusually far south for the month of February!
Update: The last 12z European model just out was +4 HDDs from colder days 8-9-10-11 but not from a pattern change. So we popped $400/contract.
The milder, Pacific jet stream is still TRYING TO blow in from west to east at the end of the period. However, it handles the Northern Stream much differently than the GEFS above, with a piece of the displaced Polar Vortex in far Southeast Canada and MUCH COLDER.
The models are coming into more agreement that the pattern will feature a widespread, modest brand of cold for mid February and beyond.
This was the HDD graph of the last 4 GEFS runs, including the just out 12z run in purple that's a bit colder than the previous 3 runs.
The market doesn't care. It's too late in the heating season and we have way too much ng in storage and the amount of cold is only a bit above average.
In December or even January, this would be a BULLISH graph, especially coming from a mild period and prices this low. Large specs have lost interest in trading weather right now.
At the same time, $2 is super, mega support and selling dries up close to that level.
Prices have rarely traded below $2 the past 2 decades. If the forecast for Feb was very mild and not modest cold, I think we would trade below that level for several weeks, put in the seasonal low, then get back above $2 in March and stay above that for the rest of the year.
There are more important factors than weather that are dominating ng trade right now and some are pretty bearish but the weather is a bit bullish and NOT bearish.
Update: The 12z European Ensemble came out -3 HDDs and we are down to the lows, just over $2.
LNG by Biden IS political!
Started by metmike - Feb. 7, 2024, 1:08 p.m.
The last 0z European model was +6 HDDs…..didn’t matter. It appears as if Biden’s political stunt to disrupt our all important export market is obliterating the mentality of the bulls.
I would not be surprised to see a recovery at any time but this is like the trying to catch the proverbial falling knife, trying to pick the bottom here.
Yep.. I'm screwed
Could be the ETF UNG which had a reverse split just took out its prior low and maybe now we have a double bottom.. probably just groping
Sorry to hear that cc )-:
EIA was bearish vs expectations. I haven't been following volume every day but its picked up a bit today vs some recent real volume days(104,000 in the March before noon), so we should be finding decent buying interest down here. It always gets very interesting to analyze when a commodity trades to extreme high or extreme low prices.
The question is...........how low will we go?
Crazy things can happen at the extremes which can feature panic selling or crying uncle bulls that are underwater. Especially those that anticipated $2 mega support continuing to hold.
Again, we have the psychological impact of Biden's shocking decision to disrupt our export market as well as it potentially changing the actual demand equation.
US energy/ng interests have never been more infuriated with a decision by a president. Biden never had their vote but he just gave them a double dose of his middle finger.
for week ending February 2, 2024 | Released: February 8, 2024 at 10:30 a.m. | Next Release: February 15, 2024
| Working gas in underground storage, Lower 48 states Summary text CSV JSN | |||||||||||||||||||||||||
|---|---|---|---|---|---|---|---|---|---|---|---|---|---|---|---|---|---|---|---|---|---|---|---|---|---|
| Historical Comparisons | |||||||||||||||||||||||||
| Stocks billion cubic feet (Bcf) | Year ago (02/02/23) | 5-year average (2019-23) | |||||||||||||||||||||||
| Region | 02/02/24 | 01/26/24 | net change | implied flow | Bcf | % change | Bcf | % change | |||||||||||||||||
| East | 568 | 605 | -37 | -37 | 536 | 6.0 | 529 | 7.4 | |||||||||||||||||
| Midwest | 689 | 727 | -38 | -38 | 651 | 5.8 | 629 | 9.5 | |||||||||||||||||
| Mountain | 183 | 185 | -2 | -2 | 122 | 50.0 | 127 | 44.1 | |||||||||||||||||
| Pacific | 228 | 223 | 5 | 5 | 126 | 81.0 | 190 | 20.0 | |||||||||||||||||
| South Central | 916 | 919 | -3 | -3 | 962 | -4.8 | 861 | 6.4 | |||||||||||||||||
| Salt | 257 | 248 | 9 | 9 | 275 | -6.5 | 256 | 0.4 | |||||||||||||||||
| Nonsalt | 659 | 672 | -13 | -13 | 687 | -4.1 | 606 | 8.7 | |||||||||||||||||
| Total | 2,584 | 2,659 | -75 | -75 | 2,397 | 7.8 | 2,336 | 10.6 | |||||||||||||||||
Totals may not equal sum of components because of independent rounding. | |||||||||||||||||||||||||
Working gas in storage was 2,584 Bcf as of Friday, February 2, 2024, according to EIA estimates. This represents a net decrease of 75 Bcf from the previous week. Stocks were 187 Bcf higher than last year at this time and 248 Bcf above the five-year average of 2,336 Bcf. At 2,584 Bcf, total working gas is within the five-year historical range.
For information on sampling error in this report, see Estimated Measures of Sampling Variability table below.
Just out 12z European model was a whopping -9.5 HDDs and we've spiked to the lows =-$560/contract today.
It's the purple line on the left with the tan line being the previous 0z run from 12 hours ago(that was +4 HDDs vs the previous 12z run from Wednesday)
Most of the milder/less cold days were at the tail end of the forecast. Green line is the slowly dropping average HDDs as we get closer to the end of the heating season.
Thanks much, cc!
Where did you get that analysis from, please?
The dynamics of what caused crude to spike below 0 on April 20, 2020 will never cause natural gas to trade below ZERO in the injection season from storage being too full.
Natural gas‘s extremely strong seasonal low almost always happens at the end of the WITHDRAWAL season, when storage is bottoming out at its LOW POINT.
Re: Re: Re: Re: Re: Re: Re: Re: Natural Gas 1-8-24
By metmike - Feb. 4, 2024, 6:25 p.m.
If storage is getting full late this year, there could be some pressure on ng prices in the Fall, that limits the seasonal rally and causes an early peak, IF we have robust storage.
However, the price/seasonals, physical market structure and buyers time frame will NEVER cause natural gas to trade below ZERO using the reason that crude spiked below 0 during the injection season.
It's always great fun to look back at when crude traded below 0!
Re: Re: Re: "SAFE HAVEN" COMMODITIES
By metmike - Oct. 16, 2023, 2:06 p.m.
Added: The 0z European model was another -8 HDDs bearish overnight compared to the already less cold 12z prior run. The colder pattern showing up in late Jan/early Feb appears to have only been enough to keep us holding $2 temporarily.
In the absence of adding MORE cold(instead taking it away) we are collapsing lower.
Latest weather:
https://www.marketforum.com/forum/topic/83844/
Prices are historically low right now, not likely to stay down here for a long time....... unless we have a major recession coming.
https://tradingeconomics.com/commodity/natural-gas
Funny it's a major news wire actually I forgot which one
Please don’t cause that to deter you from sharing stuff like that. I post articles from natural gas intelligence because the vast majority of times, they have value.
There are, mostly isolated cases when their reporters, that are paid to explain the reasons for market action, are out to lunch. I’m sure they have several good sources and more than me for sure because that’s what they do……cover every aspect of natural gas.
However, one has to be able to distill/refine that information to gain insightful discernment that is specifically applied to market traders mentality.
Watching immediate, strong, knee jerk reactions to price when weather models are coming out gives a person with that information an edge…….when the market is trading that during key, high residential demand (for heating/cooling)times of year.
btw the comm of traders shows specs have been loading the boat long..yuck
was bar chart nasdaq.com
March'24 nat gas prices are again lower today at $1.84. And while a better/cooler pattern is still expected Feb 16-22, surpluses are going to be a plump +380-400 Bcf. As such, it will take an exceptionally cold late February or March US weather pattern to meaningfully reduce them. For now, we expect near seasonal draws for late Feb into March, suggesting surpluses will hold above +300 Bcf into the start of Spring. Although, we expect a much hotter vs normal summer for a large portion of the US, providing opportunity for surpluses to be steadily reduced ahead of next years La Nina winter. How low can natural gas prices go? Or are prices due for a technical/oversold bounce at some point soon? Clearly, colder trends are needed if a sustained weather rally is to be expected.
Great stuff, CC!
You mentioned specs loading up longs. That's not always a bad sign for bulls. Large specs with deep pockets are likely putting on long term positions here knowing that prices are extremely unlikely to stay below $2 for more than a spike lower. Which is happening now.
Markets trade psychology in the short term and the seasonal low, high storage and lack of extreme cold were already bearish issues superimposed on market mentality......... THEN Biden's political stunt to curb export demand in order to get green votes this November was a bearish psychological shock to the market.
It hasn't cut 1 Bcf of ng yet but the market speculates and dials in a mentality/expectation the second news about it comes out. I watch that all Winter long every time a new weather model is coming out. A sharply colder or milder few days will instantly cause a knee jerk reaction to prices...........even when the period might be 10+ days out. and the next run could flip the other way.
What Biden did is so unprecedented and so unexpected that the bearish overhang to market psychology is impossible to gauge in terms of magnitude and time frame to dial in before the market feels its in the price. And markets, especially natural gas tend to OVER react to powerful news.
The big cold wave in January, for instance that caused a $16,000?/contract bounce higher from oversold conditions. In the midst of extreme cold forecasts getting colder that may have seem justified during a panic buying spike up but in the rear window, here in early February, we are $20,000/contract lower than the spike up.
Clearly it was an OVER reaction to a short term WEATHER extreme which often defines natural gas trading in the Winter.
On this upcoming colder pattern. Though some forecasts have moderated, its too late to make much difference and even when it looked the coldest, it didn't rally the market much.......just temporarily delayed the collapse. There were several models solutions that came out colder and the market still went lower. That was a clear indication that the colder weather was NOT the most important trading item.
Of course met Mike . If only it were large specs.. They actually added to shorts! It was small specs that loaded the boat . I've seen this all before....... Also agree that I knew it was trouble when we couldn't rally on colder forecast... Was like everybody was waiting for a reason it would go up and instead it was waiting for a reason to go down....Any weather changes since yesterday close?
The just out 12z European model was +11 HDDS vs the previous 0Z run.
I wouldn't get overly excited yet. It's not from a pattern change, instead just colder individual days in week 2. Other models did not have higher HDDs.
At this point overly excited might be not seeing red arrows... Are you currently holding an ng position?
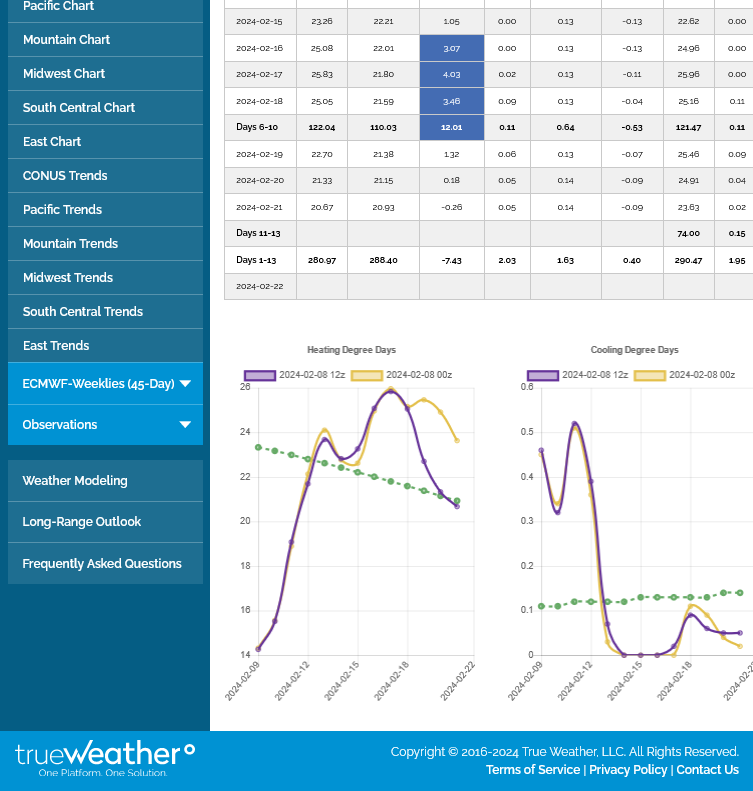
The GFS E. 34 day forecast is bearish to average while the ECMWF E. 45 day forecast is bullish (+2 HDDs per day or so). The GFS E. 34 day forecast runs once a day, but the ECMWF E. was last updated on Thursday and will only update again on Monday evening....... Just read this..
I have no position.
Was tempted the last 2 Fridays to buy early pm but I have 120 kids at my Friday chess practices, the last 90 minutes of trading and don't feel comfortable being cut off from watching the market.
Here's those 2 products that you were referring to.
The top one(European model ensemble left graph) features the last run on Thursday in purple. Its a bit bullish:
1. It was +22 HDDs vs the previous run from Monday. This is over 45 days so much bigger CUMULATIVE changes.
2. The market knew this on Friday and didn't care.
3. Look at the plummeting green/average HDDs. The market knows that even a moderate brand of cold can't chew up much of the surplus this late in the heating season.
The last GEFS run below is also in purple. It's over 34 days so much bigger numbers that shorter term guidance that is a tad less than half that.
1. Each run has been losing more and more HDDs.
2. The last run from yesterday was -20 HDDs vs the previous one, -31 HDDs vs the run before that and -38 HDDs compared to the one before that.
So you are saying this guy who wrote this is full of bunk .. He was touting the euro one saying it was bullish . And it's old news? So only the 11 plus hdd you pointed out earlier . Guess..wait for more data.. I also wonder what gave you the inclination based on Friday's action to go long?
Looks like a disastrous last run of the Euro losing a lot of HDD..
The inclination was from:
1. The tendency for a strongly negative AO to lead to a colder pattern than model solutions.
2. The historically cheap prices and market being oversold.
3. Extremely strong Seasonal tendency to be putting in a bottom in the Feb/March time frame.
4. European model was colder.
5. I was in the mood to gamble/take a chance.
The NWS 6-10/8-14 day outlooks just issued were pretty chilly.
However, the just out 12z European Ensemble was an incredible -19 HDDs bearish compared to the previous run. That's got to be in the top 1% of biggest changes for this ensemble between runs.
Just to follow up on what I disagreed on with the commentator.
Crude dropped below 0 because:
1. COVID destroyed massive demand
2. Refineries responded first and cut way back on refining crude for unleaded and diesel, since there was an over supplied market.
3. There was a lag of a couple of months befor a corresponding cut in crude supplies (Opec cuts) took place to balance the crude supplies to match the loower demand.
4. During the brief period before cuts too place, the cash price and front month collapsed from excessive crude already sceuduled to be delivered and the market not needing it.
5. On expiration date for the May 2020 crude contract there was still some open interest of longs and excessive product/supplies with no home and no buyers, just the longs and excessive product in barges with no place to go that had to sell based on legal contract obligations/rules/expiration dates.
Towrds the end of trading, on the last day of the May crude, panic selling hit to avoid a stiff penalty to the longs for not getting out or maybe in some cases to avoid taking delivery.E
This situation ws extraordinarily rare and caused by unique crude dynamics and the COVID demand dropp.
Natural gas dynamics are way too different From my understanding but I don’t kno everything
With regards to the last run of the E model. I’m thinking that we are so late in the heating season that the impact of 1 weather model run won’t be anything like it was a month ago. When the weathers impact is waning quickly like this, my skill to predict prices drops too.
There will an increasing number of days when the price reacts to something and I have to guess why or read other explanations from better informed sources which I appreciate reading about When they come from posters like you.
this week the late session shift in one forecast began the slide late thursday
cc,
Good point but from this perspective, the slide has been going on for much longer than than since Thursday.
These charts are very flawed but they give us the picture.
We're trading just below the lows on Friday.
Like tjc, I get real excited when markets are making EXTREMES higher or lower and look for a spot for a weather pattern change to pick the top or bottom.
The real excited emotion is there looking at these charts. The convincing, high probability reason to buy is absent. Reasons? Yes they exist but nothing at this exact moment thats greater than the selling forces. Gamble......yes.
Will we have a spike bottom low in here pretty soon? Yes.
Could this be it and an exhaustion gap lower? Yes.
Trade that? A gamble vs a smart position for me.
i agree..i initially saw the opining of a possible bottom..i didnt like it for the exact reasons you state now... and then i got sucked in with large shorts in the ung etf...major mistake...as i mentioned last few days and comm of trares also wasnt good with small specs having bought as of last tuesday..they may be gone by now prob not
The overnight European was +2 HDDs which is nothing(the pattern still features no sustainable cold). In other news.........this is post #100 for this thread! Time for a new thread when I get the chance and I appreciate all your contributions in this one so far, cc!
Maybe we should go for 200 and have people feel like they're scrolling down to China (-:
Sorry about that!
++++++++++++++
The early afternoon 12z European ensemble was down another whopping -HDDs!
today the house voted against the biden ,,couldnt even cause a ripple rally....this trade has ben my biggest mistake in years..and i felt it and said it after comm of traders but sat and watched it fall....fear grips now
Sorry to hear that you're hanging on so long and taking such a beating.
With regards to the vote. It meant nothing because the Senate is not likely to go along with it and certainly not the White House.
I think Biden doing this may have put an extra negative/bearish psychology on the market at a time when other strong negatives exist but fundamentally, impacts will be pretty far down the road and the rig count, along with production will likely respond accordingly like they always do based on financial incentive.
However, the legislation is unlikely to make it through the Democrat-controlled Senate or White House.
The pause does not impact existing exports or projects that are under construction.
++++++++++++++
Biden's decision would have looked better if NG prices were high or if storage levels were low but its 100% the opposite.
What is the best thing to help a market sitting at 20 year lows to recover?
INCREASE DEMAND!
Since this Winter was so mild, we actually CUT DEMAND significantly for residential heating and made it worse.
Wind and solar power are also cutting demand a bit.
Industrial demand is not going to increase much, maybe even slow down a bit.
Where will the increase in demand come from? No place.
In fact, it would appear as if Biden is interfering with the free market and the ability of US energy company's to use the global markets to sell their products by using governmental imposed laws to prevent the natural gas/energy markets in the US from increasing future exports.
However, this is mainly for political posturing by both sides because the reality is that massive amounts of already approved export terminals not yet build can triple our exports by the end of this decade.
https://www.eenews.net/articles/house-approves-bill-targeting-natural-gas-export-pause/
I completely understood it wasn't going to pass the Senate . The point is it has significant opposition . So even though it was a formality the sentiments could have propped up such an oversold market but didn't even make a dent So we have all these negative factors and cuts in demand because of the warm weather and lots of natural gas around.. I'm still not understanding why you can't continue to go lower or head towards zero as you stated before.. perhaps I don't understand fundamental difference between this and crude
cc,
Read the explanation again. I’ll post the link above later.
Crude oil went below 0 because of too much supply without a place to go On the day of contract expiration.
refineries had shut down production because of less demand for gasoline and heating oil. Crude was still gushing in t the previous rate because of the lag in cutbacks to crude production (OPEC) for instance.
storage in natural gas is hitting the LOWS of the entire year right now. The amount of space to put it is the greatest that it will be for the entire year.
When the March contract expires, there won’t be massive vesicles loaded with natural gas and no place to go.
Later this year, when storage is getting plump, we could see pressure on prices but producers will see that coming many months in advance and cut back.
also seasonally, prices are at their high point of the year in the Fall, despite the storage getting full.No chance for prices to spike to euro because of seasonal dynamics that strongly support prices.
Can we go below 0 here?
Anything is possible but it WON’T be for the reason that crude dropped below 0 and would appear to be almost impossible.p because that unique crude dynamic is the only reason that crude dropped below 0.
Got it . So like always the markets are driven most by manipulative forces lol.. No will arrived baby continue to early tomorrow snow It was reported to an in stance spikes all the bad news We are down at COVID levels which defies any logic.. Even the Biden news all psychological It doesn't even have an effect on any of the current situation. Ironically if it ever does by that time natural gas will probably be triple this level
Got it . So like always the markets are driven most by manipulative forces lol.. We are down at COVID levels which defies any logic.. Even the Biden news all psychological It doesn't even have an effect on any of the current situation. Ironically if it ever does by that time natural gas will probably be triple this level
more spec adding to longs..so no panic
more spec adding to longs..so no panic
cc,
Read the explanation again. I’ll post the link above later.
Crude oil went below 0 because of too much supply without a place to go On the day of contract expiration.
refineries had shut down production because of less demand for gasoline and heating oil. Crude was still gushing in t the previous rate because of the lag in cutbacks to crude production (OPEC) for instance.
storage in natural gas is hitting the LOWS of the entire year right now. The amount of space to put it is the greatest that it will be for the entire year.
When the March contract expires, there won’t be massive vesicles loaded with natural gas and no place to go.
Later this year, when storage is getting plump, we could see pressure on prices but producers will see that coming many months in advance and cut back.
also seasonally, prices are at their high point of the year in the Fall, despite the storage getting full.No chance for prices to spike to euro because of seasonal dynamics that strongly support prices.
Can we go below 0 here?
Anything is possible but it WON’T be for the reason that crude dropped below 0 and would appear to be almost impossible.p because that unique crude dynamic is the only reason that crude dropped below 0.