Overdue for this new thread. I've been swamped with chess as we have 3 tournaments coming up.......sorry the other one went so long.
Previous record posts in a thread:
Natural Gas 1-8-24
101 responses |
Started by metmike - Jan. 8, 2024, 2:59 p.m.
https://www.marketforum.com/forum/topic/101635/
++++++++++++
HERE'S THE LATEST WEATHER:
https://www.marketforum.com/forum/topic/83844/
+++++++++++++++++++++++
Feb 13, 2024
https://www.naturalgasintel.com/
+++++++++++++++
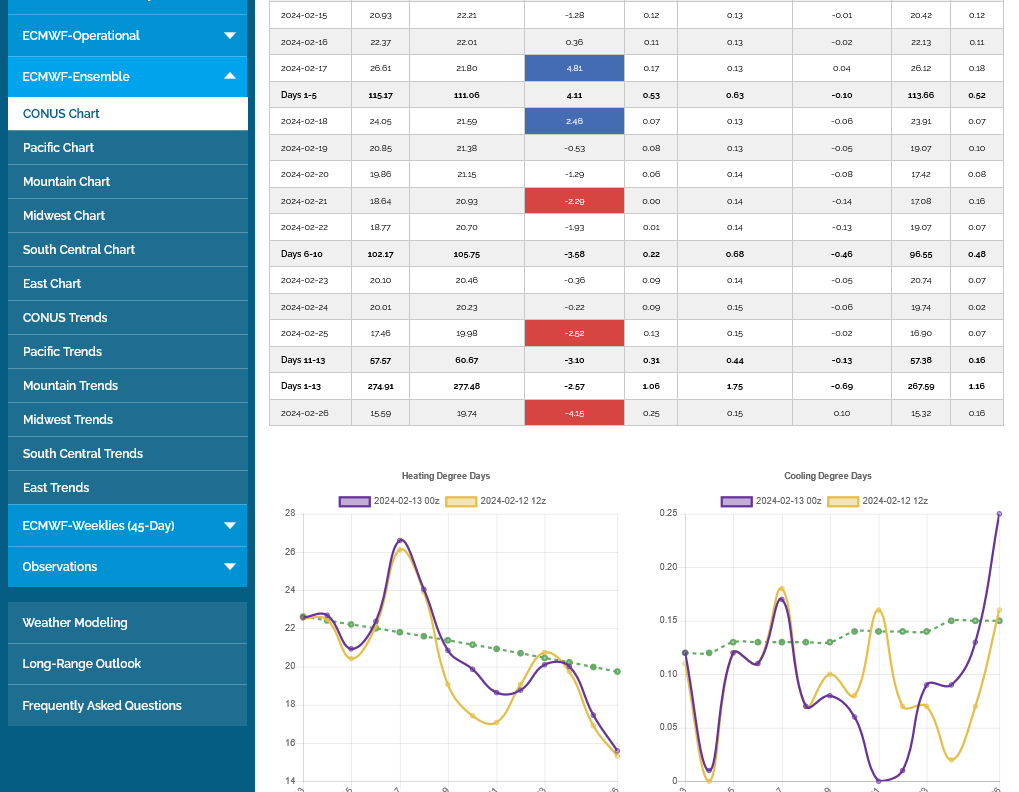
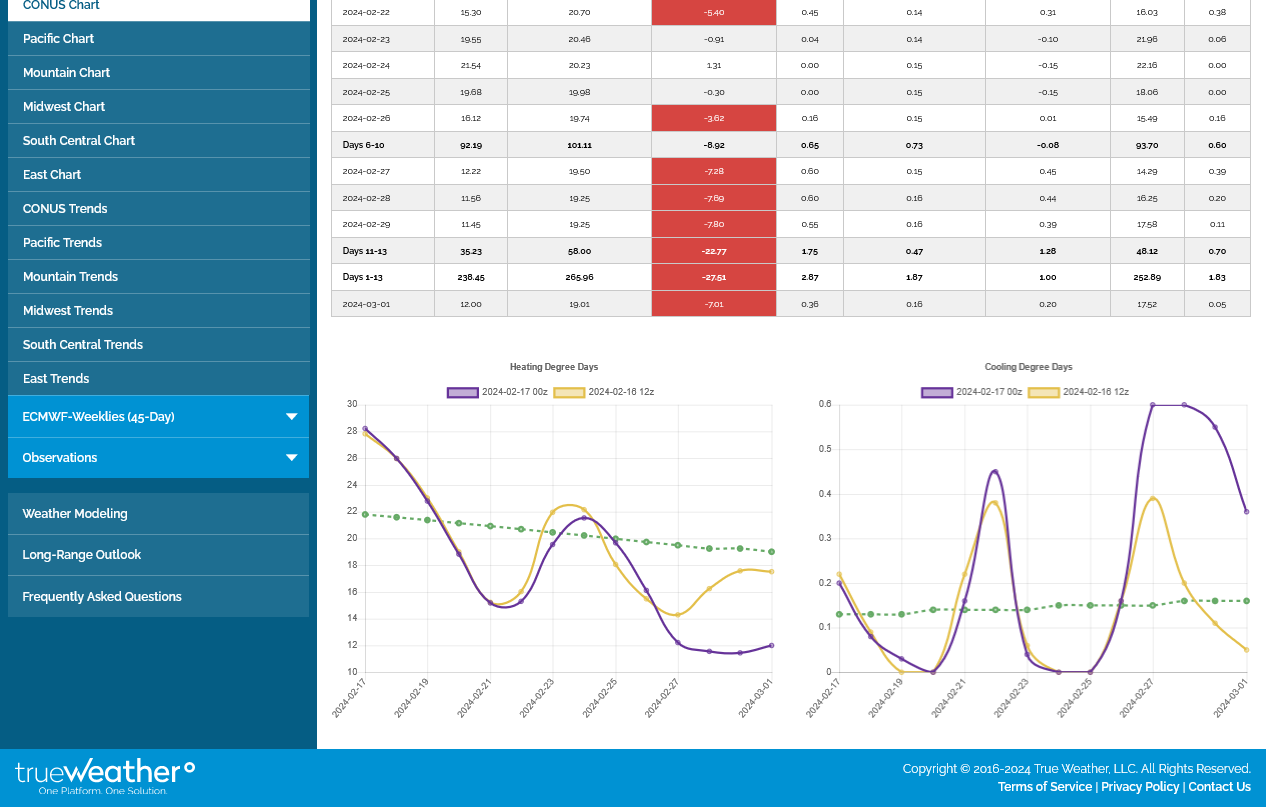
The last 0z European model was +7 HDDs overnight vs the previous one based mainly on 3 colder days in the middle of the forecast. It's the purple line on the graph on the left. Tan was the run from 12 hours earlier. Green is the slowly declining seasonally averaged HDDs.
As mentioned, storage is too high, it's too late in the season and the forecast is not cold enough nor does it feature a pattern change to significant cold(that would only stop the collapse not ignite an up move).
Bidens LNG export stunt is having a crushing psychology on top of the robust supplies that were anticipating an increase in future export demand. This is the time of year when we put in our typical V bottom low that often marks the lowest prices of the year for the front month. Yes, it takes place when inventories are also near their low point.
The EIA number released at 9:30 am tomorrow morning will be very bearish vs historical drawdowns in early February.
Near record warmth in the NorthCentral area with temperatures that actually went completely off the extreme right end of the color bar chart in the epi center of warmth(where not alot of people live).
So residential heating demand during that 7 day was minuscule compared to average for many places.
It was a bit chilly in FL and CA.
https://www.cpc.ncep.noaa.gov/products/tanal/temp_analyses.php+
+++++++++++++++++
It has been an incredibly warm February so far across the USA, with average temp anomalies pushing +20 deg F in the Upper Midwest/Northern Plains. Many areas are having their warmest ever Febs and near-term forecasts don't show signs of a widespread shift back to cold.
Never try to catch a falling knife in a market collapsing lower.........unless you have very powerful reason that defines something you know and the market doesn't!
And that knowledge will cost you a huge drawdown if the market doesn't catch on to that information right away.
And if you end up wrong and the market right, it often means massive losses.
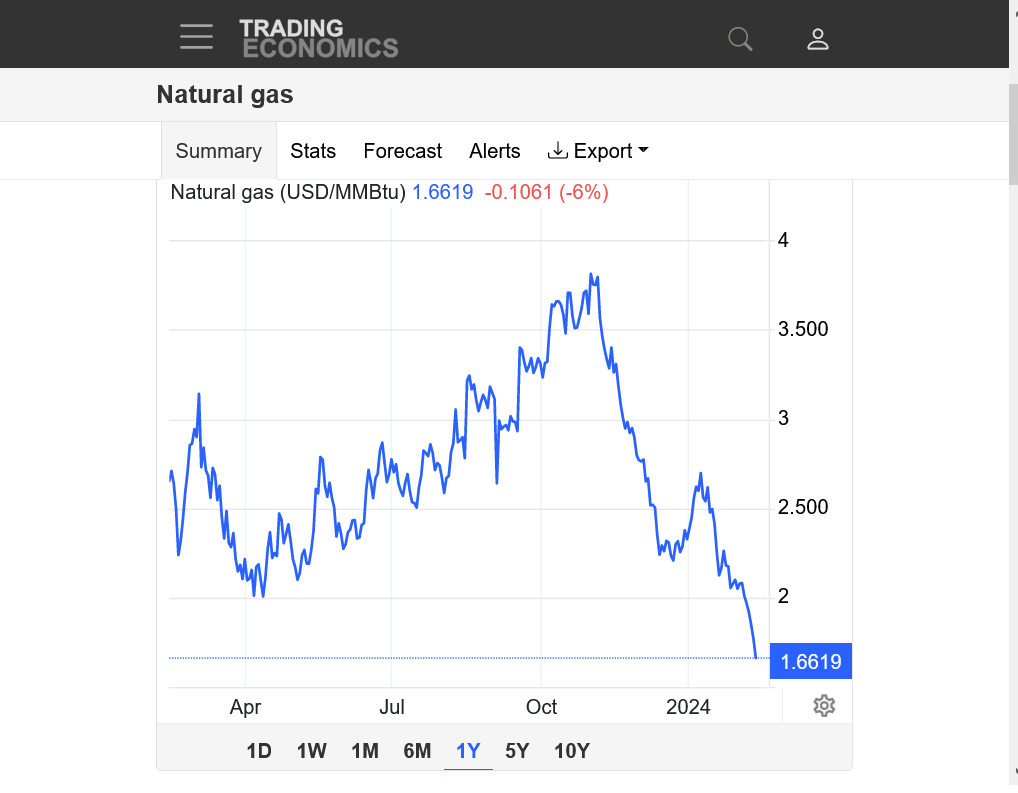
We're at some extremely low prices that likely won't last, approaching the 2020 spike low from demand destruction from COVID.
https://tradingeconomics.com/commodity/natural-gas
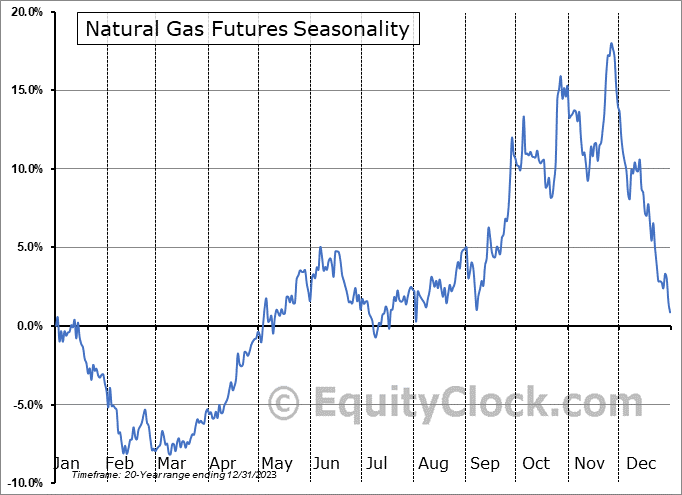
The Feb/March period is the one which features the most significant lows in the year. In 2023, with extremely bearish fundamentals and massive storage growth vs average that started in September 2022, that low didn't happen until the start of April.
https://charts.equityclock.com/natural-gas-futures-ng-seasonal-chart
+++++++++++++++++++++++++++++++++++
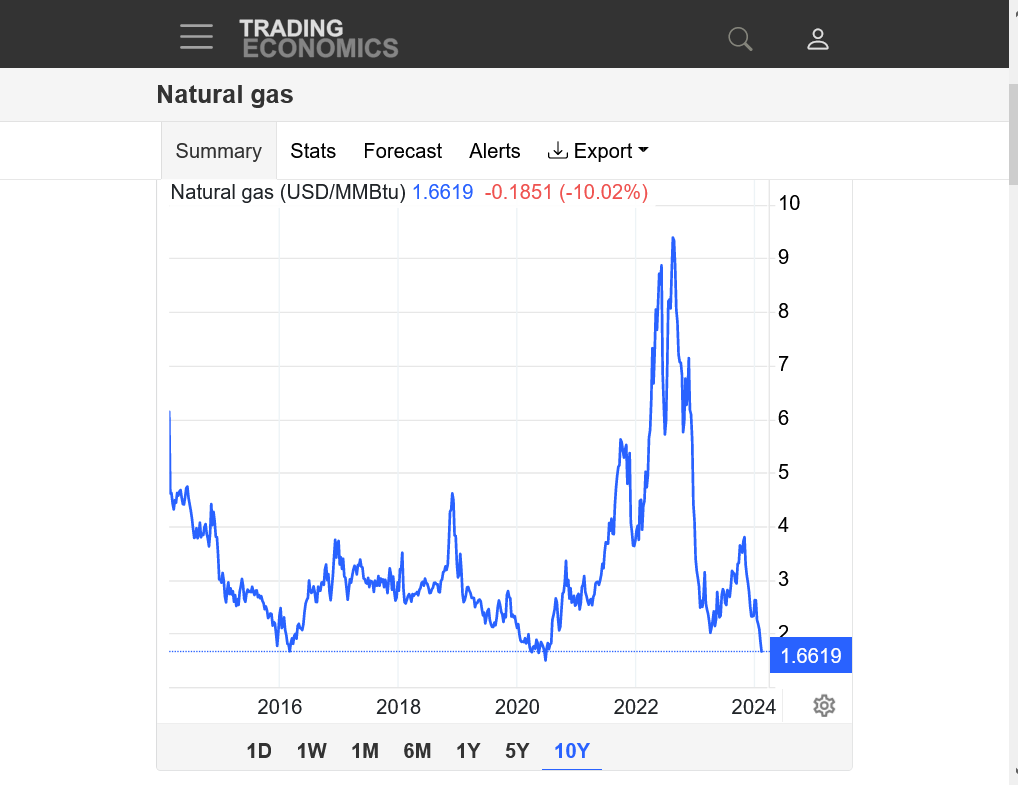
In 2020, because of demand destruction from COVID (piling on some other, already bearish factors) the low didn't happen until early Summer.

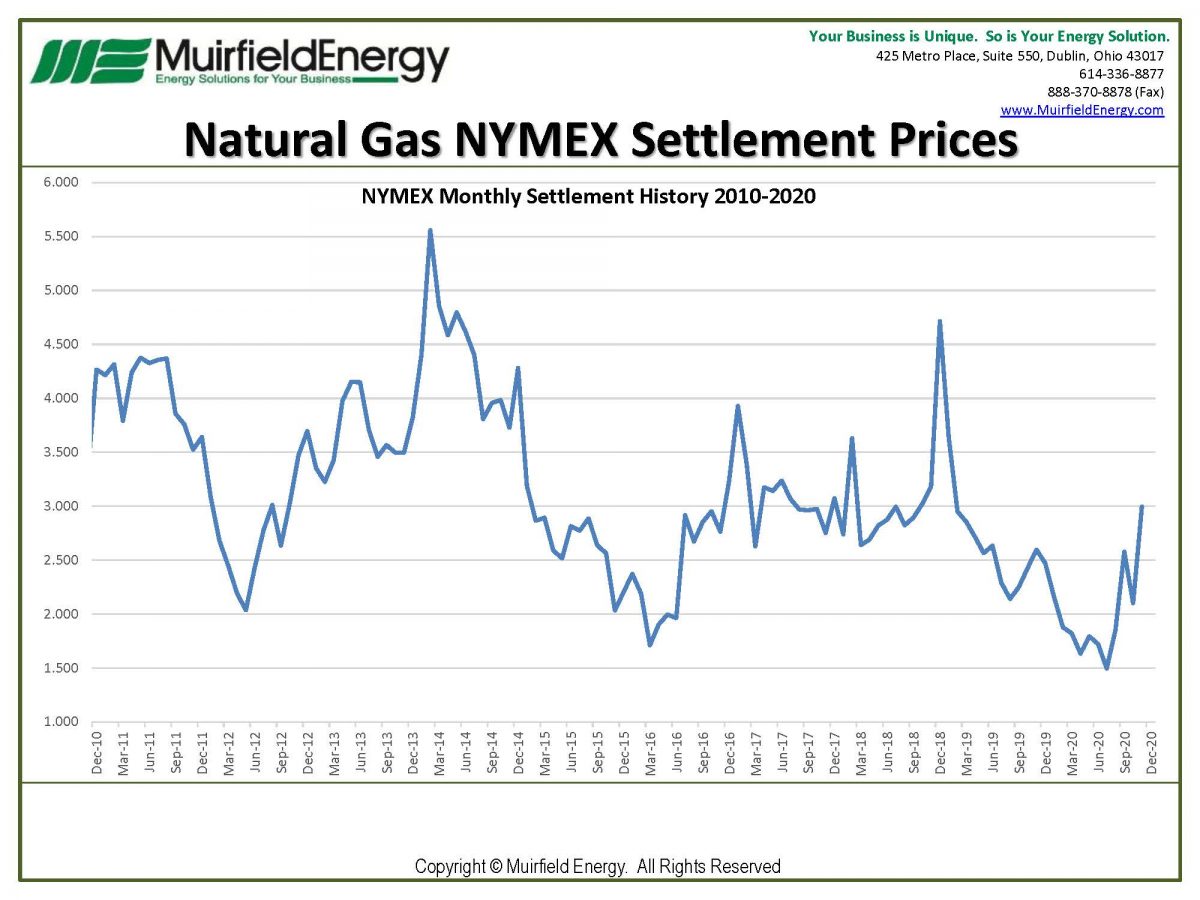
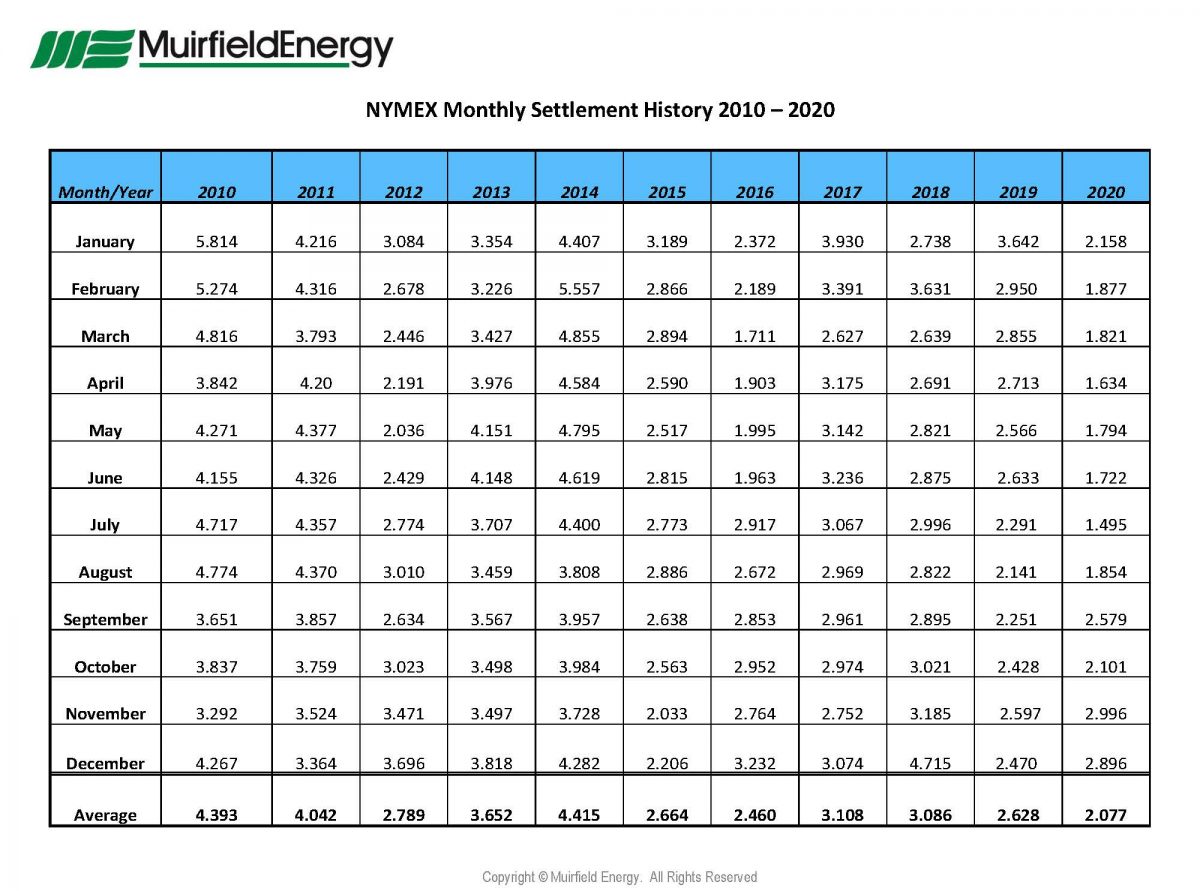
The bottom in 2020 was in July, several months later than the usual seasonal bottom, when the settlement dipped to 1.495, seen on the 2nd chart below.
The current price below $1.7 for the front month/March is the lowest since then and slightly below the late Winter, spike low in early 2016!
Other than that spike low in early Summer, 2020 these are the lowest natural gas prices for the front months in over 2 decades!
https://muirfieldenergy.com/news/natural-gas-futures-nymex-settlement-history-december-2020/
-4 HDDs for this last 12z European Ensemble. Which basically takes back the colder days from the previous run, although this time, the milder HDDs are spread out for the entire period. 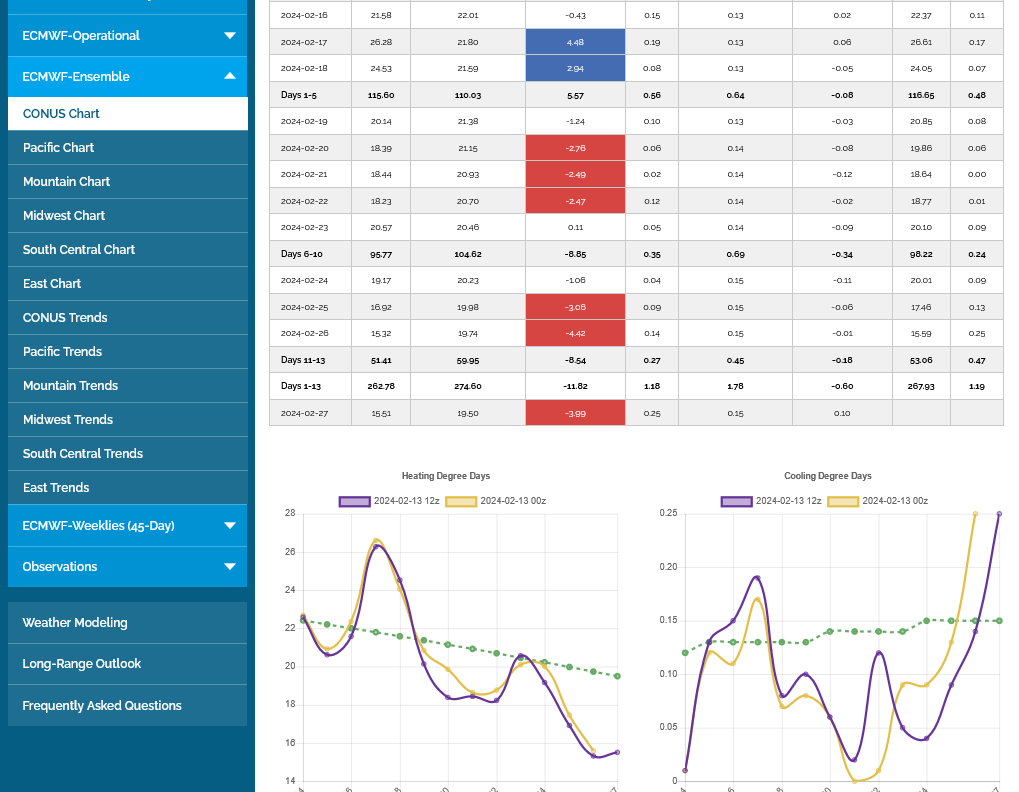
Weak weather-driven demand and robust production intersected this winter to depress natural gas prices, deflating market bulls. But lower heating costs contributed to falling inflation levels, saving consumers money and supporting expectations for continued economic growth in 2024. The U.S. Department of Labor said Tuesday its Consumer Price Index (CPI) increased at a rate of…
+++++++++
Overnight models lost even more HDDs!
-49 Bcf and bearish as expected. After the brief intrusion of frigid weather in January put us back inside the top end of the 5 year average for storage......we're back outside that and the highest ever on this date, late in the heating season. Note the blue line on the graph below.
![]()
https://ir.eia.gov/ngs/ngs.html
for week ending February 9, 2024 | Released: February 15, 2024 at 10:30 a.m. | Next Release: February 22, 2024
| Working gas in underground storage, Lower 48 states Summary text CSV JSN | |||||||||||||||||||||||||
|---|---|---|---|---|---|---|---|---|---|---|---|---|---|---|---|---|---|---|---|---|---|---|---|---|---|
| Historical Comparisons | |||||||||||||||||||||||||
| Stocks billion cubic feet (Bcf) | Year ago (02/09/23) | 5-year average (2019-23) | |||||||||||||||||||||||
| Region | 02/09/24 | 02/02/24 | net change | implied flow | Bcf | % change | Bcf | % change | |||||||||||||||||
| East | 536 | 568 | -32 | -32 | 502 | 6.8 | 490 | 9.4 | |||||||||||||||||
| Midwest | 662 | 689 | -27 | -27 | 607 | 9.1 | 581 | 13.9 | |||||||||||||||||
| Mountain | 178 | 183 | -5 | -5 | 115 | 54.8 | 118 | 50.8 | |||||||||||||||||
| Pacific | 222 | 228 | -6 | -6 | 122 | 82.0 | 181 | 22.7 | |||||||||||||||||
| South Central | 936 | 916 | 20 | 20 | 934 | 0.2 | 818 | 14.4 | |||||||||||||||||
| Salt | 271 | 257 | 14 | 14 | 263 | 3.0 | 240 | 12.9 | |||||||||||||||||
| Nonsalt | 665 | 659 | 6 | 6 | 671 | -0.9 | 578 | 15.1 | |||||||||||||||||
| Total | 2,535 | 2,584 | -49 | -49 | 2,280 | 11.2 | 2,187 | 15.9 | |||||||||||||||||
Totals may not equal sum of components because of independent rounding. | |||||||||||||||||||||||||
Working gas in storage was 2,535 Bcf as of Friday, February 9, 2024, according to EIA estimates. This represents a net decrease of 49 Bcf from the previous week. Stocks were 255 Bcf higher than last year at this time and 348 Bcf above the five-year average of 2,187 Bcf. At 2,535 Bcf, total working gas is above the five-year historical range.
For information on sampling error in this report, see Estimated Measures of Sampling Variability table below.

Note: The shaded area indicates the range between the historical minimum and maximum values for the weekly series from 2019 through 2023. The dashed vertical lines indicate current and year-ago weekly periods.
+++++++++++++++++++++++
Story of the day
March Natural Gas Futures Flatten Following Bearish Storage Print
The U.S. Energy Information Administration (EIA) on Thursday reported a withdrawal of 49 Bcf natural gas from storage for the week ended Feb. 9. The result was weaker than expectations and far shy of historical norms, briefly renewing pressure on Nymex natural gas futures before steadying into a sideways trade midmorning. Minutes ahead of the…
Not sure what's going on with the other NG thread. Wxfollower knows how this has happened before and its not from the thread being too long.
I've asked tech support to investigate.
https://www.marketforum.com/forum/topic/101635/
Hearing nothing back from tech support.
I tried to respond to your repeat question about why natural gas is NEVER going to 0 for the same reason that crude did. I gave a very complete answer in the thread that we are locked out of and added a couple more things.
Here it is again.
Crude oil went negative because of too much supply without a place to go on the day of expiration of the May 2020 contract(April 20, 2020).
Earlier in the year, Russia and Saudi Arabia had been in a price war with each of them ramping up global production.
COVID caused a massive drop in demand, so refineries shut down/reduced processing of crude into the products because of the huge demand loss in those products. This meant an equal loss of demand in crude that gets used to refine into those products. The problem was that crude supplies were still coming in, having been produced and loaded onto barges earlier in the year. Shutting down crude production had a lag of a couple of months compared to reducing refinery capacity that can be done like flipping a switch.
Opec's cut by a record 10 million barrels/day in early April took a few months to drop production/supplies down to match the drop in demand from COVID, with a massive, increasing amount of crude loaded on barges but not sold. Not sure how quickly the actual cuts would hit the market but definitely not soon enough.
Towards the end of April 2020, there was alot of crude floating around with no home to go and no buyers because of the refinery capacity plunging.
Almost every barge was loaded with crude and in fact, storing crude on a floating barge costs something like $350,000/day so they want to get rid of this crude ASAP and there are contract delivery dynamics which make it important to NOT be holding it on a barge past the front months expiration date or face enormous penalties/costs..........millions of dollars.
But there was no place to go with it. At the very end of the trading month, It was actually cheaper to PAY somebody to take the crude off their hands than to keep it and pay storage on a barge and penalties.
Added this for detailed clarity: So on that last day of trading for the May contract/front month, the desperate owners of the crude, floating on barges that were paying out the wazoo, needed to unload it or face massive penalties and costs that would have exceeded their paying somebody to take it.
So they had been trying to unload that crude, at already historically low prices headed towards expiration day but couldn't get rid of it because even that wasn't a low enough price to find buyers to match their selling price offer. They, like everybody else never thought crude would drop EVEN LOWER or else they would have dropped their offers low enough to get rid of the crude on any day BEFORE front month expiration(when they HAD TO GET OUT).
On the day of expiration, a massive amount of this crude was still unsold that had to be sold at whatever price they could get.........with nobody wanting to buy on expiration day because only traders intending to take delivery of crude should be long the front month after expiration(and spec shorts had already bought to cover all those positions).
So we had huge sellers and almost no buyers at every price that day. To find buyers to match the sellers in a market like that, the price must drop. It did drop. Still not enough buyers because nobody buys on expiration day. So it dropped more and more and more. Still no significant buyers were uncovered at much lower levels like every other time in history............when commercials and others in the refinery business would have stepped in and stole it because they CAN TAKE DELIVERY after expiration day but refinery capacity had dropped and they were already drowning in crude.
So the selling/asking price got to $0. In other words, you could get 1,000 barrels of oil(1 contract's worth) for free. In fact, you could get as many contracts as you wanted (1,000s of barrels of crude) for free BUT YOU HAD TO TAKE DELIVERY because if was the front month expiring so speculators WERE NOT INTERESTED.
Any trader long at expiration must have a place to put it because there's a good chance they will be forced to take delivery from the seller. The contract between the buyer and the seller is no longer just on paper. Expiration date means the buyer and the seller agreement on paper has run out and either you make the exchange OF THE PHYSICAL PRODUCT as agreed upon in the contract OR YOU PAY HUGE PENALTIES.
With ZERO speculators left and ZERO commercials/refiners with space to take delivery, even at a price of FREE/$0 with just hours left, large sellers running out of time to unload their crude had to drop their offers to a negative price to find any buyers. In other words, a buyer could get $1,000 barrels of crude oil for each contract AND GET PAID TO TAKE DELIVERY OF IT!
The problem was there wasn't anywhere for it to go. I will guess that as the price insanity continued lower, several large entities that could find storage space on barges or other places that would cost them money..........stepped in to take the crude off the hands of those that had to pay EVEN MORE for storage.
The next futures month, June with still a month of trading left was pulled lower by the May expiration spike lower but never traded below $20. That's because there was an almost unlimited pool of spec buyers willing to buy at that very low price, knowing they had another month to hold that long position before expiration of the June contract. There were probably some in the refinery business that might have additional storage opening up in the next month that could buy the June contract that cheap and make great money.
++++++++++++
The reason that can NEVER happen in natural gas for THAT reason is that the dynamic is completely different. The only time that natural gas storage will get full is near the end of the injection season late in the year, October at the earliest.
NG Prices are usually seasonally high at that point of the year because of market dynamics and would never be threatened of having a price collapse. Producers will usually throttle back production earlier in the year too, which is going to happen this year in response to these low prices stifling financial incentive.
Right now, we are seeing the typical seasonal low TIME FRAME but its being greatly amplified by several bearish fundamental forces(mild Winter and solid production continuing).
But storage is HITTING ITS LOW MARK FOR THE YEAR right now as it always does in the late Winter, early Spring time frame. Always as in 100% of the time, no exceptions. There is plenty of space to put natural gas right now because of enough cold weather heating demand to gobble up ALL OF IT. When it gets warm enough in the Spring, then we will start producing MORE than we use and the injection season starts but with storage at the lows for the year and tons of room for it.
There isn't going to be a bunch of natural gas that was produced with no place to go at this time of year. There are plenty of places that will gladly take it and PAY for it.
They might get it cheaper because of the seasonal bottom but the end users and storage facilities WILL PAY FOR IT. There will be no producers or storage facilities that are full of natural gas at this time of year.
Even with the mild Winter and highest amount in storage in history........STORAGE HAS ERODED ALL WINTER as shown on the graph below.
Storage peaked, as it usually does around the start of November.
https://www.marketforum.com/forum/topic/102248/#102306
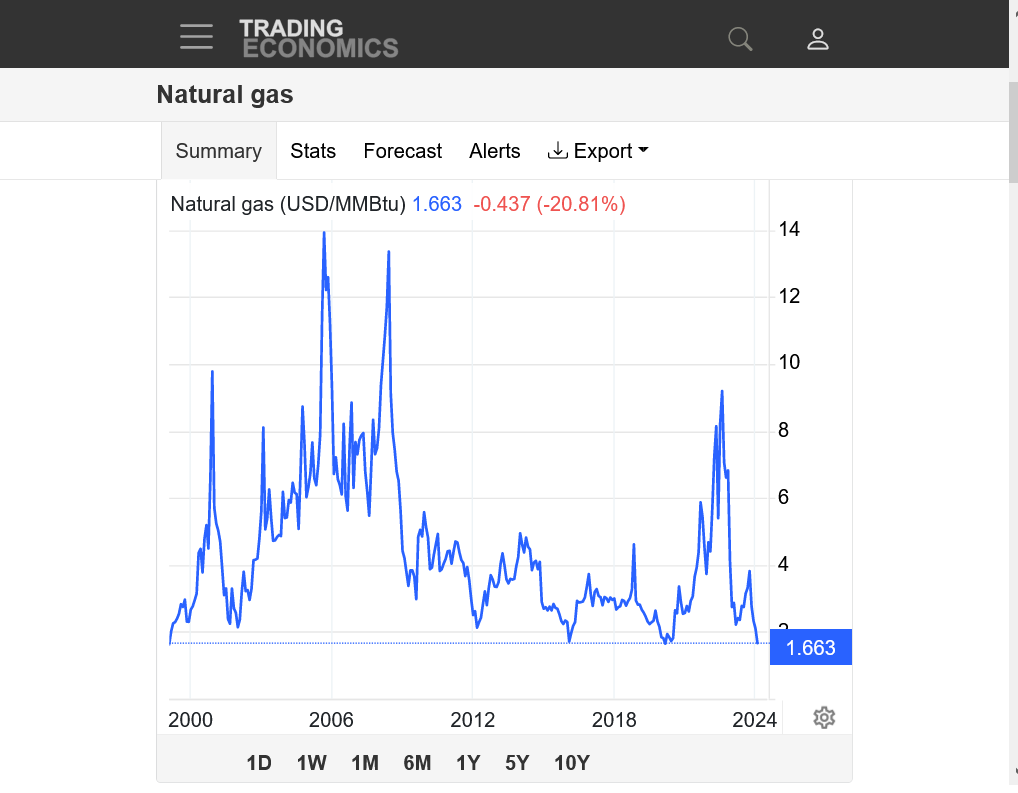
Every one of the bottoms on this 35 year graph was in Jan-Mar time frame, with last year's extended to the start of April.
Thats when supplies were LOW and the amount of space to put natural gas is the greatest.
https://tradingeconomics.com/commodity/natural-gas
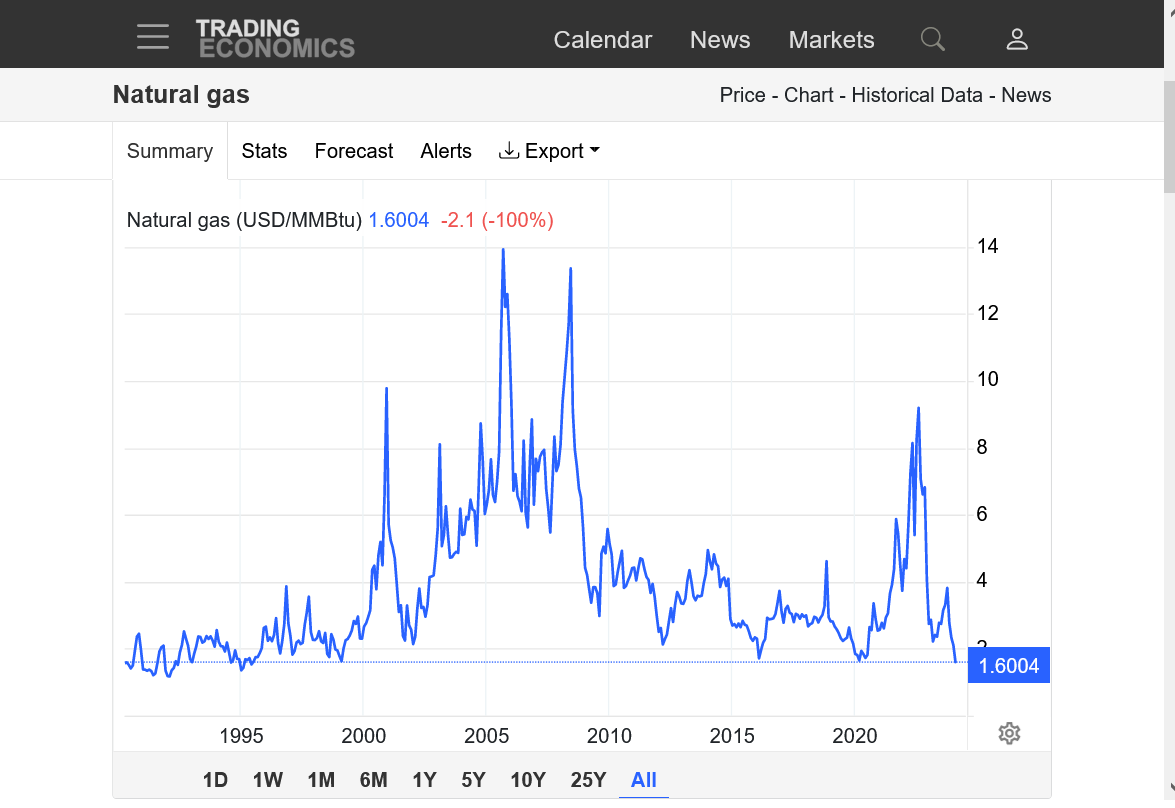
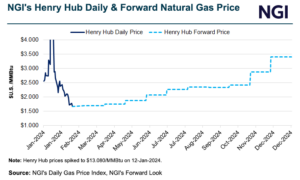
We're down around the 2016 COVID lows. Which should serve as strong support but there's things going on that I can't know about that could be having a big impact.
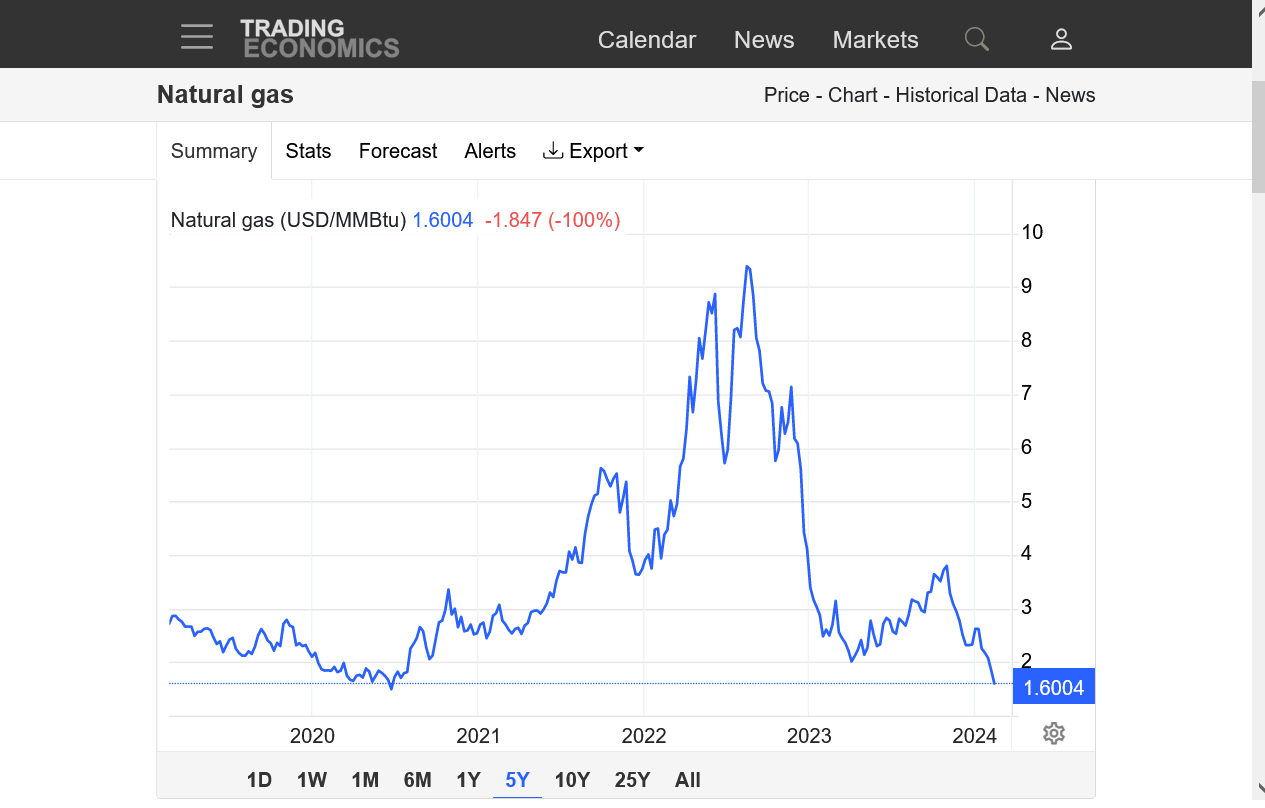
An amazing collapse in prices, which are not properly represented here.
In January, I believe the front month February spiked to just under 4.0. Since the previous thread has locked us out, I can't access key information about that. Not sure where the March was trading then but even this chart that doesn't show that indicates a $10,000/contract drop in around a month.
It may feel like we are going to 0 but I explained why it will not happen for the same reason that crude dropped below 0 because the dynamics are so totally different.

You can see the extremely strong seasonals that reflect that below. And where prices are when storage is getting full in Oct/Nov. At the highs of the year. No chance of a price spike below 0 in the Fall from storage getting too full.
Very weak seasonal prices and an early high? Yes. Even then, I would bet a ton of money that prices this October/November even if storage is jam packed will be MUCH higher than they are now, even though there will be tons of room for ALL the natural gas being produced for months to come.
https://charts.equityclock.com/natural-gas-futures-ng-seasonal-chart

From what I'm seeing the latest forecast all dropped HDD again.. is there any hope for the model showing more cold weather behind this in March? Or there's no indications yet of what that looks like.. otherwise despite the conditions of the market being oversold it looks like we could be lower again Sunday night
I added several new paragraphs on the explanation of crude dropping below $0 above for crystal clarity of the historical dynamics and a good understanding how commodity markets work. This was such an historical anomaly that giving it more posting space here is justified and I'm grateful that you brought it up again, cc.
https://www.marketforum.com/forum/topic/102248/#102344
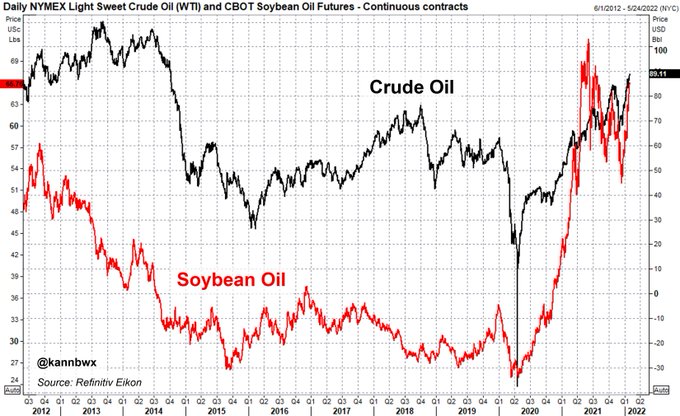
I purposely cut out the April 2020 crude debacle because it messes with the scale, making it harder to see the typical relationship.
But in the spirit of not erasing history, here it is in all its glory, -$40 spot crude on April 20, first ever negative oil price.
++++++++++++++++++++
Re: Re: Re: "SAFE HAVEN" COMMODITIES
By metmike - Oct. 16, 2023, 2:06 p.m.
With regards to crude oil as a safe haven, I have one word: COVID!
Early in the COVID pandemic, in the Spring of 2020 when the world was panicking and crude demand was collapsing from shut downs, crude spiked BELOW $0!!!
Recalling that day and historic event with live posting here is still fun to do.
https://www.marketforum.com/forum/topic/81406/#81649
Re: Re: Quote of the day-traders February
By metmike - Feb. 11, 2022, 1:19 a.m.
Thanks becker!
"The price of a commodity will never go to zero. When you invest in commodities futures, you are not buying a piece of paper that says you own an intangible of the company that can go bankrupt."
–Jim Rogers.
Never go to zero?
https://www.eia.gov/todayinenergy/detail.php?id=46336

Here was the historic thread at MarketForum with us watching and commenting live as crude crashed well below zero for the first and probably last time ever:
https://www.marketforum.com/forum/topic/50726/#50823
+++++++++++++++++++++++++++++++++++
By metmike - April 20, 2020, 1:34 p.m.
Hit $1.03.
Will we trade below $1??
Make that 1.02 for the low........so far. Watching to see if we can get below $1.
This is like the day last month, that UNL dropped below 38c
++++++++++++++++++++++++++++
By metmike - April 20, 2020, 1:54 p.m.
90c was the low so far.
Whoops..............we just hit 67c......52c.
Historic day for crude!
++++++++++++++++++++++++
By metmike - April 20, 2020, 1:57 p.m.
CLK hit 19c.
I can't imagine when it last traded that low........OMG it traded 1c!!!
Crude traded to 1 penny!!!! For real, that just happened.
Somebody bought and sold crude for 1 cent.
++++++++++++++++++++++++++++++
By TimNew - April 20, 2020, 1:58 p.m.
Pretty soon, they'll be paying us to fill our tanks.
++++++++++++++++++++++++
By Jim_M - April 20, 2020, 2:09 p.m.
IT WENT NEGATIVE!!
++++++++++++++++++++++++++++++
By metmike - April 20, 2020, 2:09 p.m.
Holy Cow...Holy Cow, Crude is trading negative!!!
The low has been -$1.43
++++++++++++++++++++
By metmike - April 20, 2020, 2:17 p.m.
OK, what planet are we on?
CLK has spiked to -$3.70.
This means that somebody can buy a contract of crude, get 1,000 barrels of oil AND get paid $6 for it..........last price
Make that -$7 on the last trade.
There is no place for it to go, so they are paying to get rid of it!
++++++++++++++++++++++++++++++++
By Jim_M - April 20, 2020, 2:24 p.m.
And that contract expires tomorrow correct? So there could be one more day of this bloodletting?
++++++++++++++++++++++++
By Jim_M - April 20, 2020, 2:29 p.m.
-$35.60!
+++++++++++++++++++++++++++++++
By metmike - April 20, 2020, 2:29 p.m.
We often see it the day BEFORE expiration.
Am thinking this is a squeeze. A bunch of traders caught long who are screaming uncle and panic selling or being forced out by massive margin calls with nobody wanting to buy the falling knife.
Crude is down $33 and is negative $14 -$14/barrel for the front month May.
Make that -$26........yeah this is a long squeeze, the opposite of a short squeeze that causes upward spikes from lack of supply.
Long squeezed almost never happen because when you have alot of supply, prices tend to be stable and not volatile.
-$37.........
-$40 down $56+ on the day
+++++++++++++++++++++++++++++++++
By Jim_M - April 20, 2020, 2:34 p.m.
Historic! We may never see anything like that again.
+++++++++++++++++++++++
By metmike - April 20, 2020, 2:38 p.m.
Looks like -$40.32 is going to be the low, since the main trading session with the huge funds that were trapped long is over.
Yes, we just bounced to $-28.00
Who ever thought that a +$12 bounce in crude.............normally in a bull market takes many days. would happen in a few minutes........and we would still be deeply negative.
Good chance that the lows are in.
The ones getting out when the price was in double digit negative territory were FORCED out with a squeeze. Forced liquidation from margin calls and other factors with expiration tomorrow.
++++++++++++++++++++++++++++++++
By metmike - April 20, 2020, 2:46 p.m.
Yes Jim. Traders that were watching this, will remember it forever.
Hopefully from the sidelines.
I really can't imagine normal speculators selling crude when it was negative.
The selling was an exhaustion/panic driven squeeze of the longs that HAD TO GET OUT no matter what.
Surely there were some big, high risk traders willing to buy and sell down here.
How many that deal in cash trades and actually have storage, bought crude today.............got paid $30,000 for 1,000 barrels and got the crude too?
That is like Twilight Zone trading (-:
+++++++++++++++++++++++++++++++++++++++++++
By TimNew - April 20, 2020, 3 p.m.
Before today, I honestly thought it could not go below 0.
++++++++++++++++++++++++++++++
By metmike - April 20, 2020, 3:05 p.m.
It looks like today may be the last trading day for CLK-the May, front month contract, not tomorrow as I suspected, so this makes more sense.
The new front month, June never traded below $20 and has bounced back to $21, down just $4 on the day.
cc,
Yes, the last 0z European model was a whopping -14 HDDs lower/bearish compared to the previous 12z run. Purple line on the left. Tan line was the run 12 hours earlier. Green line is the slowly dropping average as the temps slowing warm up in late Winter.
Seriously, at some point the intrinsic value of natural gas is going to overwhelm speculative selling and commercials/end users AND large specs that are longer term traders with deep pockets will decide to step in and not worry about "catching a falling knife" because they know that the price CANNOT STAY DOWN HERE for a long time.
There will always be some important non weather fundamental demand/supply dynamics that insiders know that I don't that drive the price, so in the absence of weather being the most important driver, I'm just a person with 3+ decades of following the markets, making observations and doing analysis that doesn't have the big insiders edge that I have when its a weather market.
With regards to the weather turning cold in March potential to turn the market around.
Every day that ticks by after mid Winter/January is a day with less potential for the weather to impact residential demand for heating, which is the greatest demand factor of the year.
Also, every day that ticks by with this price spiral lower is a day closer to the end of this unsustainable price spike lower.
It will likely be a V bottom formation, with yearly spike low bottoms almost always in the current time frame.....out to March(last year was late from bearish fundamentals on April 1, 2023).
We will know its happened when looking in the rear view mirror and all think "dang, wish I bought that when the price was collapsing" .
Maybe that's next week? Maybe it's not for another month?
With storage at a record high at this time of year(but still won't be full before October-no matter how bearish the fundamentals) we have a massive psychological bearish mentality which pervades at extreme lows as does bullish mentality at record highs.
One of the best ways to tell when the spike low is near is when the market will no longer react to bearish news by going lower to dial it into the price. This means that we've exhausted the pool of traders that will sell even MORE bearish news, no matter how bearish. Sometimes, the last ones selling are the spec longs holding on to a position, day after day that is tearing them up emotionally and they finally cry UNCLE.
There is no sign of cold, even looking in to early March so a selling exhaustion on bearish news looks to be more likely than a market bottoming because the weather news turned bullish.
However, a major change to colder in March, though being late in the heating season, with prices sooo oversold and low would likely trigger some big buyers, many just covering shorts, especially those that trade the very reliable seasonal price spike lower, realizing that that being short down here, at this time of year is carrying greater and greater risk. After we hit the spike low........ng could have a quick, technical knee jerk move up that gets alot of buying interest.
Problem is there is huge premium from April to may
Point is you might get several months of bottoming action . And once all these front months expire.. Boom.. Why must it be a v bottom..
I've been in that crowd before, holding on to a long with no exit strategy or limit too losses.
Long 100 contracts of beans and 200 corn(2+ decades ago) and trading very short term weather that was going to turn extremely hot with no rain in July(after very bearish June weather) but was a couple of days early. Margining out and the size of the position was so huge and with no stop and I was anticipating the market reacting like it always did to weather I saw first so that when it went the other way.........it became emotional torture for me to watch. Every tick lower, immediately calculating how much bigger and bigger the drawdown got. When the loss got above $200,000, I couldn't stand it anymore and realized that almost half my money was gone and in 2 days at this rate, I would be broke, out of a profession and no money to pay bills.........so I finally put a stop in at a price to make sure it would not take all that away.
It was as if the market was waiting for me to do this. Within an hour of that, we had a spike lower that took me out and IMMEDIATELY reversed up hard. The loss was -$256,000!
If the market kept going lower, I would be celebrating the salvaging of the rest of my money and living to trade another day.(I've had losses that were awesome trades because I got out fast before they became bigger losses). Preserving capital must always be priority #1.
Instead, the extremely oversold nature and huge weather pattern change(after the market caught on to what I saw 2 trading days earlier) meant the surge higher was as steep as the spike lower. After 2 days, I would have been +$100,000 and the weather pattern was getting even MORE bullish and I KNEW the price was still going MUCH higher but I couldn't get myself to buy again higher than where I sold near the lows because I was emotionally crippled. Would have been +500,000 by the end of the week. The following week, would have been +1 million..............if only I didn't put the stop in right at the spike lows!!!! For sure the worst 2 weeks of my trading life psychologically.
If I hadn't been long out the wazoo already and drowning in negative emotions from a -$200,000+ drawdown, I would have been loading the boat long with the exact same position at the exact same price that I just SOLD at. I SOLD 100 beans and 200 corn exactly at the lows of a big move lower!!!
One way that I often thought of it is .............."If I didn't have this position on right now and was free of the emotions that go with having it on, would I put it on at this price?"
That's not always a good way to trade when you are following a trend with a profitable position and trying to maximize the profits. A trailing stop, for instance is a good idea to lock in minimum profits while keeping the top side unlimited.
However, it a good way to try to take the emotions of fear, greed and wishful thinking out.
Instead, focusing every day on dialing in new fundamental and technical information and acting according to that by adjusting what you knew the day before. .........and most importantly, comparing the markets reaction to that based on the price charts.
cc,
There doesn't HAVE to be a price spike lower like is usually the case. It can be a rounded bottom or it can stay lower and trade sideways.
With regards to the premium from March onward, you're thinking with the wrong mentality for the vast majority of years.
The reason for the premium is that the market knows that prices almost always go higher in April-May. Those months ALWAYS bottom first. Bear spreading the Feb and March of over April and May is like 90% profitable in the time frame.
The Winter months have lost buying interest and still dropping but the Spring months have bottomed and are generating buying interest. The May or June contract is trading different dynamics...........refilling storage and strong upward seasonals. It's not trading what March did and doesn't care how low March was, as if that will be a magnet pulling it lower.
Thinking that March is cheaper and the good buy because May is higher priced is the opposite of what every trader that understands seasonal dynamics knows. In almost every year, the deferred contracts BOTTOM FIRST and the front month is the last to bottom. Forget the price.............think DIRECTION of the price.
Buying something cheaper than something else is great............but NOT when the cheaper item is going lower and the more expensive one is going higher and you are speculating on the DIRECTION of price.
You're letting the consumer mentality impact trading.
If you were buying a tv and you can get one for $500 or wait until May and have to pay $600, you want to buy it now for a better deal.
But if you were speculating on tvs and the March tv was gong to drop to $450 and the May tv was going to $650, which one would you speculate on to make money?
Every year is different for natural gas fundamentals and prices. I can't assure you that there will be a bottom in the next 45 days like there has been every year for over 2 decades.
Or that it will be a V bottom like it has been most of the time.
But it's not like flipping a coin with 50% chance of getting it right.
It would be like flipping a coin that landed on heads 90% of the time. It can still land on tails but you would use the statistics to guide you, along with other market factors to make smart decisions.
++++++++++++++
There's an outside chance that the economy is collapsing (would kill industrial demand) or there's some other black swan on the horizon with all the political chaos going on that you and me don't know about that savvy NG traders in the know do and are appreciating the risk. Not saying its true, just that if it was..............many of us might not have a clue right now.
If that did happen, then we could all think "the natural gas market predicted this!" and that might be true. I can tell this is a conversation with an extremely flustered long that wants bullish news but fears the worst.
Wishful thinking and fear are 2 emotions that, unfortunately parallelize our analytical minds and cause us to make decisions that are based on things that connect more with gambling than informed speculative trading.
I completely agree Mike . WHEN it bottoms that significant differential won't matter.. however it seems this year maybe a bit different.. And there's already further months trading below even 2.00. give me muscle be there The question is do we have as you said a sideways trade which would eradicate those premiums as we get closer to final trade.. And those differentials can eat away at your averages constantly
I've seen it in wheat over the past few months The premiums have been significant in every rollover And finally now the premium has completely evaporated in the may and July
Wheat dynamics, especially seasonals and demand/supply factors are totally different than NATURAL GAS.
Wheat has 2 narrow time frames when all the supplies are harvested and the market speculates about the crop size when it’s growing. Demand is fairly consistent but has some ups and down thru the year.
SUPPLY shocks from bad weather have the greatest potential to change prices.
NG has enormous residential demand from weather in the cold months then…..a lower demand peak in the hot months.
Supplies gush in all year but are exceeded in the cold months by demand.
DEMAND shocks from weather have the biggest potential to change prices In most years for natural gas. This extremely mild Winter is an example. The cold wave in January is another one.
Appreciate all your in-depth responses Mike.. My point was merely given all the fundamental overwhelming bearishness for natural gas that the normal low seasonal could push out till May and those months could retest the bottom causing deterioration in the premiums..
Nice and informative discussion.
Thanks for your insight.
Thanks for appreciating that.
This is the exact place to share it with like minded friends who understand commodities and would be as equally amazed at what happened to crude.
In thinking about this more today, there must have been some savvy crude traders that saw the open long interest that needed to be liquidated and knew there was no place for it to go for those holding long contracts and actually piled on the selling, or sold ahead of the collapse, realizing they could cover at will by buying it back anytime they wanted later on expiration day.
$1 price change in crude is worth $1,000/contract. 10c change in heating oil and unleaded is $420 if if I remember.
So a price range of $50 on that day would be $50,000/contract value change and $50 in 1 day was more than the entire range for most YEARS!
I was looking at the time stamps of our posts that day and the negative prices all happened in just the last 30 minutes or so before contract expiration.
Prices had already had an historic drop on The way to zero that day, which had market watchers following it. So that last 30 minutes resulted in several of us watching every trade/price change with much of the energy trading world and documenting it with comments.
Unleaded gas, if I remember had spiked to something like 38c when it expired a month earlier.
that happened from COVID shut downs and driving/demand collapse. That was actually the biggest factor that caused the crude spike lower a month later. Crude production output still much too high in March and April AFTER refineries had made major cutbacks.
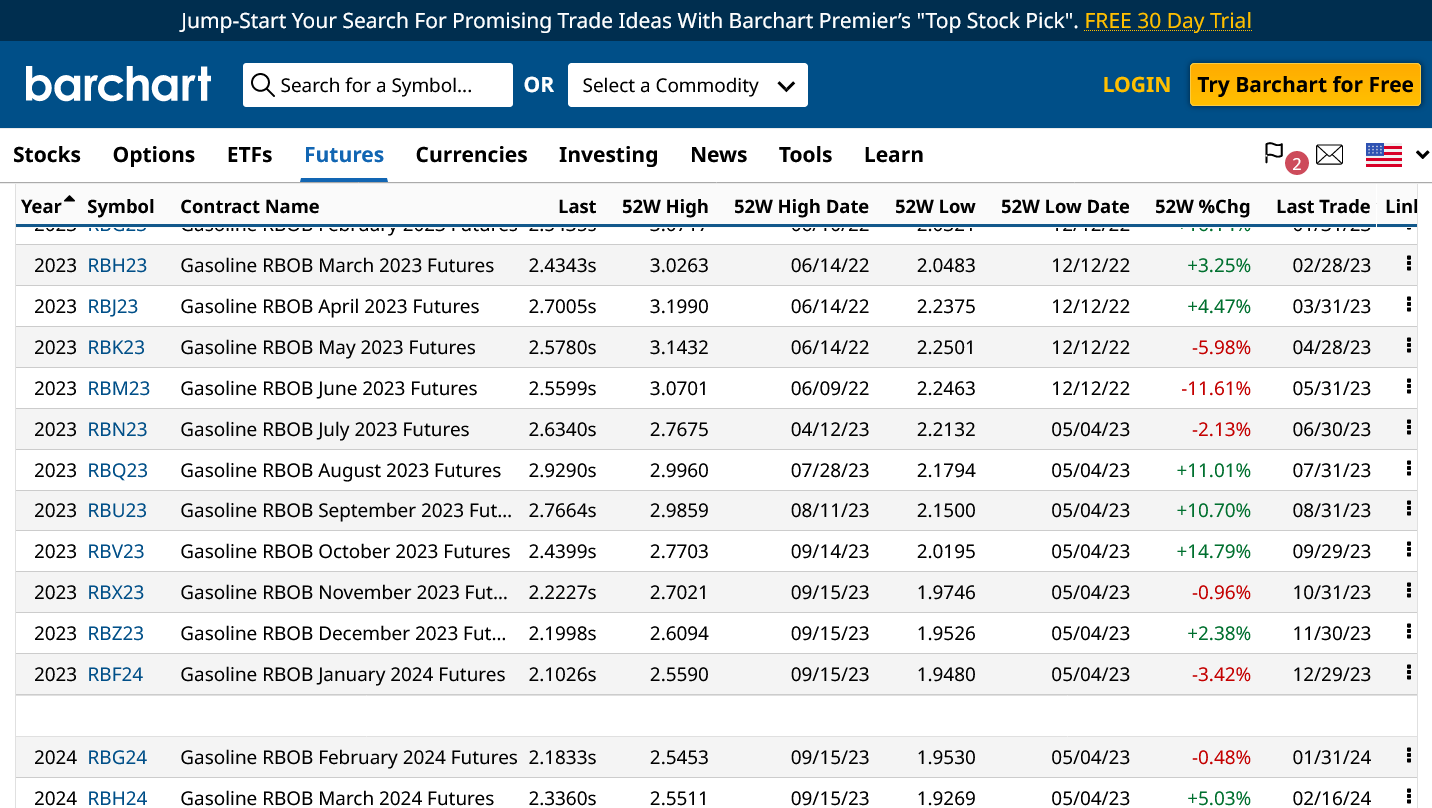
Since this is such a fascinating topic, I decided to go back to that time frame and find out more about the story with unleaded/RBOB going off the board not that far from 0. Memory told me it was 38c when the April contract expired at the end of March(the month before crude expired in negative territory).
These were the life of contract prices for RBOB for all the 2020 months. We can see that the April contract RBJ20 did hit 38c at the end of its life, shown under the 52 week low. We should also note how LOW gasoline prices were back then. COVID didn't start impacting our economy until early March(some places late February).
I remember this one vividly because we had a huge chess tournament the first Saturday of March in 2020 with 160 students and 320 adults crammed together for 6+ hours. It was like a massive petri dish for COVID (-: I was extremely concerned that all activities would be cancelled by the school corporation because the COVID news was just starting to hit the fan. Turns out that EVERYBODY showed up. 4 days later, the school corporation shut down the schools for the rest of the school.
Had our tournament been scheduled on March 14, AFTER everything was shut down, instead of March 7, just before the shut down..........I would have been stuck with $800 worth of trophies and had to find and refund 160 entry fees.
This is that same tournament this year, on March 2, 2024.
https://www.marketforum.com/forum/topic/101175/
++++++++++++++++++
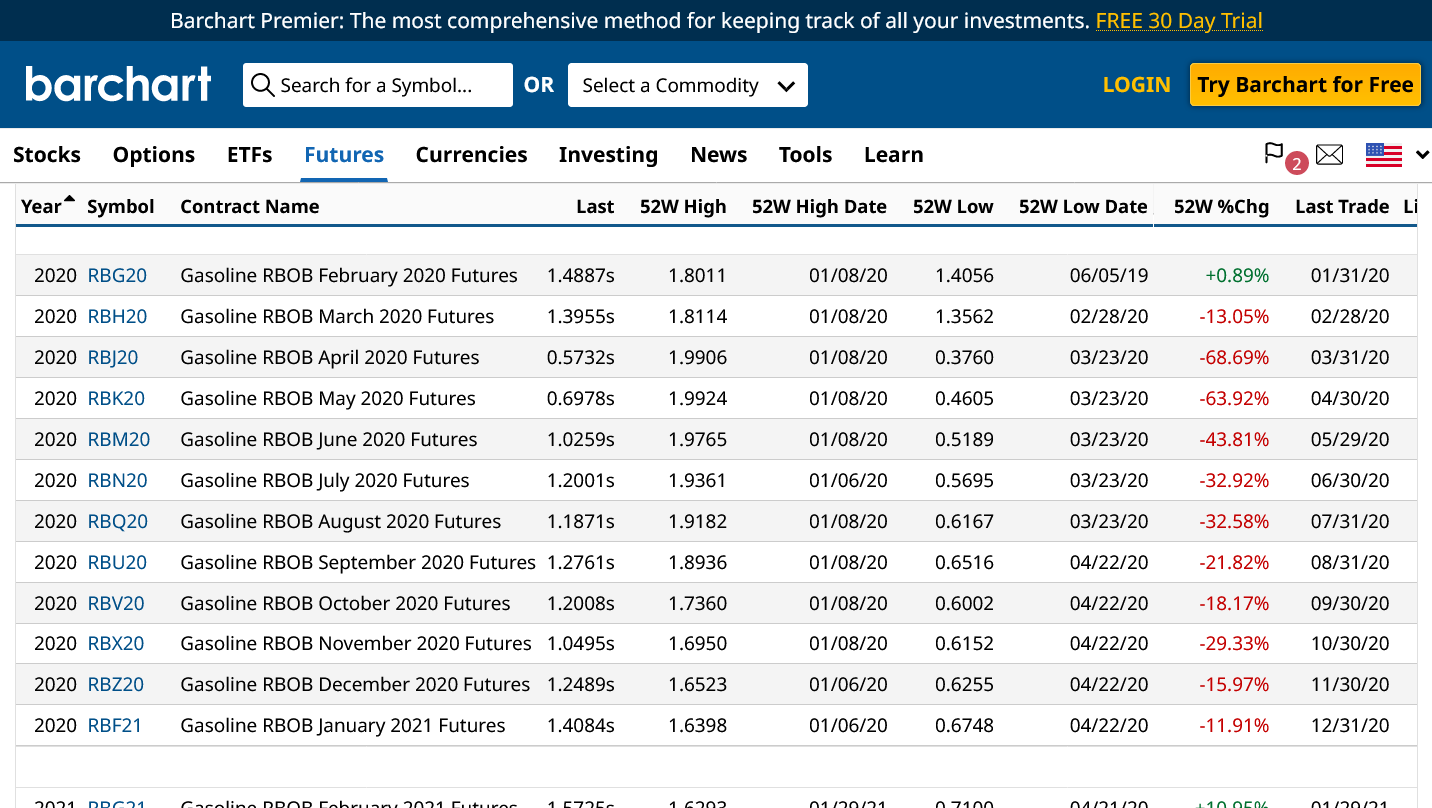
Compared to the 52W Low price for every month the rest of the year(below 70c) , which all happened when the April and May contracts were expiring, 38c was actually not that much lower. These are FUTURES contract prices, which are typically 60c to $1 lower than the price at the pump.
I remember the price dropping below $1 here briefly in late Spring? 2020. I had a 95% full tank, when the local Sams dropped to 98c and I knew from following the markets it wouldn't last, so I got just over 1 gallon to fill up and say that I bought gas for less than $1! That was the only week and station here to drop below $1. The state of KY, just across of the river had prices below $1 for numerous weeks.
You can go to that link to see historical prices and note that February 17. 1999 was the last time that several RB99 contracts traded LOWER than 38c. The year with the lowest prices was 1986, with a couple of months dropping to 30c for a short while(futures prices).
Also, compare it to any time frame, including the last year.
I remember the ACTUAL price at the pump being close to 30c in Detroit in the early 70's, shortly after I got a drivers license. 50 years later, it's almost 10X as high but compared to everything else going up and in today's dollars.........that's not that extreme:
USA domestic production will totally inhibit most rallies in the energy sector. The funds will SELL and crude will now be, ng already having been negatively impacted (remember I made 2000 when 10,000 was there for the offering), the selling commodity.
The DEMS will proclaim victory to the Nation as petro prices decline for the coming election--most sickening. (Good luck with tradein values on EV)
Sell all rallies.
Gap lower that hasn't been filled, though there was an attempt to do that just before 9am.
At this late stage in the game, hitting life of contract lows, seasonal lows due and bearish weather maximized for a week straight, the experienced trader would be looking at this gap lower as a POTENTIAL selling exhaustion gap based on the current psychology, demonstrated exactly by tjc's post(a guy that would always be looking to buy this extreme set up but even he has given up)
This is the frame of mind, where bulls completely give up and throw in the towel............giving the market one last big selling shot in the arm(a gap lower)........then there's nobody left to sell because everybody that was motivated to sell, has already sold.
And even more bearish news can't bring in more sellers.
The market, being unable to generate new shorts has to go higher and fill the gap lower.
Called a gap and crap selling exhaustion that couldn't hold.
I'm NOT saying thats what we have. Just explaining what it is and why it happens. The markets reaction down here will determine if that what we have.
We can still go much lower in this environment considering the negativity. We could fill the gap, then go back lower. Technical/chart formations only tell us about what the market is thinking at that time, which SOMETIMES predicts sea changes of mentality and at other times can just be short lived anomalies based trading algoriths of technical traders.
Absent a powerful weather pattern change, in a weather market, I don't have insider information that provides the edge to know BEFORE the market tells us.
Extremely low volume because of the holiday.
Extended weather looks mild as far as the maps go out into March.
We filled the gap now let’s see what happens.
Nothing so far because there's no catalyst for buying and they may grab on to the slightest catalyst but right now they have none
Funny thing is I wanted to buy wheat last night I think weed is forming a nice double bottom funds are all heavily short the grains.. But one bad thing leads to another this is the way it works
Here's a new thread for you to discuss wheat, cc:
https://www.marketforum.com/forum/topic/102414/
There has to some big news for wheat that doesn't appear to be US weather.
There was the news you were waiting for CHK reducing their recount significantly in the earnings report after the close
I was at chess practice but saw the price chart afterwards and recognized the NEWS RELEASE signature on the price chart that took off like a rocket just after 3pm.
Up $1,000/contract in 10 minutes. That's something impossible for me to trade.
We have a solid gap and crap selling exhaustion technical formation on the charts as mentioned at the end of long lived downtrend with life of contract lows and the timing being when a seasonal low typically happens.
Buying yesterday required minimal risk to new lows for the move.
The spike higher means buying here risks $2,000 to new lows.
There's no assurance that this wasn't just a temporary knee jerk reaction that WAS NOT the trigger for the sea change in mentality that seals in the bottom for the reasons mentioned earlier.
The last 12z runs were NOT less bearish, so weather is NOT a factor here. At least not today.
I would agree that this is just a rollover squeeze on some news that was expected production cuts.. I'm still swimming unfortunately I did not add to my position and lightened up a bit..
This may be more than just shorts getting out before expiration.
Rhe weather is still bearish but the market couldn’t go lower on more bearish weather news.
That suggests the selling has been exhausted.
No amount of bearish weather will cause the same impact it did previously this Winter.
funds often wait till teh old 9 am time so they drive it up and liquidate ...then it goes back to see whether its passing these levels
![]()
metmike: -60 Bcf was extremely wimpy for this time of the year but MOSTLY expected(though this was bearish vs estimates) and dialed in by the huge drop in prices when the weather for that period was starting to show up on forecast models in late January. The mild weather today, was traded and dialed in earlier in February.
Note: The upside deviation between the historical range in storage and where we are in 2024(blue line below) increased to the greatest ever for this week.........which is why we have the lowest price in 2 decades.........with the exception of 2020 because of COVID.
https://ir.eia.gov/ngs/ngs.html
for week ending February 16, 2024 | Released: February 22, 2024 at 10:30 a.m. | Next Release: February 29, 2024
| Working gas in underground storage, Lower 48 states Summary text CSV JSN | |||||||||||||||||||||||||
|---|---|---|---|---|---|---|---|---|---|---|---|---|---|---|---|---|---|---|---|---|---|---|---|---|---|
| Historical Comparisons | |||||||||||||||||||||||||
| Stocks billion cubic feet (Bcf) | Year ago (02/16/23) | 5-year average (2019-23) | |||||||||||||||||||||||
| Region | 02/16/24 | 02/09/24 | net change | implied flow | Bcf | % change | Bcf | % change | |||||||||||||||||
| East | 505 | 532 | R | -27 | -27 | 482 | 4.8 | 449 | 12.5 | ||||||||||||||||
| Midwest | 631 | 662 | -31 | -31 | 579 | 9.0 | 528 | 19.5 | |||||||||||||||||
| Mountain | 173 | 178 | -5 | -5 | 107 | 61.7 | 109 | 58.7 | |||||||||||||||||
| Pacific | 217 | 222 | -5 | -5 | 110 | 97.3 | 170 | 27.6 | |||||||||||||||||
| South Central | 944 | 936 | 8 | 8 | 927 | 1.8 | 764 | 23.6 | |||||||||||||||||
| Salt | 278 | 271 | 7 | 7 | 262 | 6.1 | 218 | 27.5 | |||||||||||||||||
| Nonsalt | 666 | 665 | 1 | 1 | 665 | 0.2 | 546 | 22.0 | |||||||||||||||||
| Total | 2,470 | 2,530 | R | -60 | -60 | 2,205 | 12.0 | 2,019 | 22.3 | ||||||||||||||||
| R=Revised. The reported revision caused the stocks for February 09, 2024 to change from 2,535 Bcf to 2,530 Bcf. As a result, the implied net change between the weeks ending February 02 and February 09 changed from -49 Bcf to -54 Bcf. Totals may not equal sum of components because of independent rounding. | |||||||||||||||||||||||||
Working gas in storage was 2,470 Bcf as of Friday, February 16, 2024, according to EIA estimates. This represents a net decrease of 60 Bcf from the previous week. Stocks were 265 Bcf higher than last year at this time and 451 Bcf above the five-year average of 2,019 Bcf. At 2,470 Bcf, total working gas is above the five-year historical range.
For information on sampling error in this report, see Estimated Measures of Sampling Variability table below.
Note: The shaded area indicates the range between the historical minimum and maximum values for the weekly series from 2019 through 2023. The dashed vertical lines indicate current and year-ago weekly periods.
+++++++++++++++
The market was already down modestly before the release and has been staying below the pre release price but unable to add to losses below the 9:54 am lows for the session.
We closed well off the lows and ABOVE the price level when the bearish EIA report came out.
Bearish news........market NOT able to stay below the price we were trading at when the bearish news came out.
I'm not surprised that we return back down.. I did think it was just rollover action ultimately this will be a longer bottoming process than just a spike and v
I'm not surprised that we return back down.. I did think it was just rollover action ultimately this will be a longer bottoming process than just a spike and v
Thanks, cc.
The April contract has 4 times the volume of March. 107 K vs 28K.
March expires early next week.
April is actually down a bit MORE THAN March.
That could actually be from cash prices not being this low??
+++++++++++
The dead cat bounce earlier this week, in retrospect looks like it was mostly from a news related, very short term spike higher ($1,000/contract in 10 minutes) in an extremely oversold market that couldn't hold when the big picture dynamics resumed.
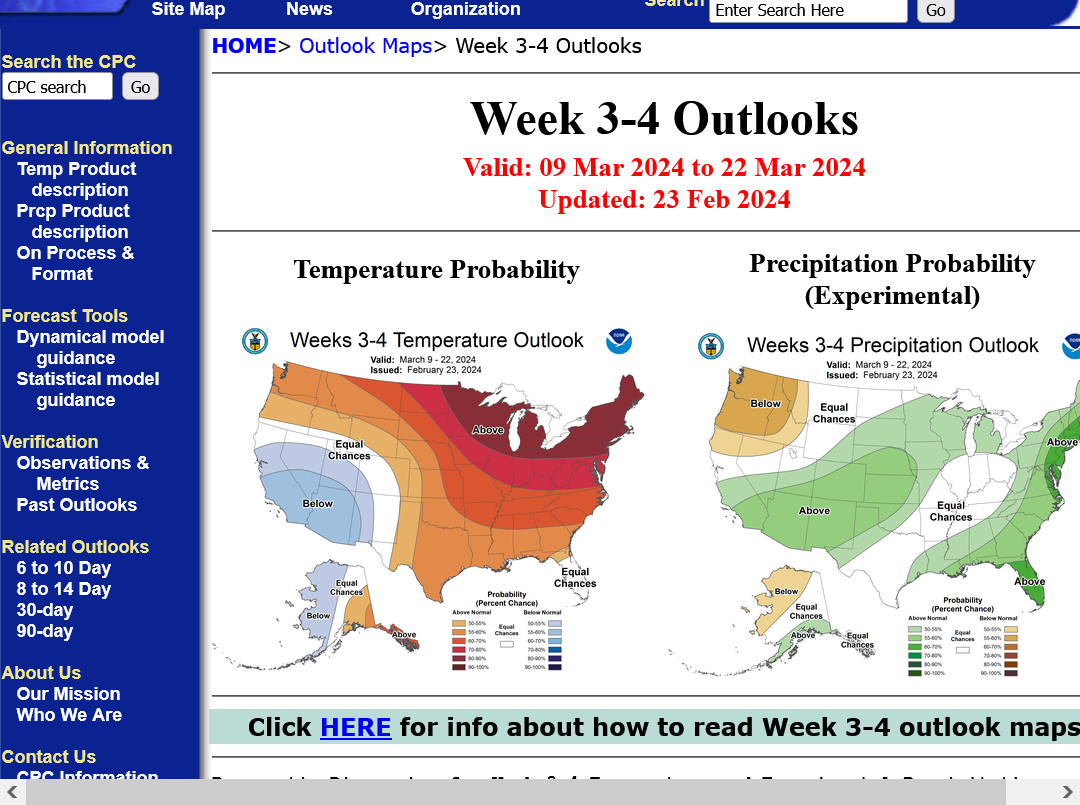
Updated every Friday afternoon. Pretty bearish but we're talking MARCH weather with 85%+ of the HDDs for the Winter behind us.
https://www.cpc.ncep.noaa.gov/products/predictions/WK34/