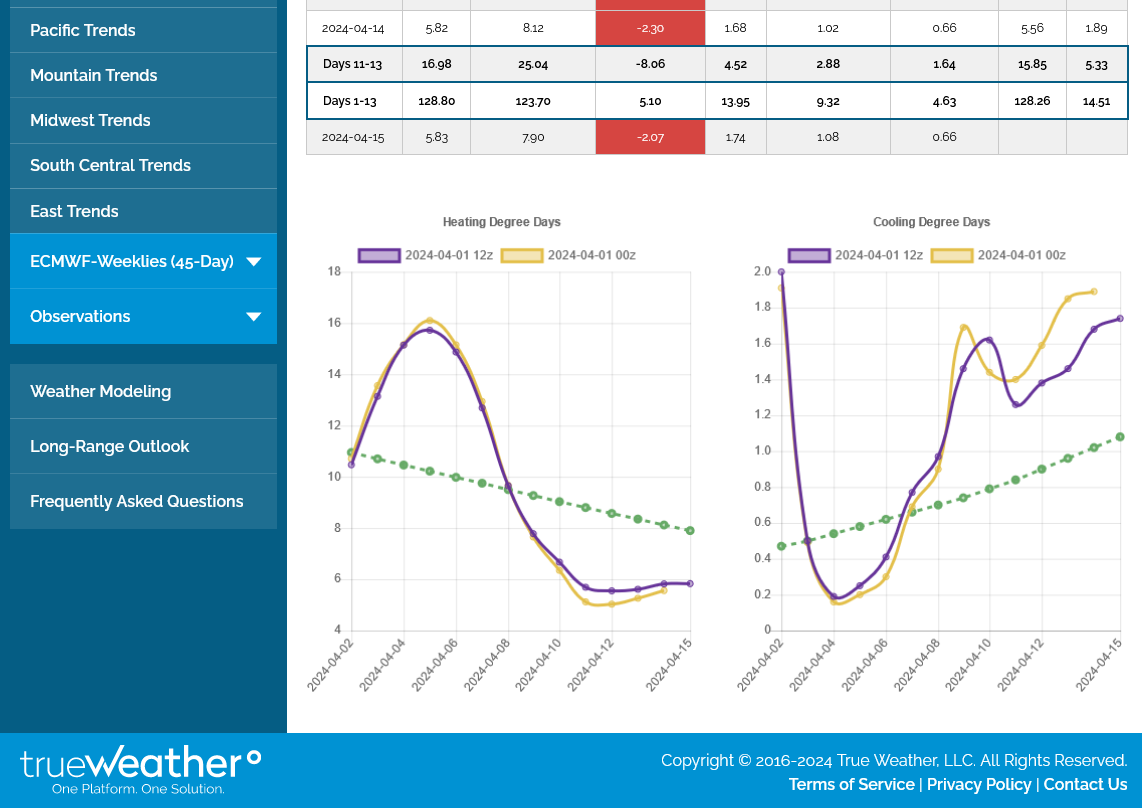
Look at the blue line on the graph below. Storage continues to be mega bearish. Highest ever for this time of year in history.
Interesting note: We constantly here about the climate crisis causing everything bad and nothing good. It hurts all good forms of life but somehow the exact same conditions........are perfect for all bad forms of life. Every time we have extreme weather from natural variation(even extreme cold) somehow, climate change played a role.(the truth is that this is a an authentic, scientific climate optimum for MOST life).
The truth is, we basically superimposed 2 deg. F of warming on the planet and MOST of that is in the coldest places, during the coldest times of year. Same weather systems/meteorology. Same laws of physics. Same natural variations........just 2 deg. F less cold in the coldest places and +125 parts per million of beneficial CO2(the building block for all life), that's still only half the optimal level of CO2 for most life.
Why am I bringing it up in this post?
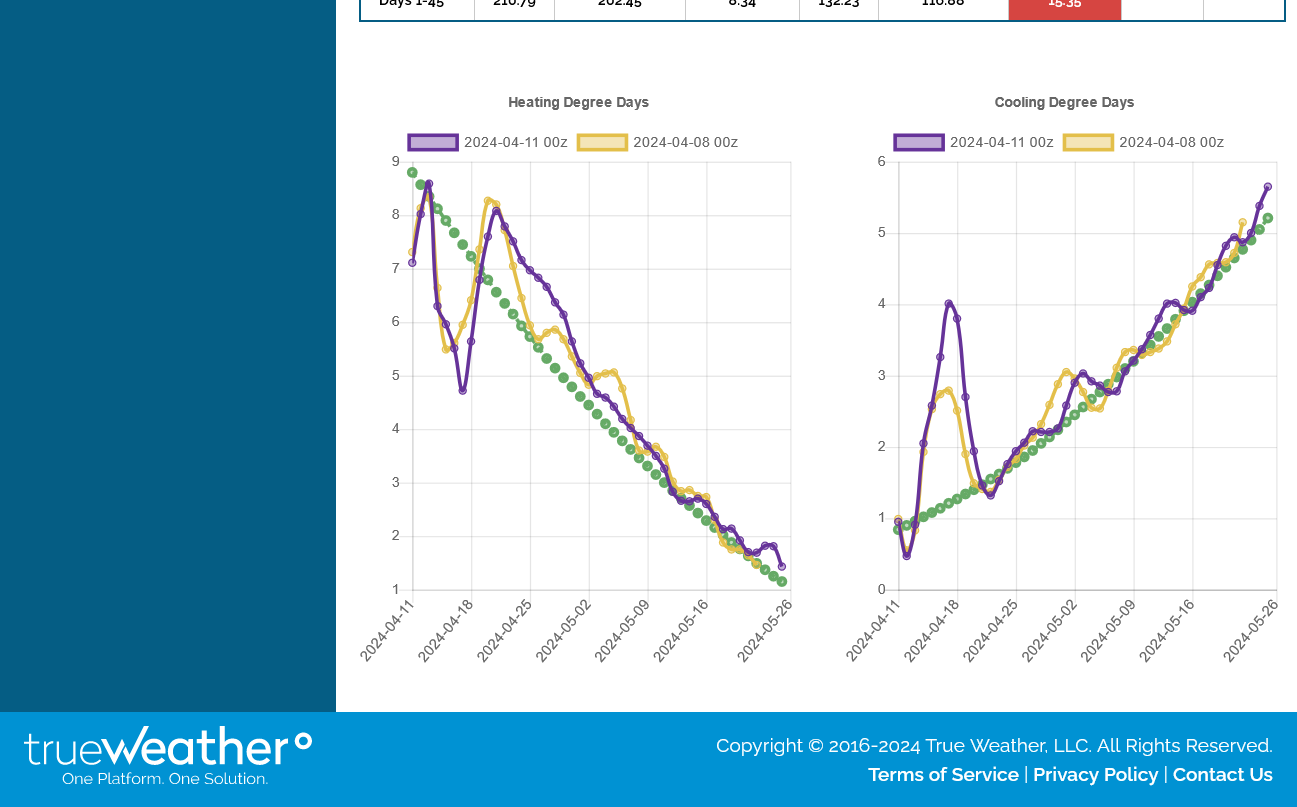
One of the most profound REAL impacts from climate change that the media and others should be shouting out about if they were honest and objective would be the amount of natural gas in storage right now at the end of the mildest United States Winter in history.
How is this not a wonderful benefit? If this were the hottest Summer in history, we would have heard/read about it every hour of every day.
Because of this, a key energy source that we use to heat/cool our homes and generate electricity is the highest ever in storage and much of this is because we had a mild Winter.
Now consumers will have low natural prices and lower energy bills.
Now there will be less inflation from the utility energy sector.
Now we are covered by a massive energy security blanket for much of 2024.
We would NEVER want to attribute such a positive thing to a climate crisis.
Again, only part of that was caused by climate change and most of it from natural variation but the part from climate change WAS BENEFICIAL to ALL consumers and everybody that doesn't make money from higher prices. You will NEVER see that objective truth anywhere..............but here!

‹ See All Natural Gas Reports
Weekly Natural Gas Storage Report
for week ending March 29, 2024 | Released: April 4, 2024 at 10:30 a.m. | Next Release: April 11, 2024
| Working gas in underground storage, Lower 48 states Summary text
CSV
JSN |
|---|
| | | Historical Comparisons |
Stocks
billion cubic feet (Bcf) | | Year ago
(03/29/23) | 5-year average
(2019-23) |
| Region | 03/29/24 | 03/22/24 | net change | implied flow | | Bcf | % change | Bcf | % change |
| East | 363 | | | 387 | | | -24 | | | -24 | | | | 337 | | | 7.7 | | | 298 | | | 21.8 | | |
| Midwest | 510 | | | 528 | | | -18 | | | -18 | | | | 426 | | | 19.7 | | | 369 | | | 38.2 | | |
| Mountain | 162 | | | 166 | | | -4 | | | -4 | | | | 81 | | | 100.0 | | | 88 | | | 84.1 | | |
| Pacific | 227 | | | 223 | | | 4 | | | 4 | | | | 73 | | | 211.0 | | | 149 | | | 52.3 | | |
| South Central | 996 | | | 991 | | | 5 | | | 5 | | | | 920 | | | 8.3 | | | 723 | | | 37.8 | | |
| Salt | 294 | | | 294 | | | 0 | | | 0 | | | | 263 | | | 11.8 | | | 216 | | | 36.1 | | |
| Nonsalt | 701 | | | 698 | | | 3 | | | 3 | | | | 657 | | | 6.7 | | | 507 | | | 38.3 | | |
| Total | 2,259 | | | 2,296 | | | -37 | | | -37 | | | | 1,837 | | | 23.0 | | | 1,626 | | | 38.9 | | |
Totals may not equal sum of components because of independent rounding.
|
Summary
Working gas in storage was 2,259 Bcf as of Friday, March 29, 2024, according to EIA estimates. This represents a net decrease of 37 Bcf from the previous week. Stocks were 422 Bcf higher than last year at this time and 633 Bcf above the five-year average of 1,626 Bcf. At 2,259 Bcf, total working gas is above the five-year historical range.
For information on sampling error in this report, see Estimated Measures of Sampling Variability table below.

Note: The shaded area indicates the range between the historical minimum and maximum values for the weekly series from 2019 through 2023. The dashed vertical lines indicate current and year-ago weekly periods.
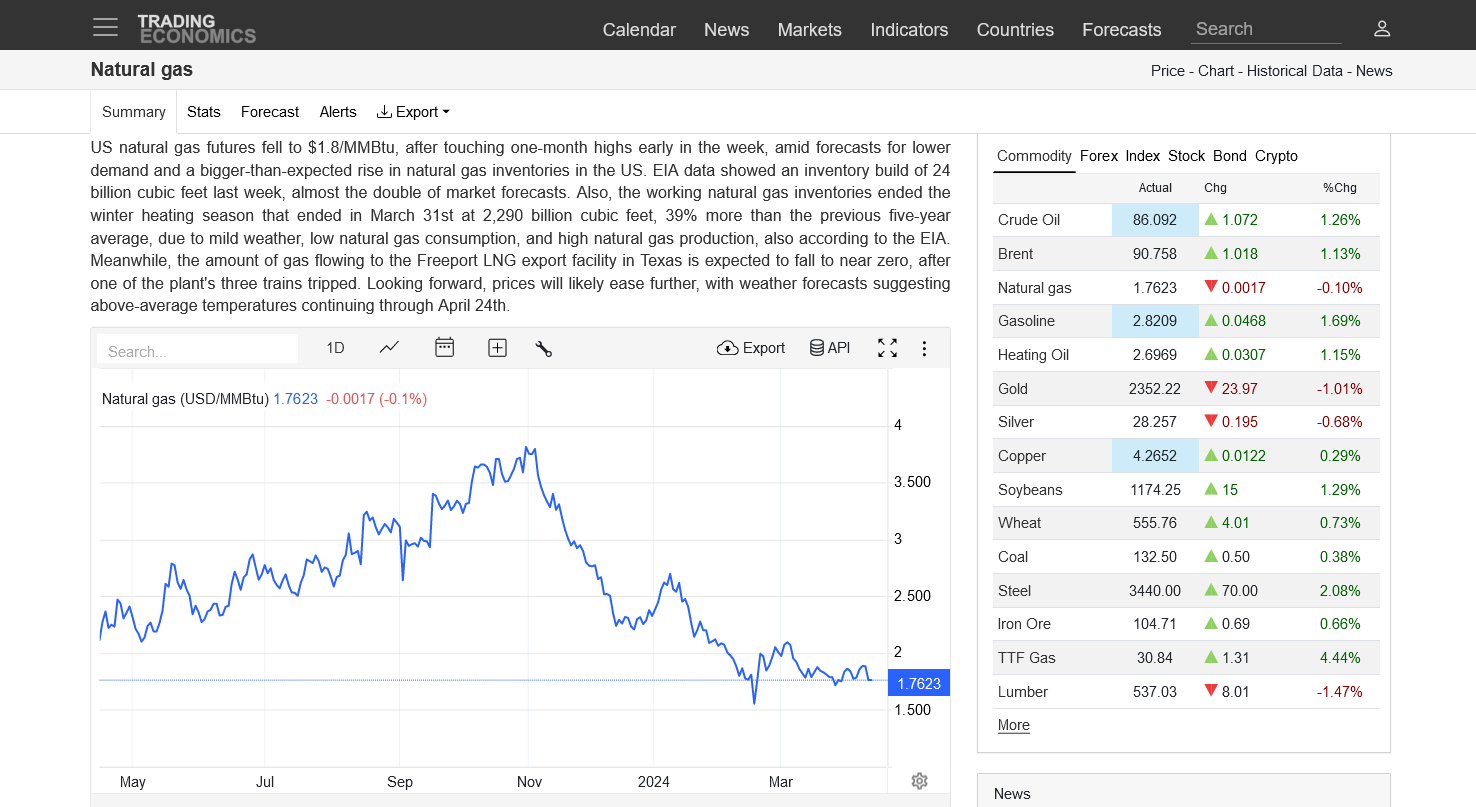
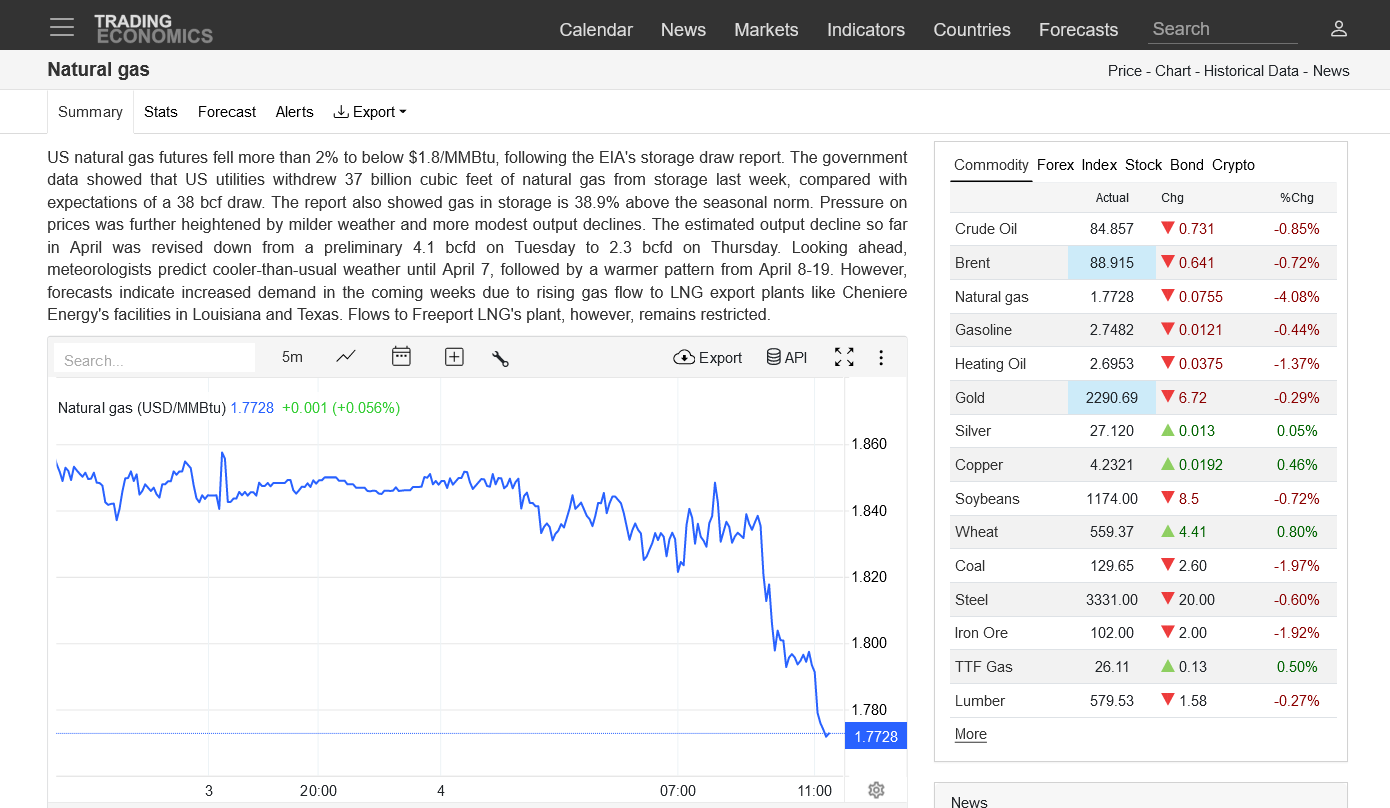
The U.S. Energy Information Administration (EIA) on Thursday reported a withdrawal of 37 Bcf natural gas from storage for the week ended March 29. The result fell just shy of expectations and, with inventories still plump and injections on the horizon, left Nymex natural gas futures under pressure. Ahead of the 10:30 a.m. ET government…
+++++++++++++
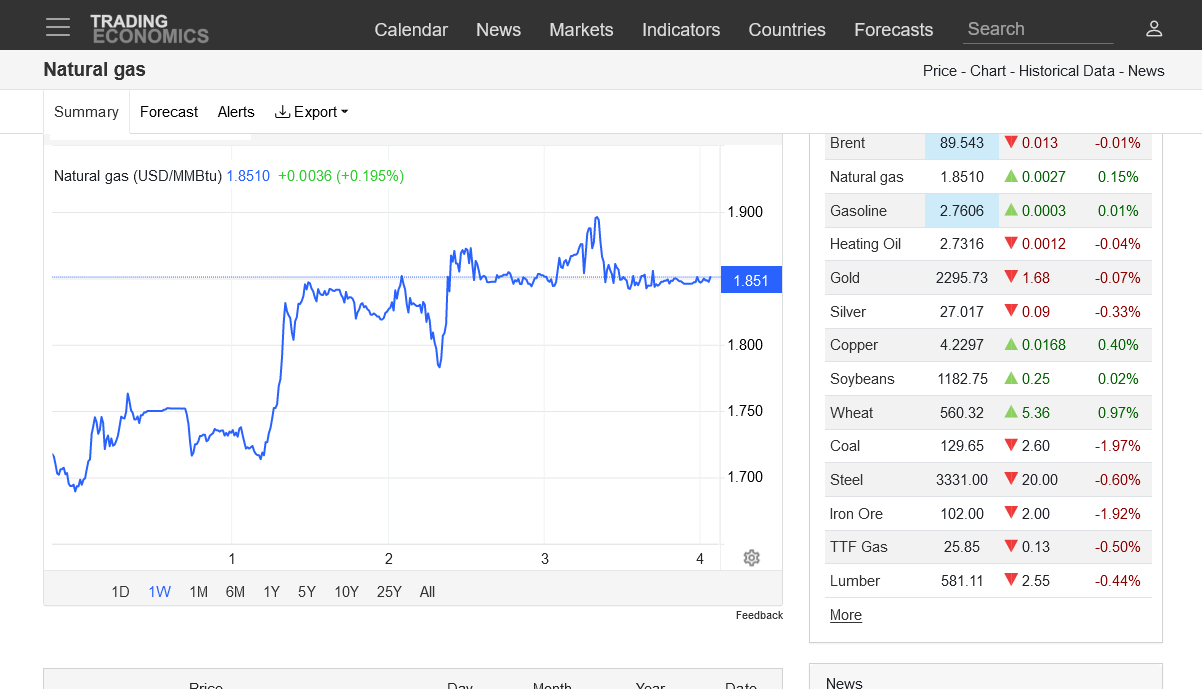
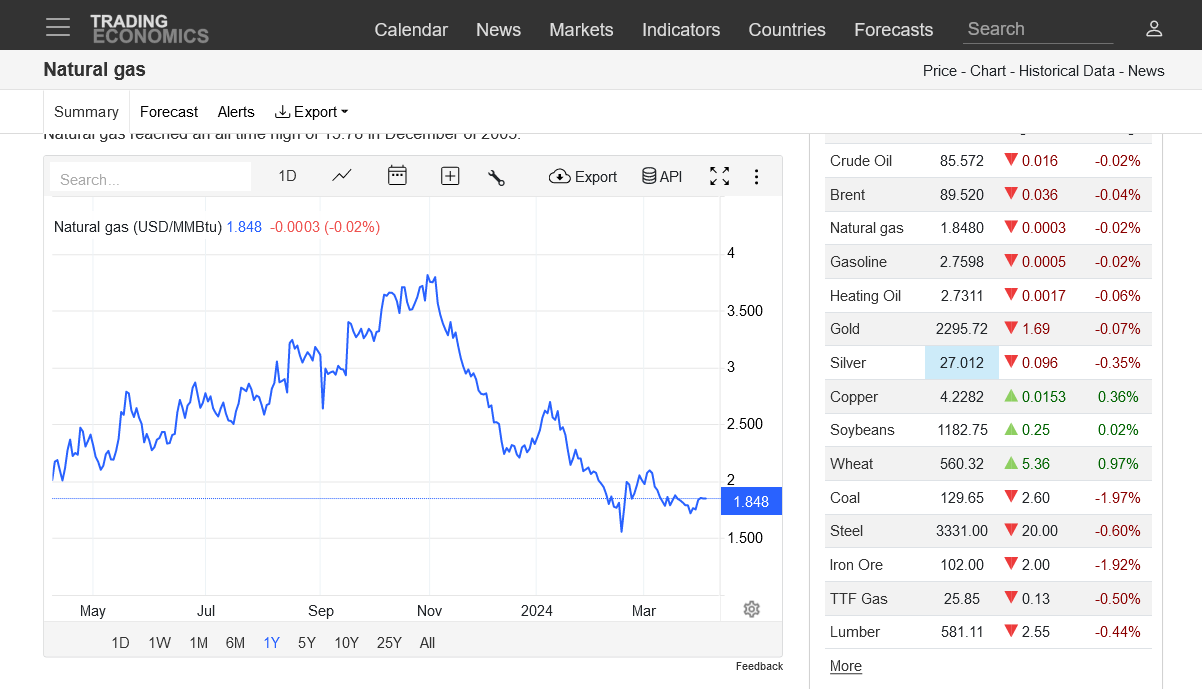
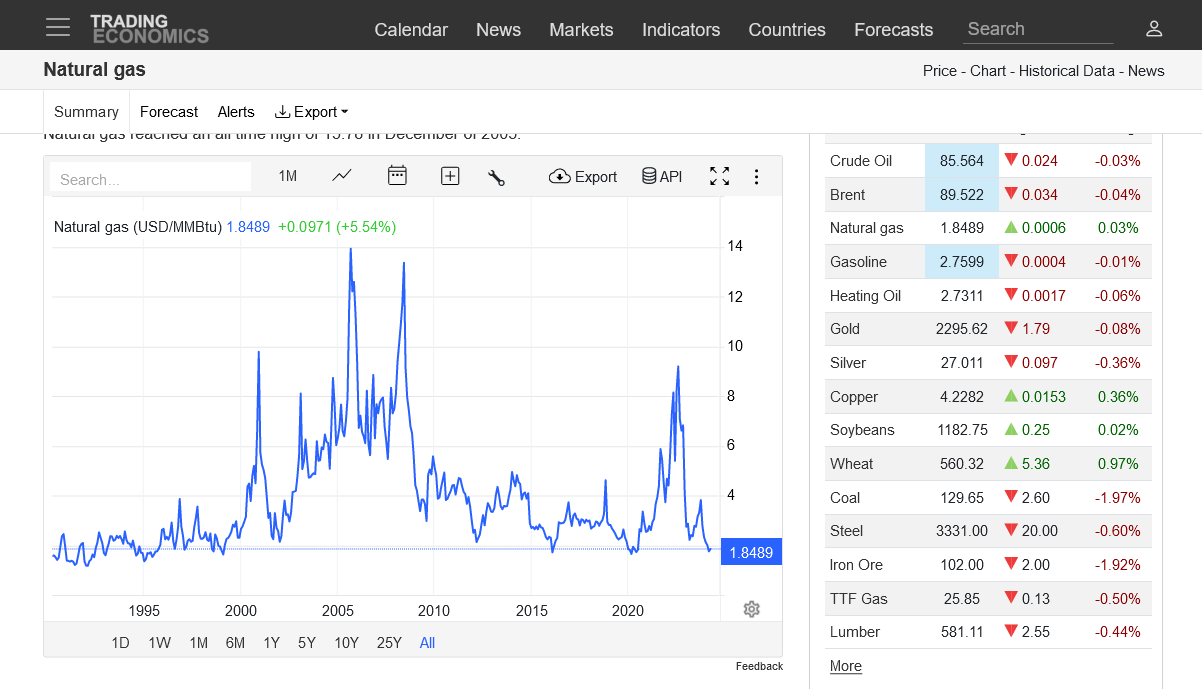
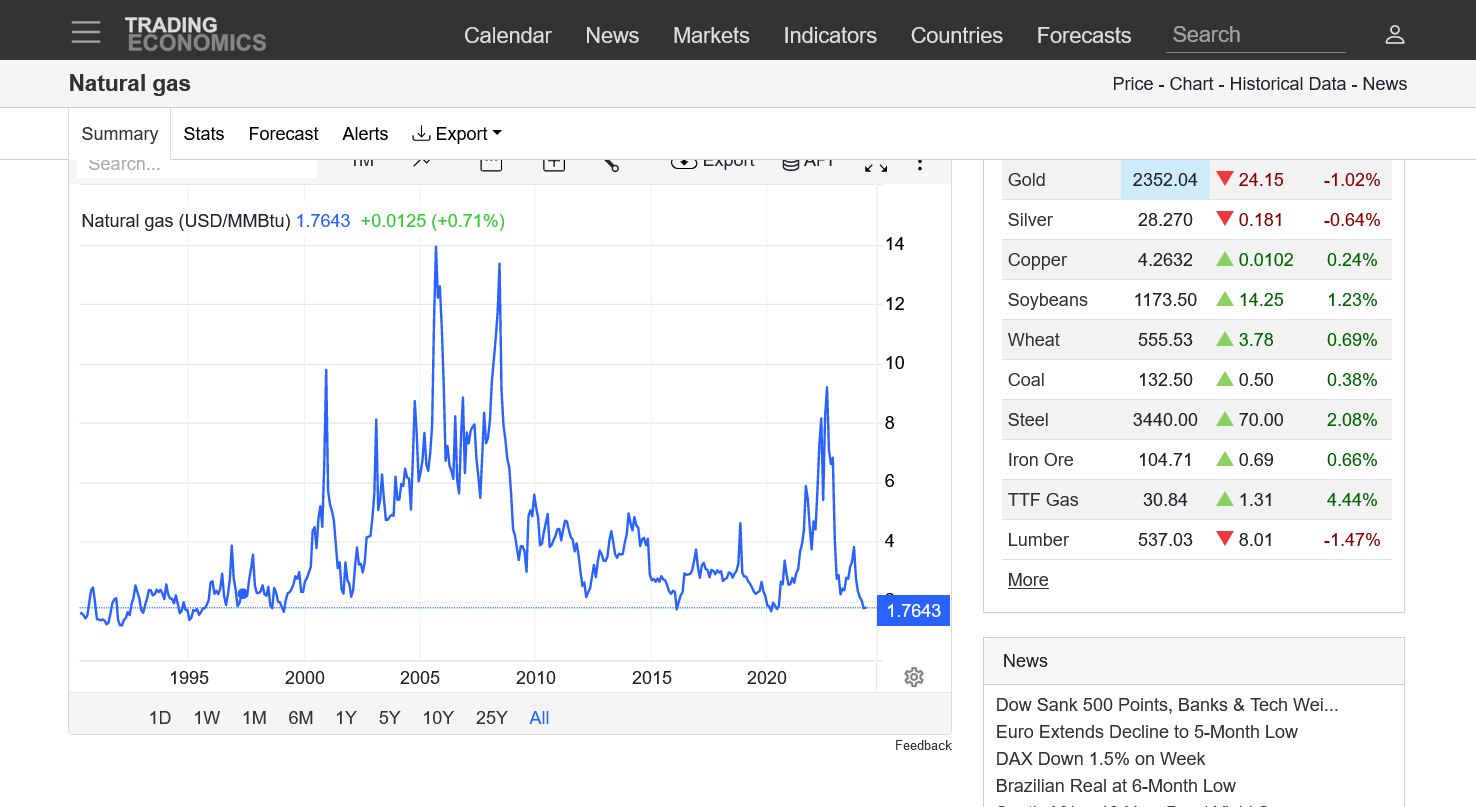
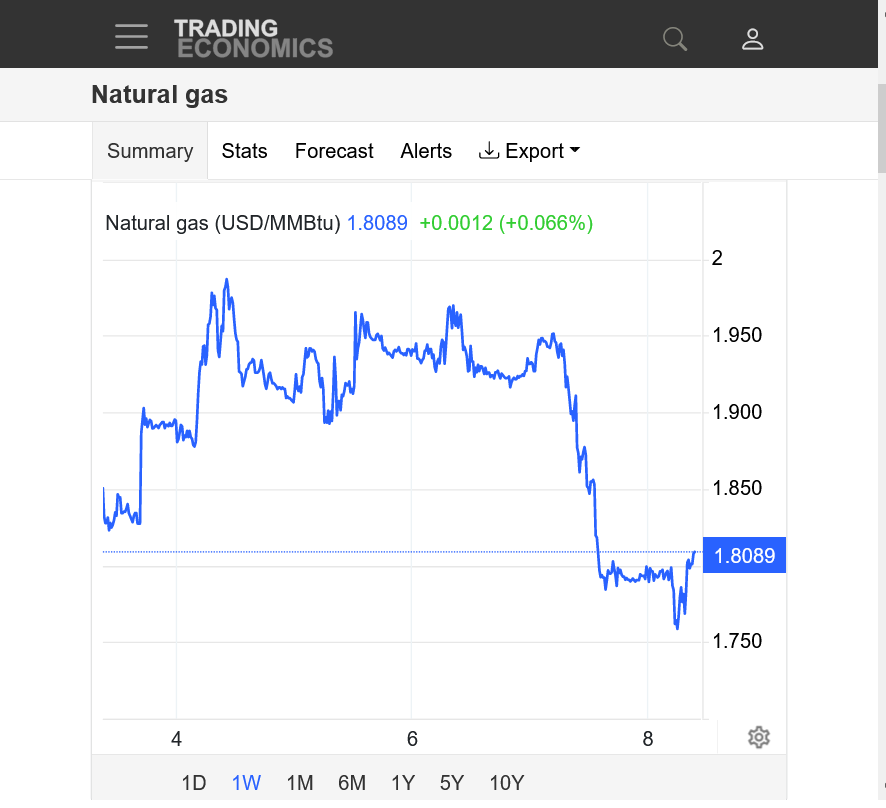
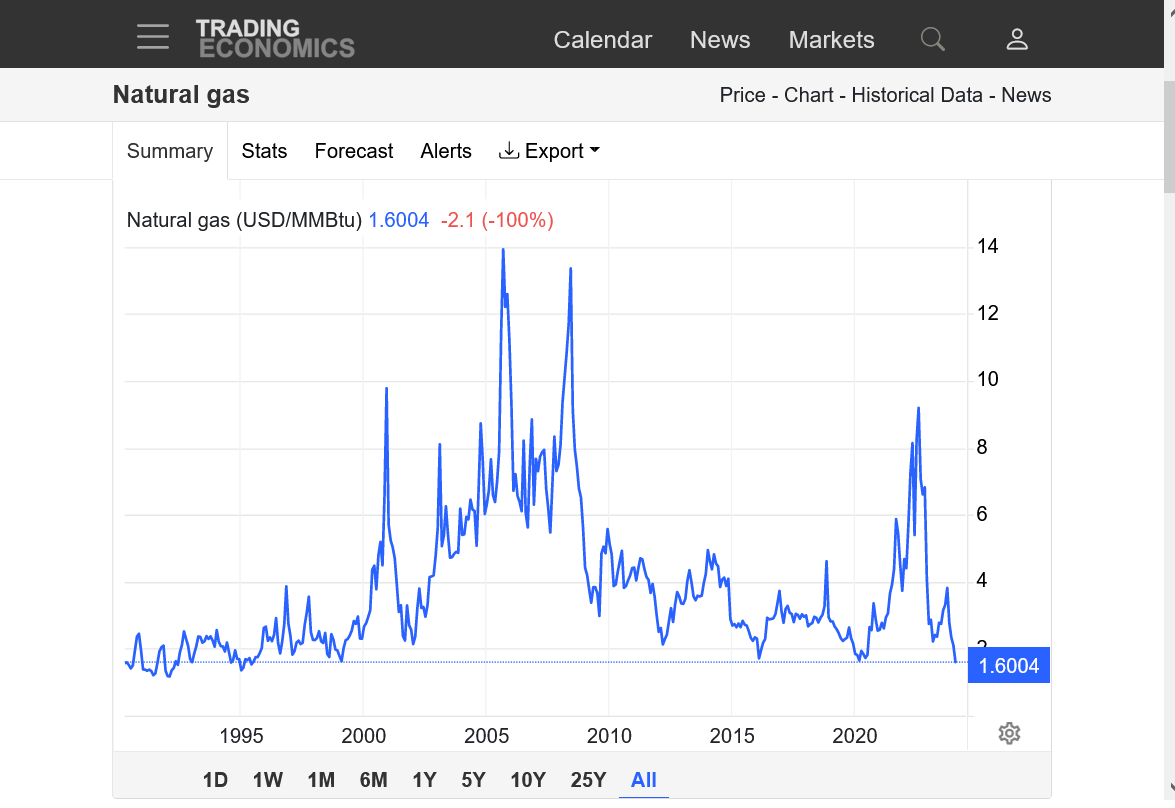
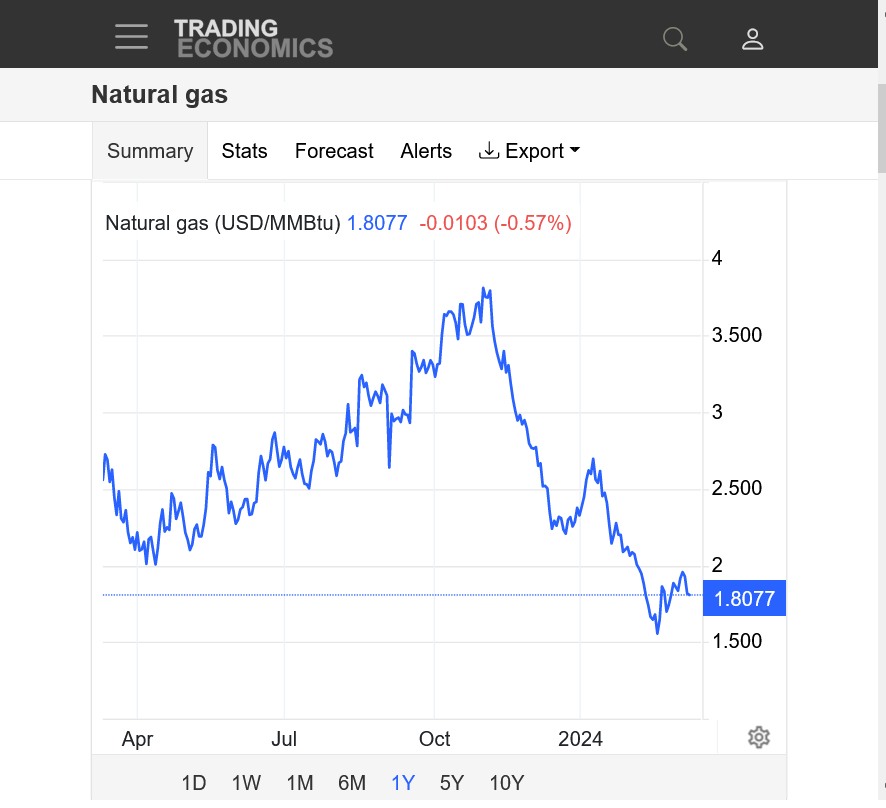
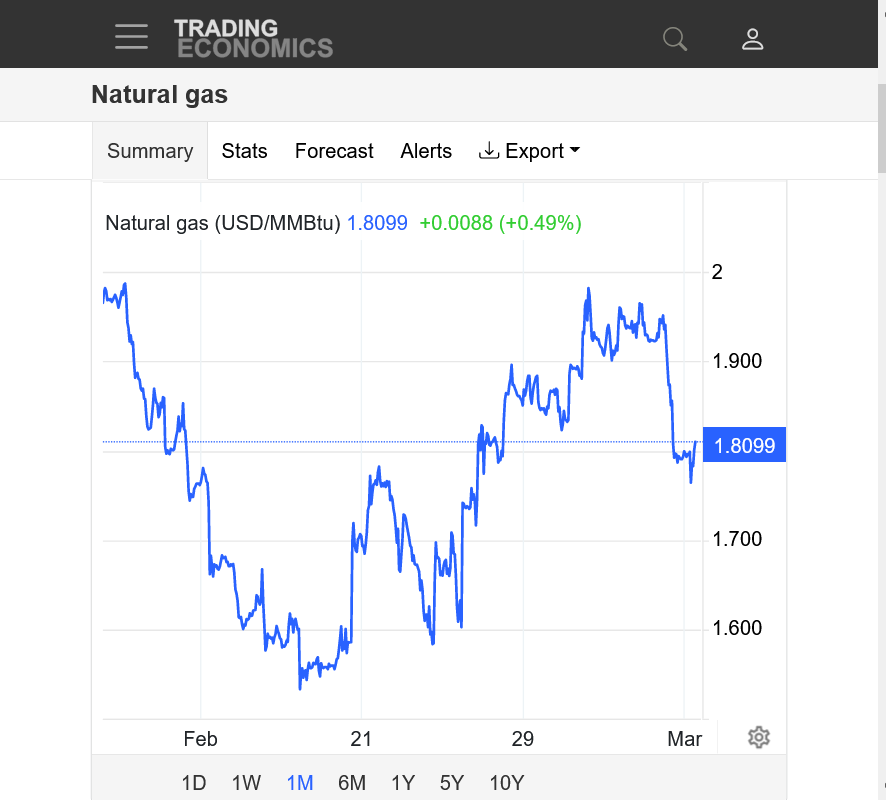
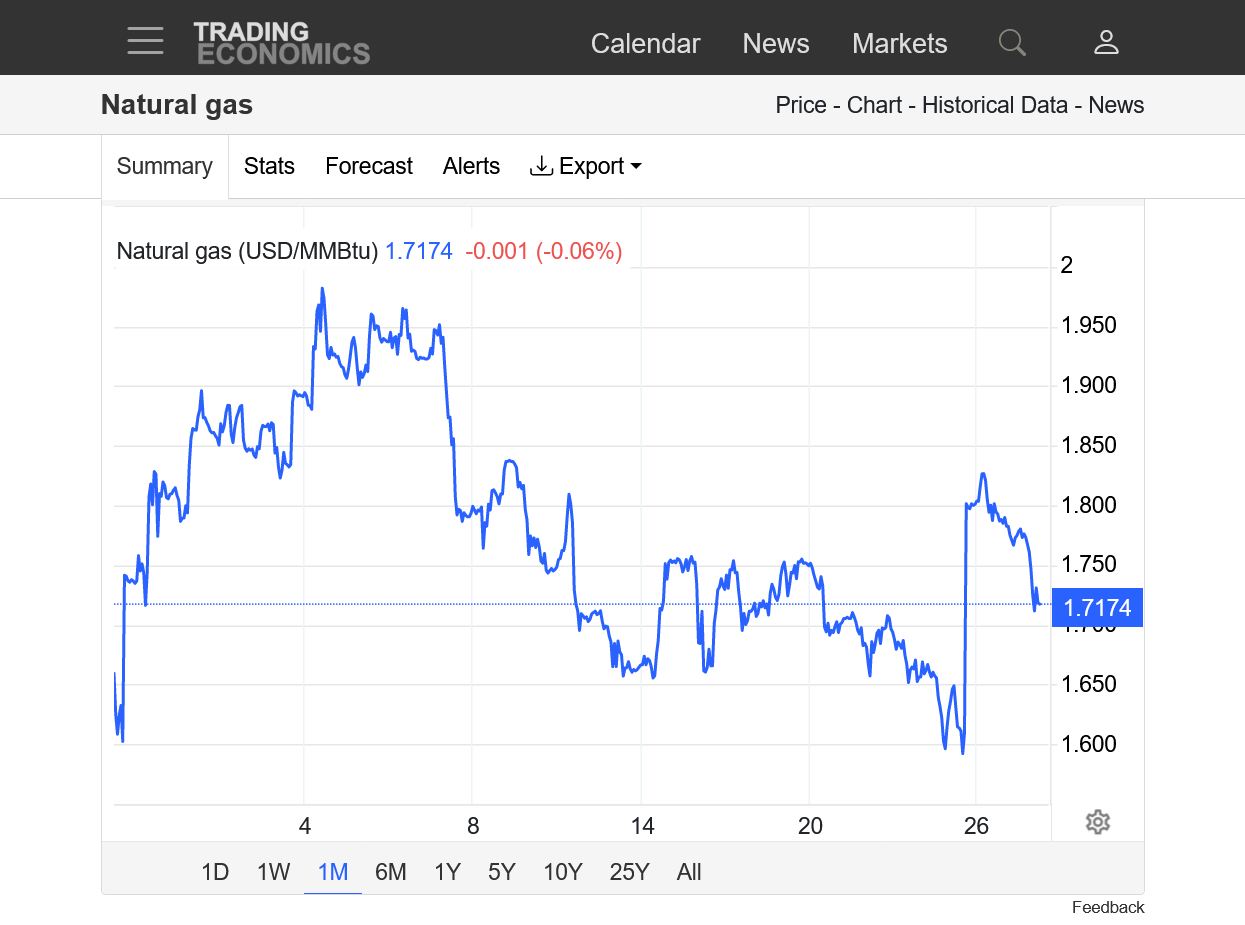
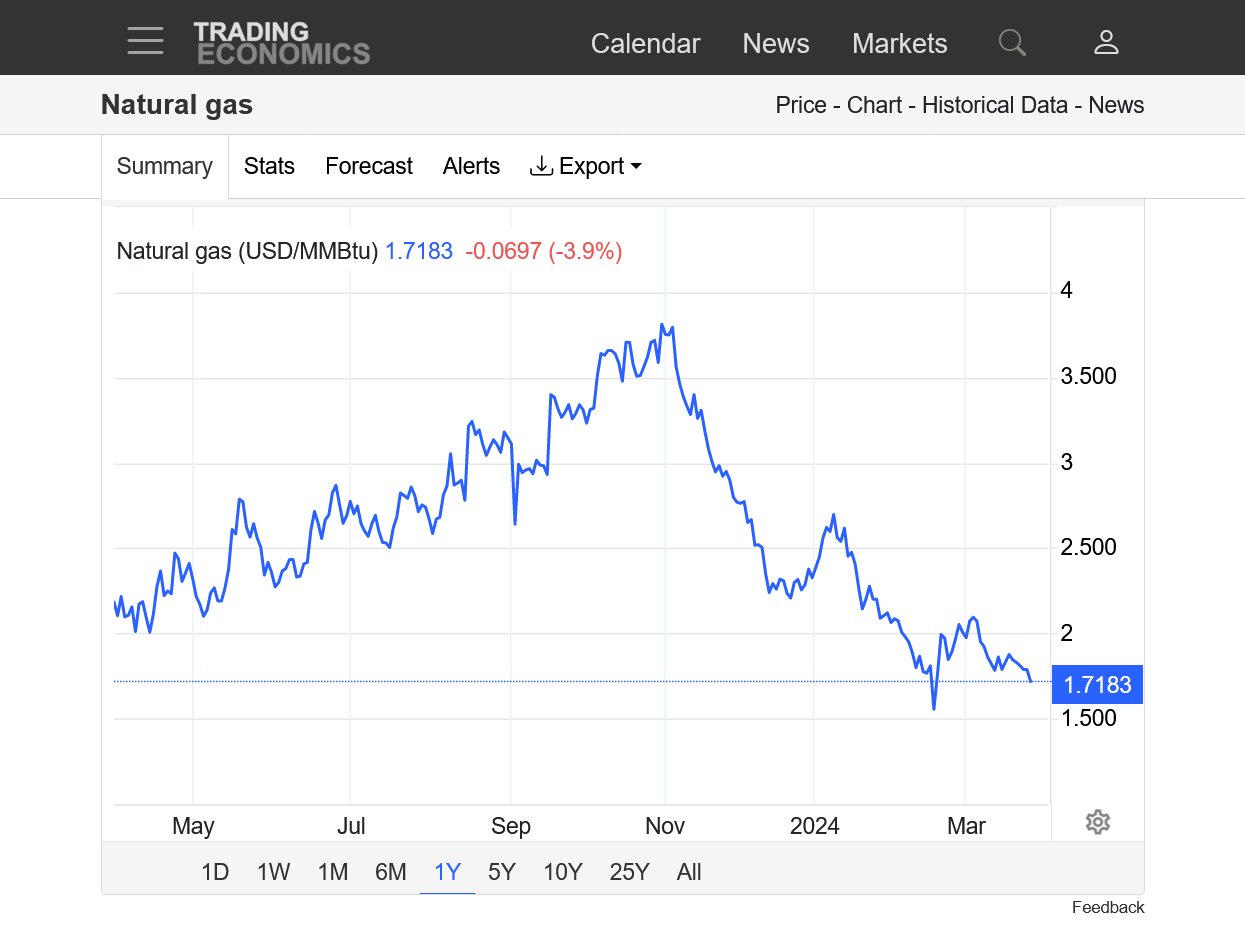
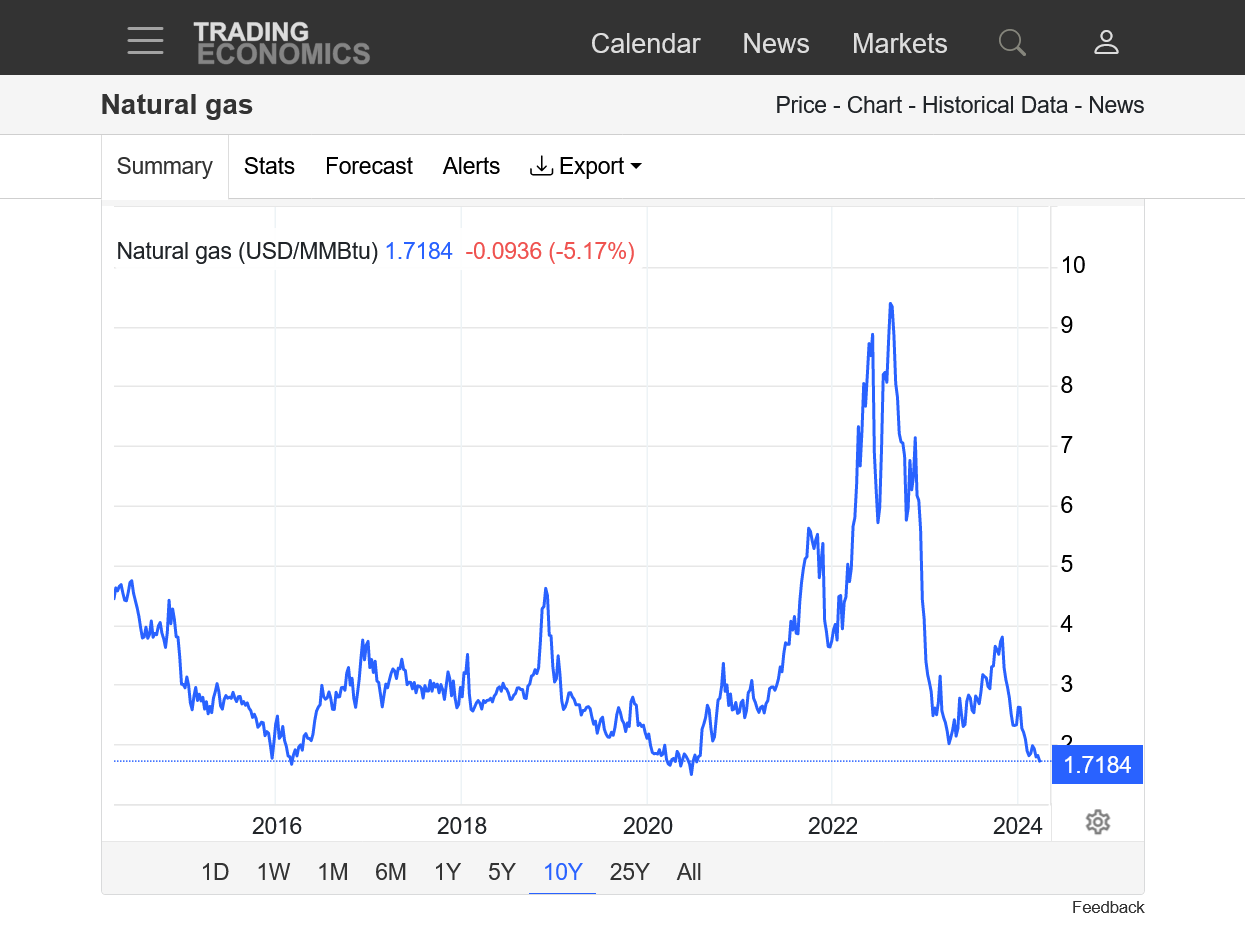
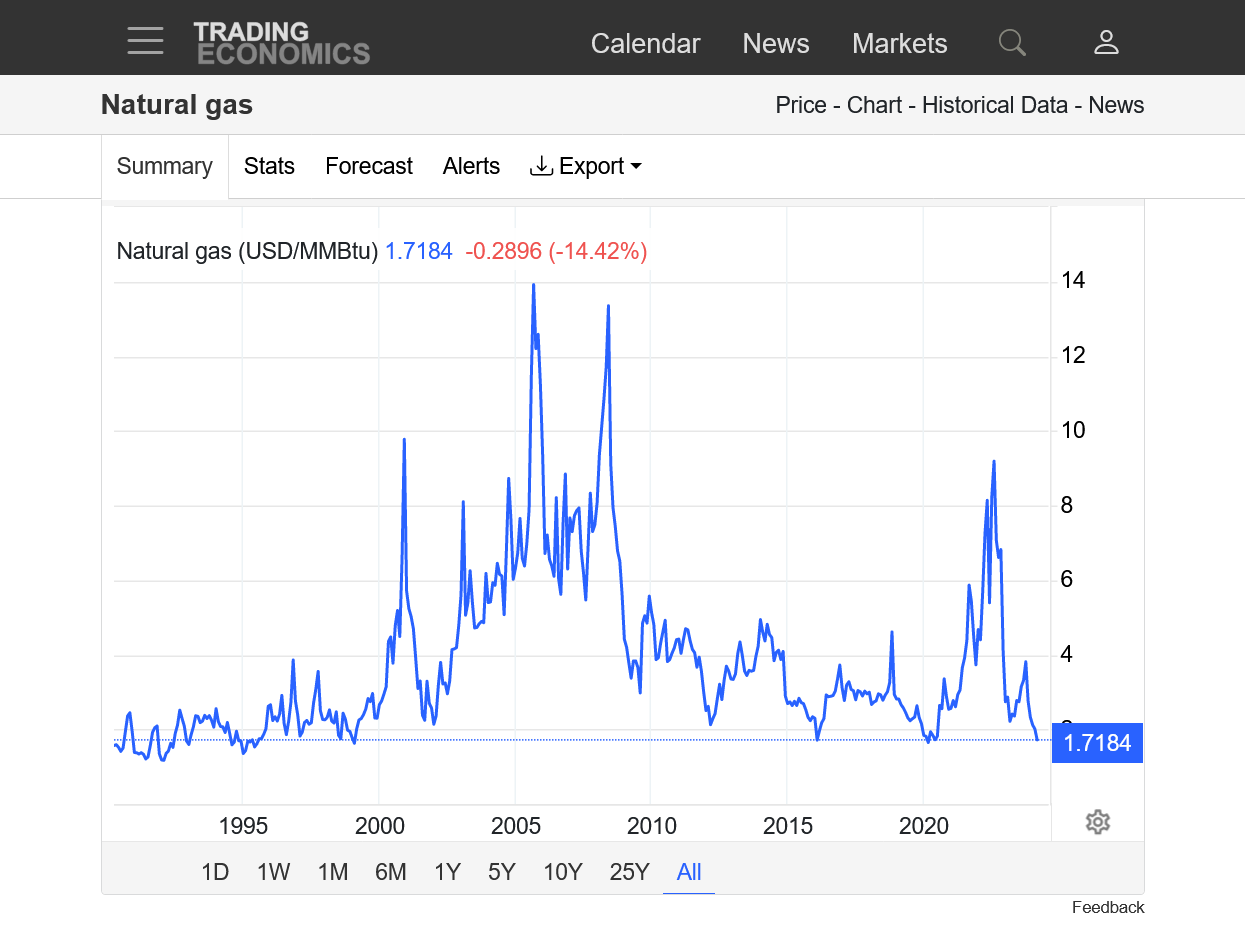
https://tradingeconomics.com/commodity/natural-gas

 ++++++++++++++++
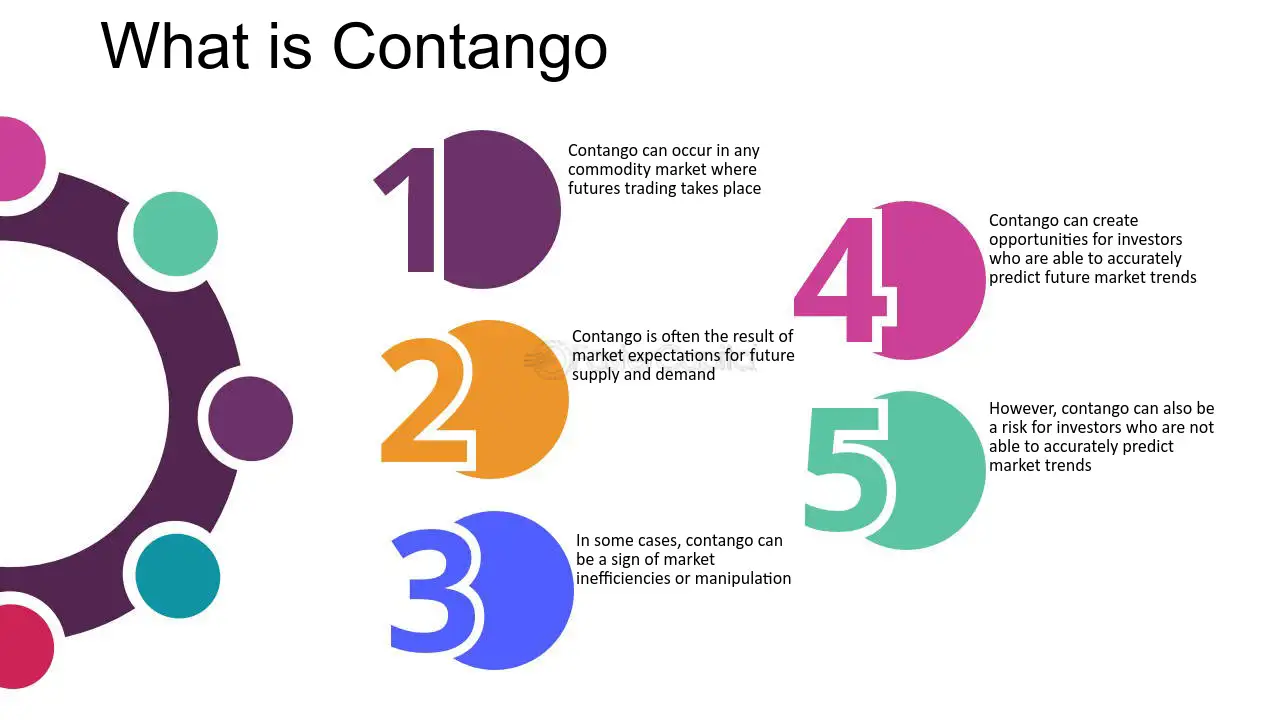
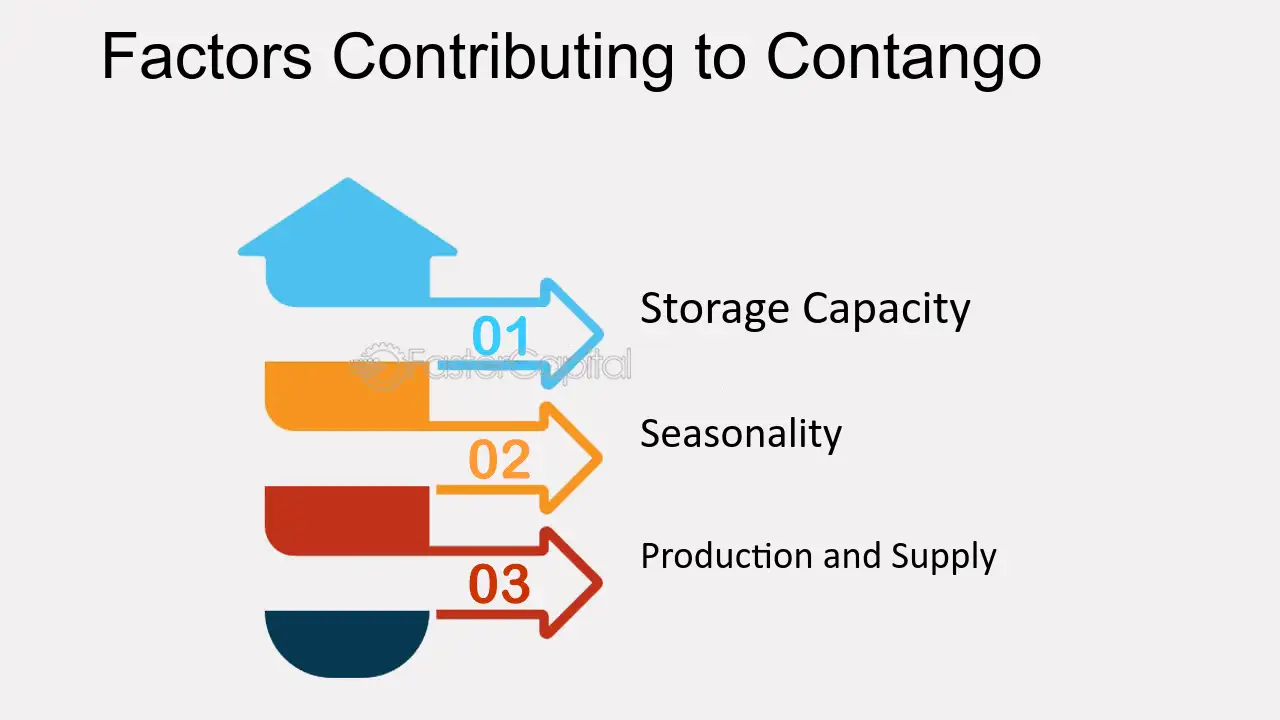
 Related to understanding the rollover from April to the May contract yesterday and some concept associated with it: