Previous NG thread:
Natural Gas 4-22-24+
31 responses |
Started by metmike - April 22, 2024, 3:24 p.m.
Weather update for Natural Gas:
By metmike - June 2, 2024, 5:23 a.m.
++++++++++++++++++
I'm seeing strong signals for a pattern change late in week 2 with the big upper ridge in the West shifting eastward into the Plains. This will turn the weather bullish for natural gas and the grains.
The cool and mostly dry weather should start heating up in mid June!
Extended weather:
https://www.cpc.ncep.noaa.gov/products/predictions/610day/ | |
| 6 to 10 day outlooks | |
| Click below for information about how to read 6-10 day outlook maps Temperature Precipitation | |
| Click below for archives of past outlooks (data & graphics), historical analogs to todays forecast, and other formats of the 6-10 day outlooks ArchivesAnalogsLines-Only FormatGIS Data | |
Temperature Probability | |
Precipitation Probability | |
| 8 to 14 Day Outlooks | |
| Click below for information about how to read 6-10 day outlook maps Temperature Precipitation | |
| Click below for archives of past outlooks (data & graphics), historical analogs to todays forecast, and other formats of the 8-14 day outlooks ArchivesAnalogsLines-Only FormatGIS Data | |
Temperature Probability | |
Precipitation Probability | |
++++++++++++++
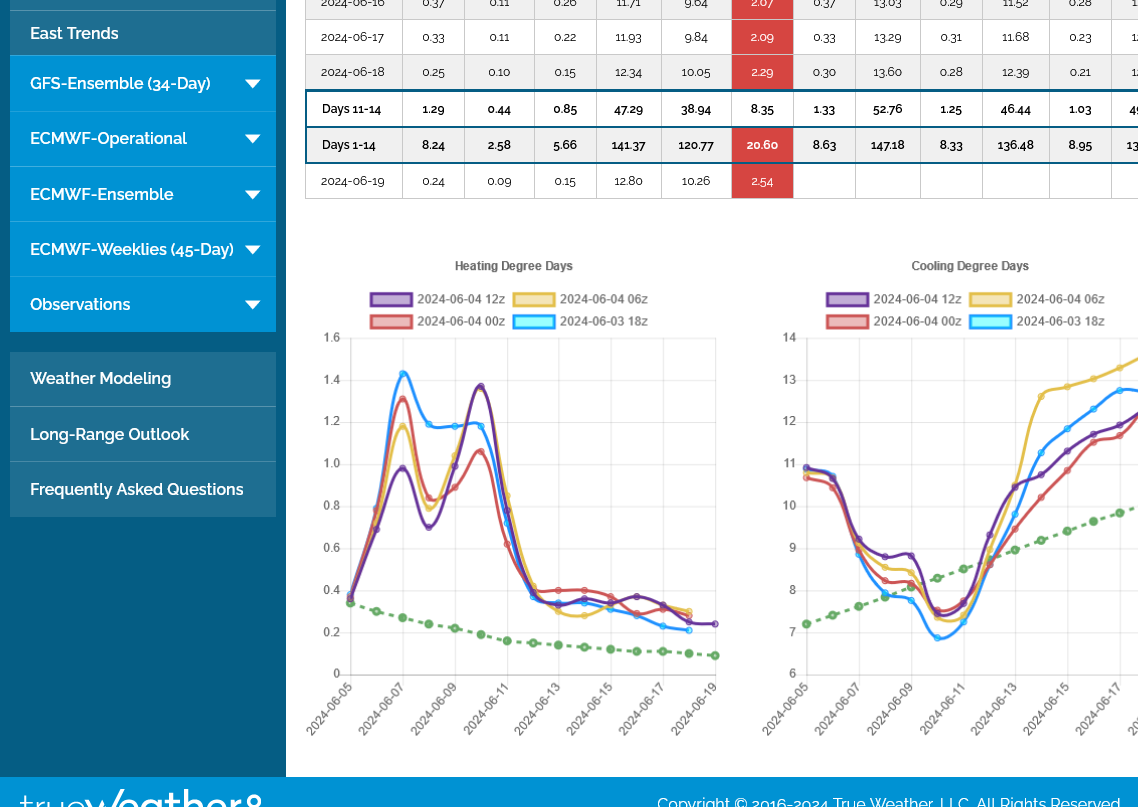
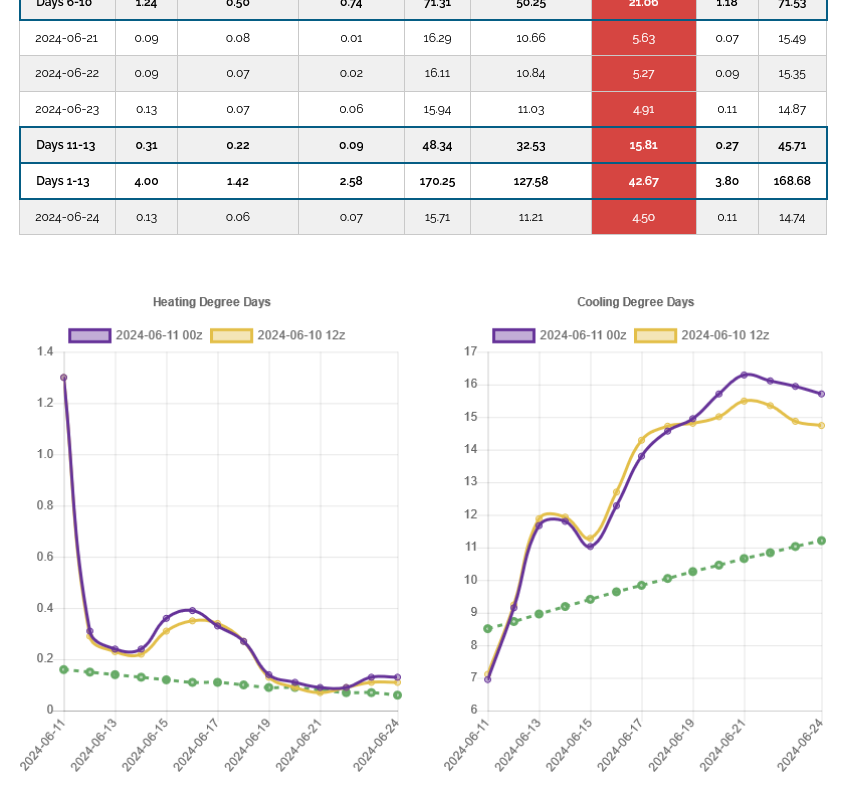
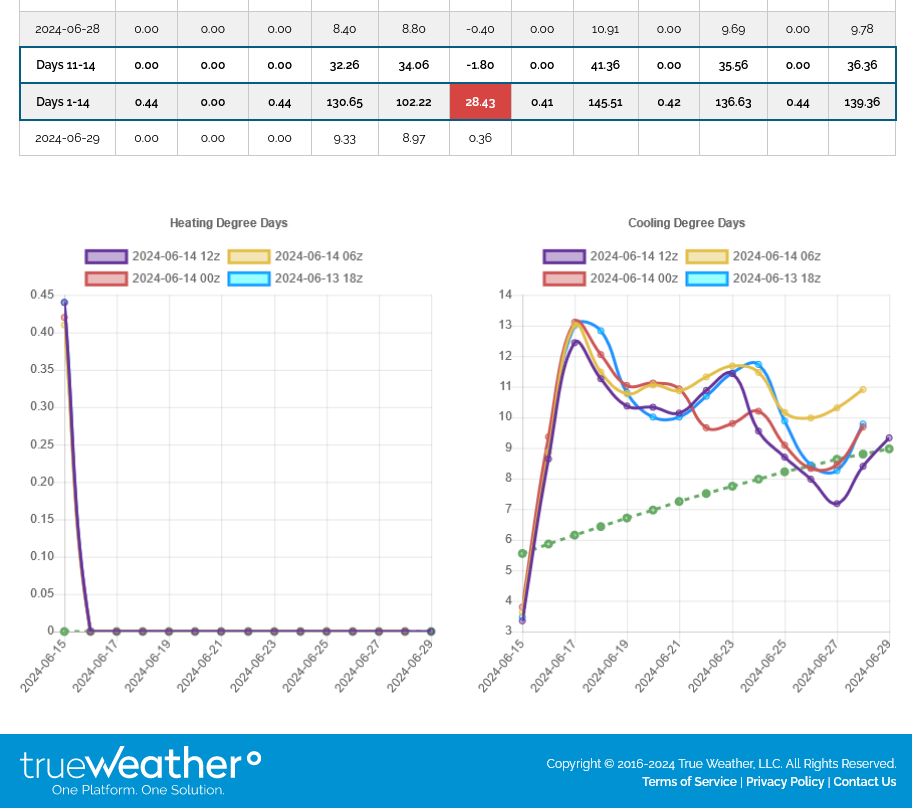
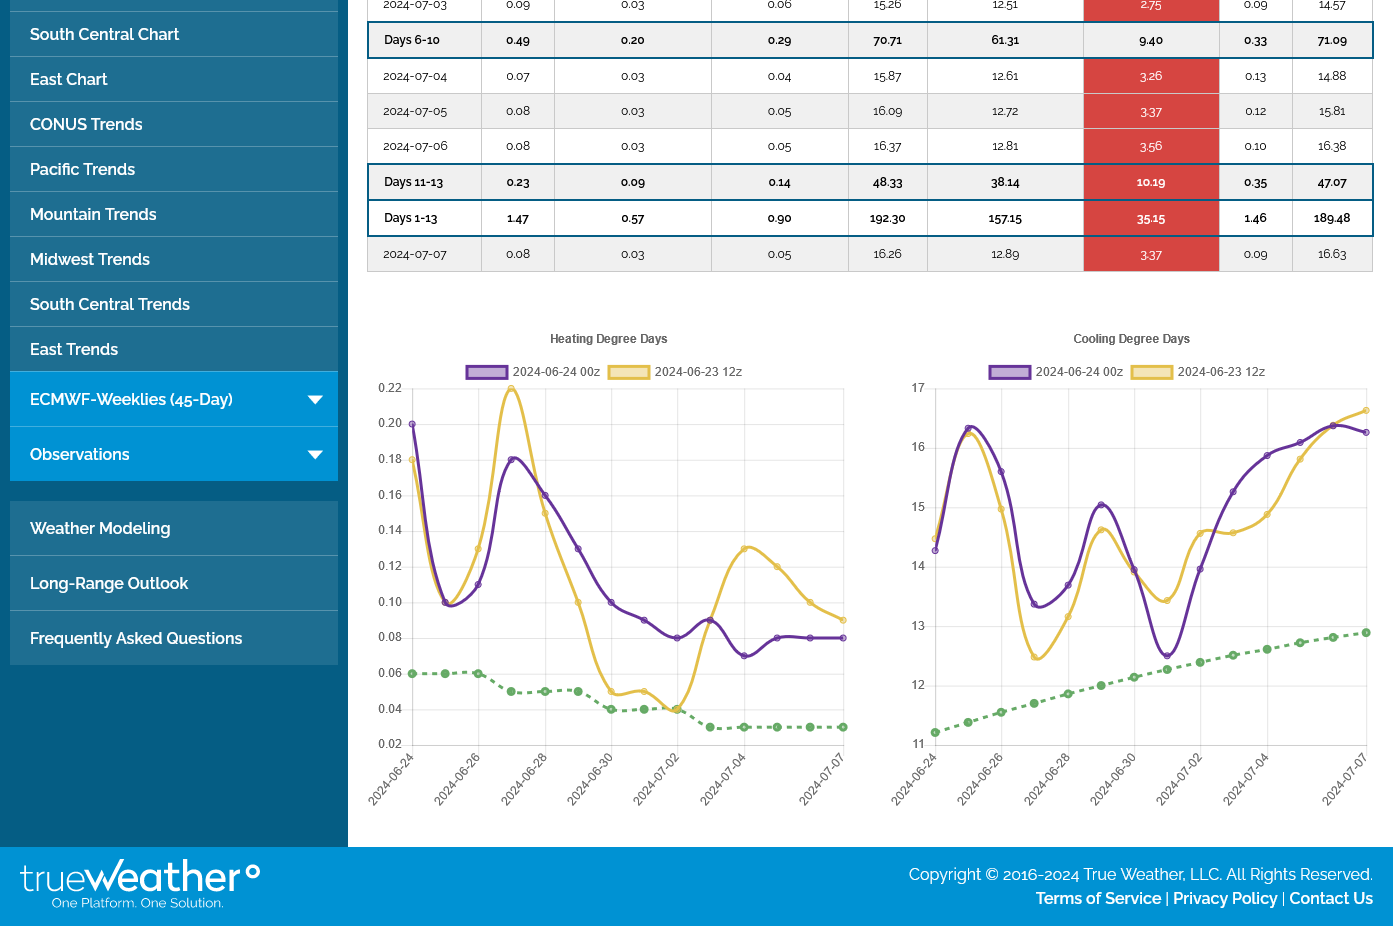
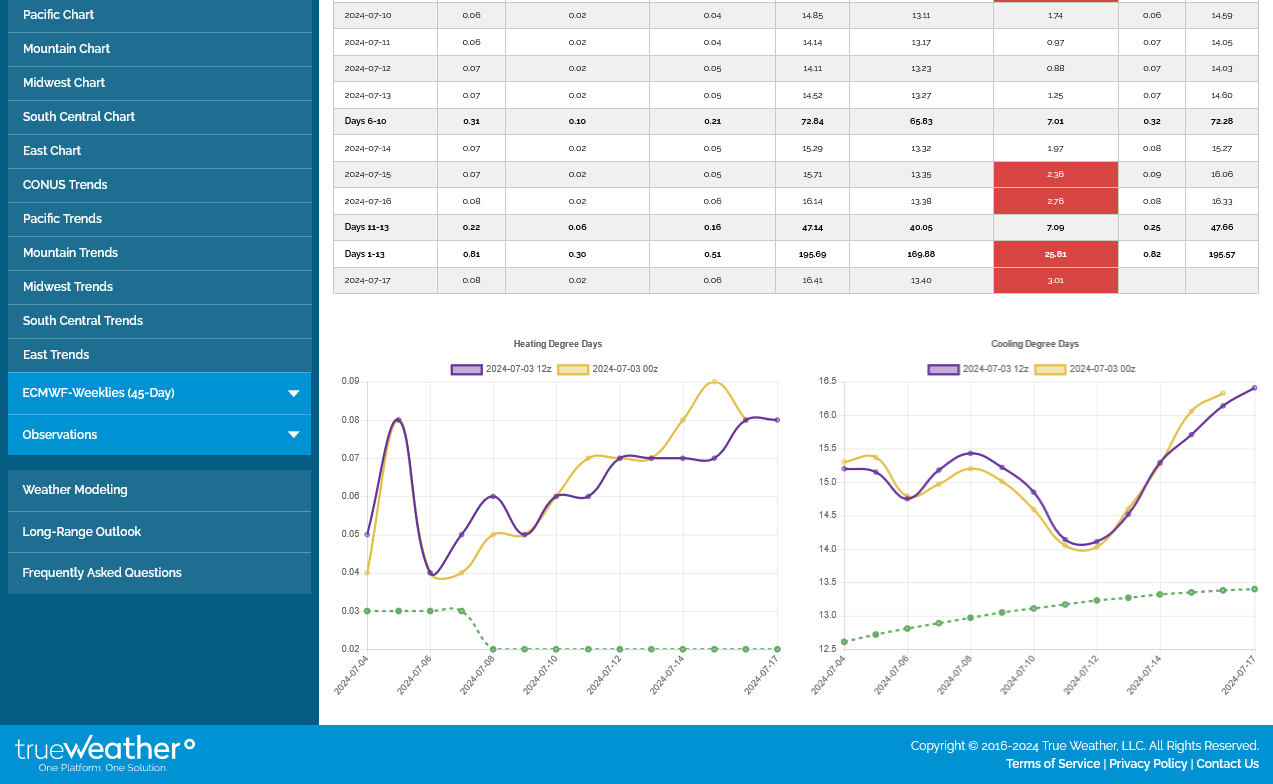
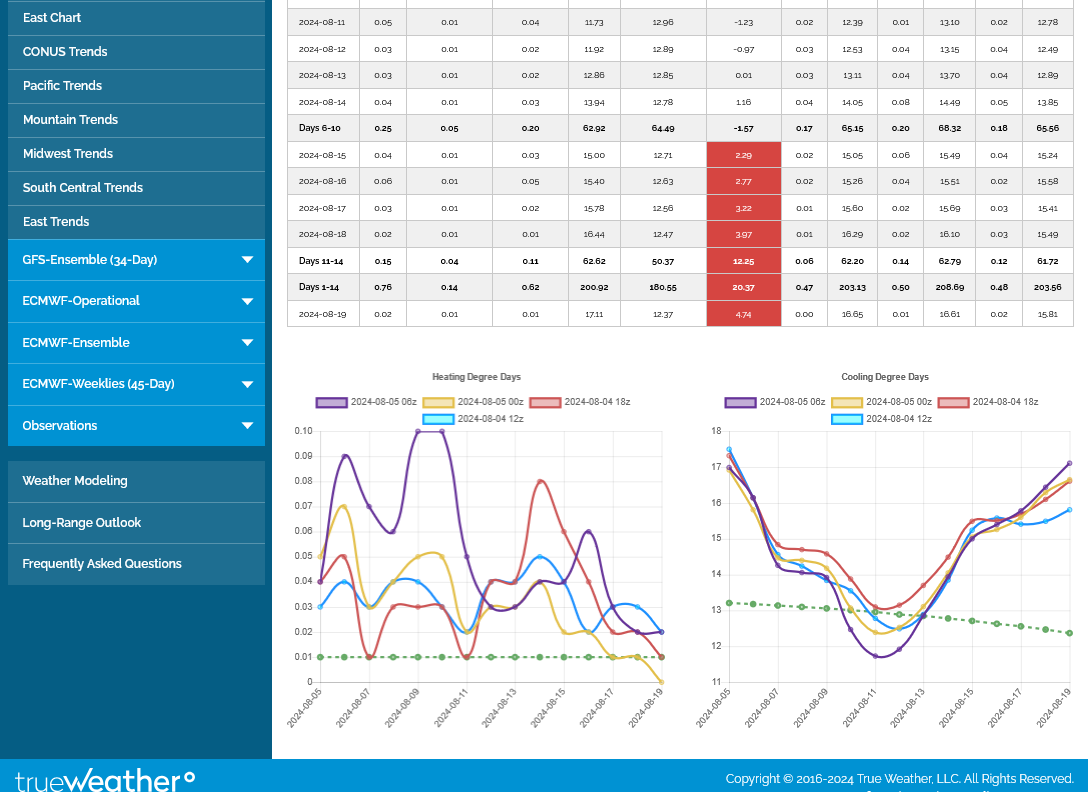
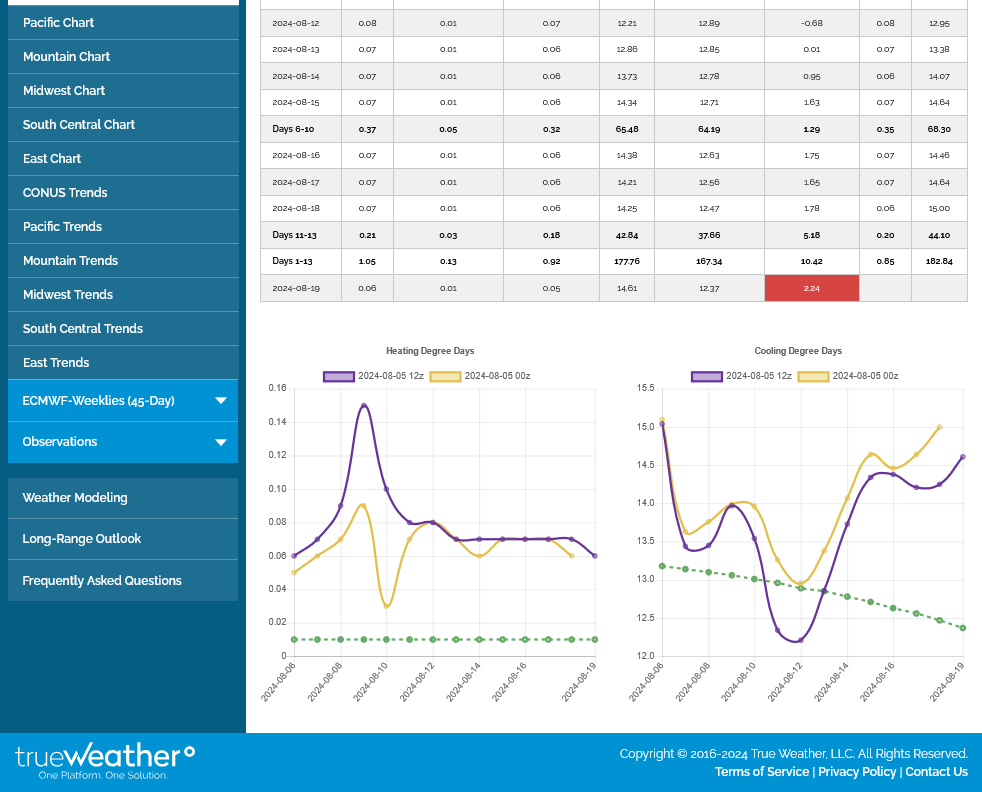
Check out these CDD maps for the next 2 weeks from the just updated 0z European Ensemble model in purple on the right.
1. The Pacific region: normal increases slowly from just 1.5 to 2.5 as seen with the green line on the right during the 2 weeks below. Residential cooling demand can spike up like this during heat waves but is usually MUCH, MUCH less than the Midwest, East and South where the overall population is greater and hot/HUMID weather is more common. Heat waves in the West have MUCH lower humidities than in the East(but this contributes to wildfires). During this upcoming week, near record heat out West will briefly spike the CDDs to 7 which is around 4 times the normal. It stays hot out there in week 2 as the heat shifts farther east
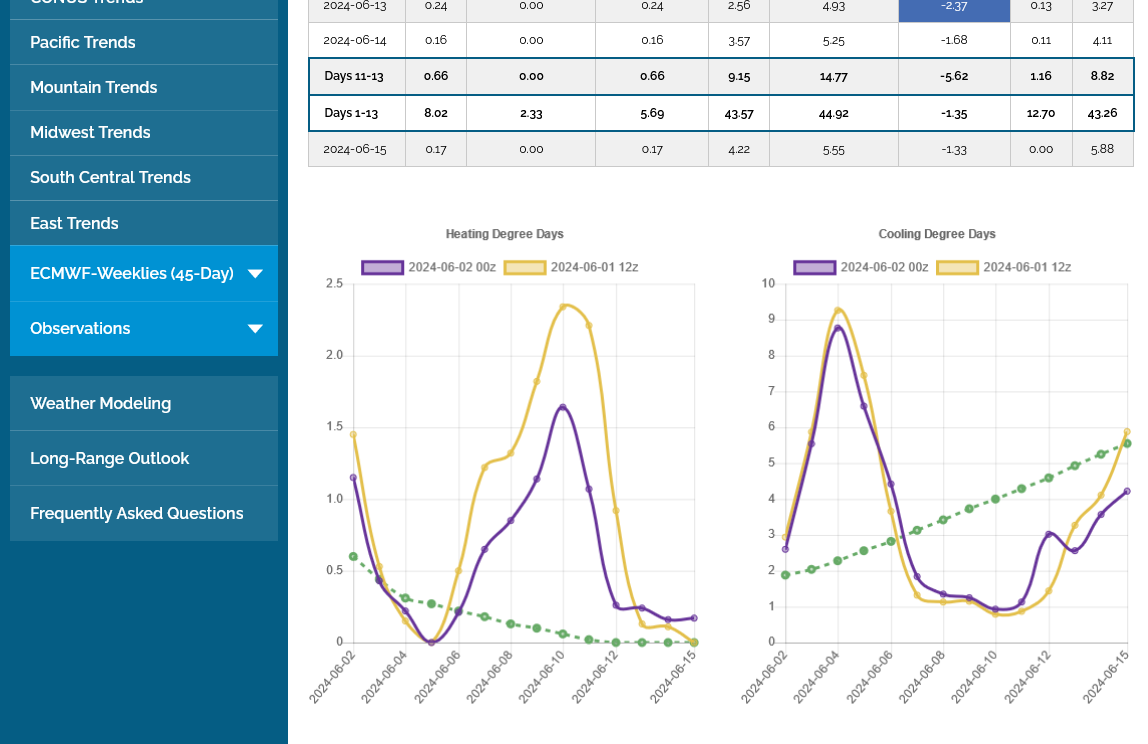
2. The Midwest region on the 2nd map sees an average increase in CDDs (in green on the right) from 2.5 to an increasingly substantial 6 by mid June. After a very brief spike to 9 to start this week, temps plunge and CDDs are MUCH BELOW AVERAGE for an extended period but start recovering late in week 2.
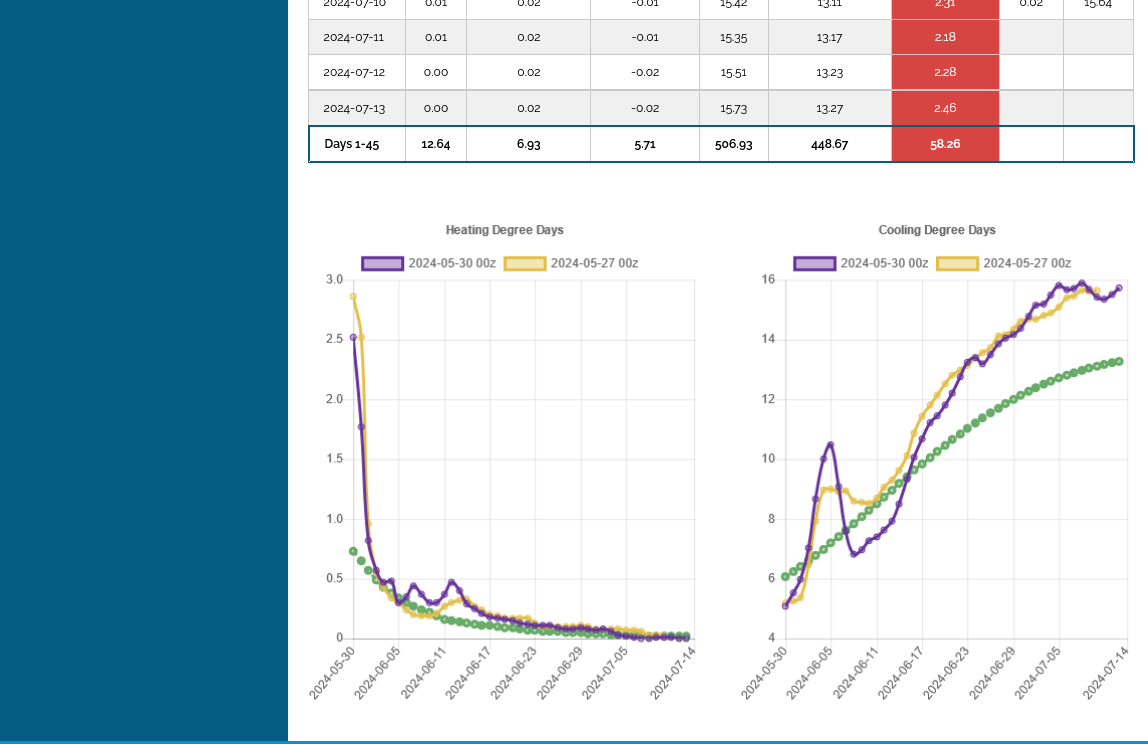
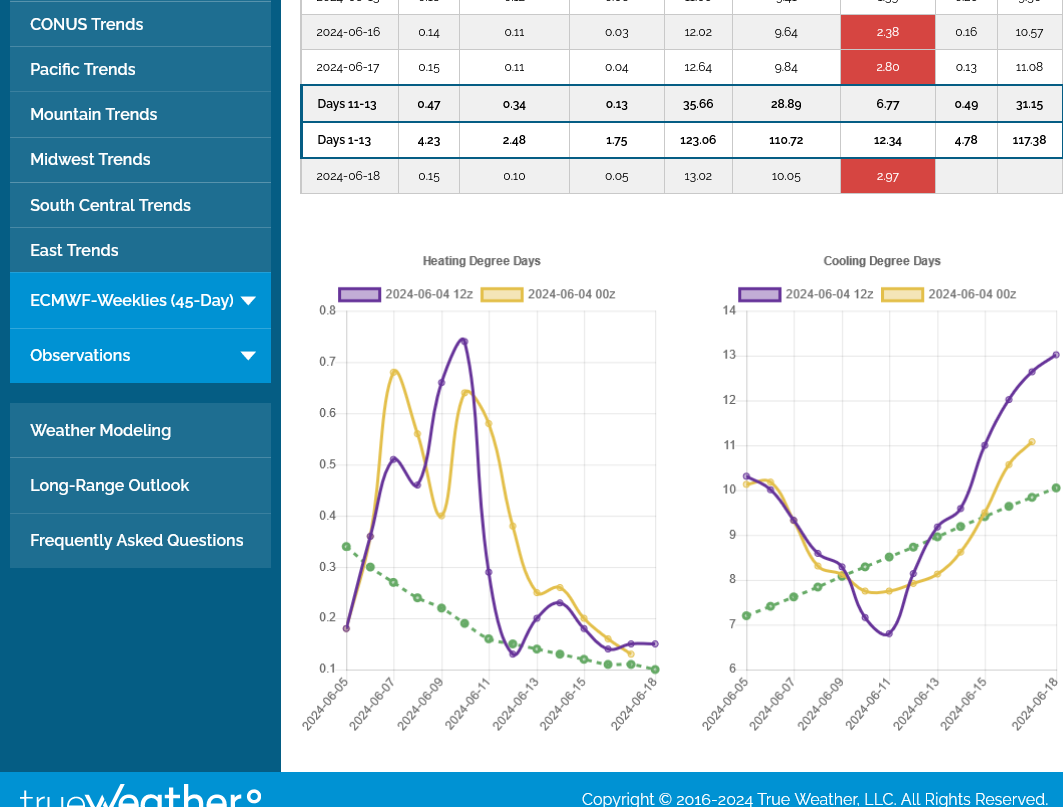
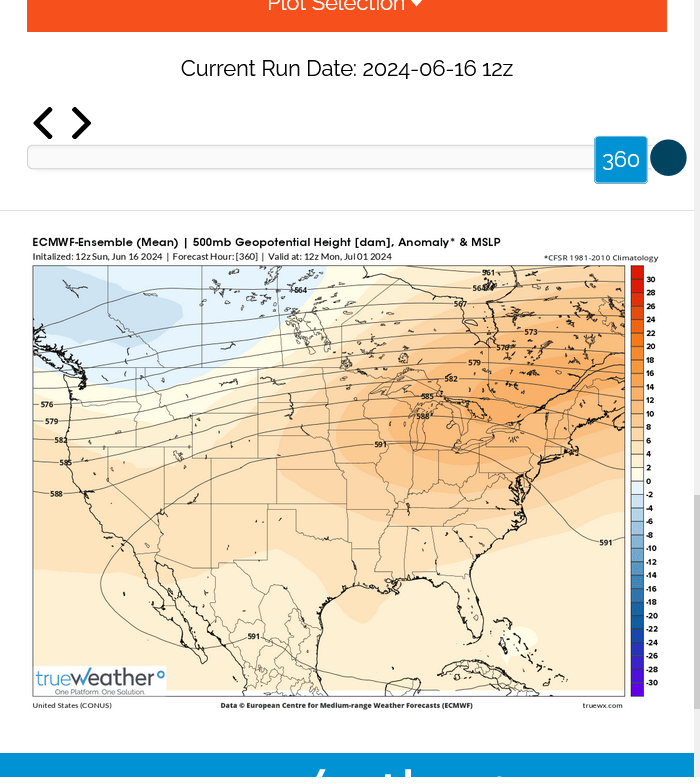
3. This is the 45 day outlook for the entire country from the last European model run late last week. You can see how the first 2 weeks look more like the Midwest's signature because the Midwest counts so much more than the West/Pacific. What stands out is the rapidly building heat! Temps go ABOVE average during mid month and stay sustained WELL ABOVE AVERAGE THRU MID-JULY. This is POTENTIALLY bullish NG AND grains.
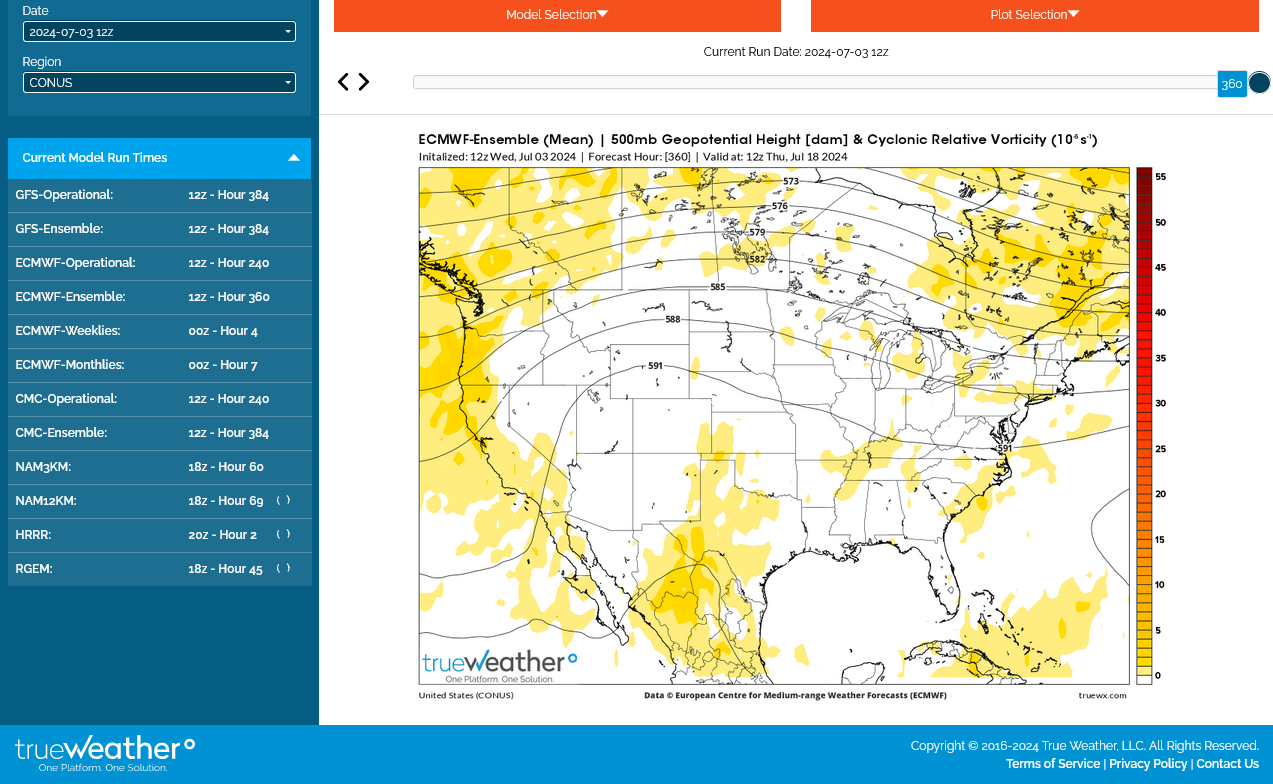
4. Mid June Upper levels
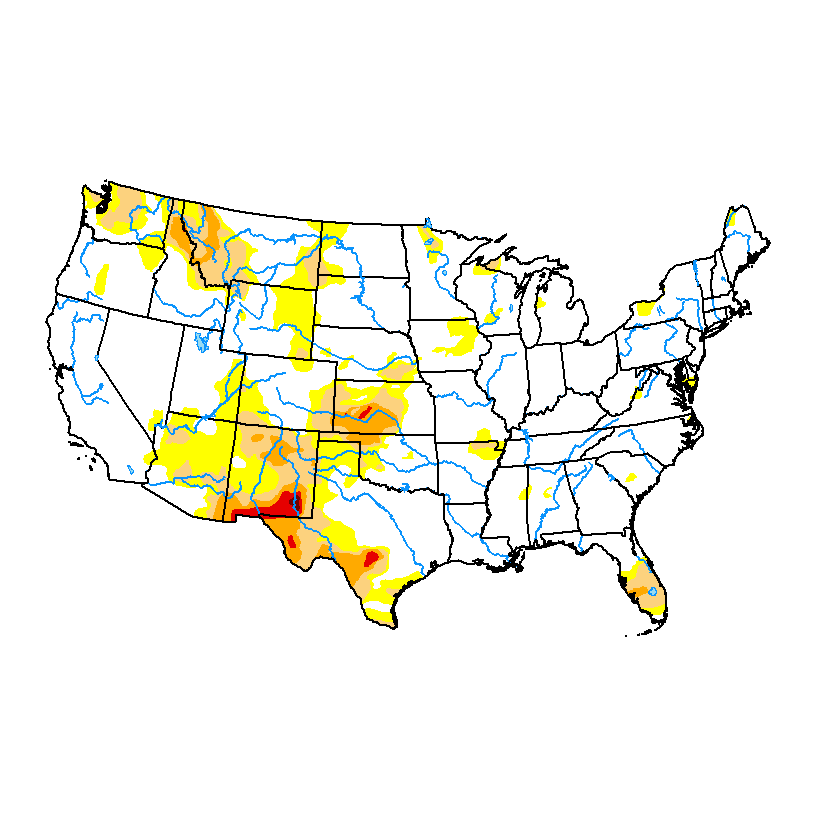
5. Drought monitor: Great shape everywhere........except KS that will get hurt in late June with intense heat.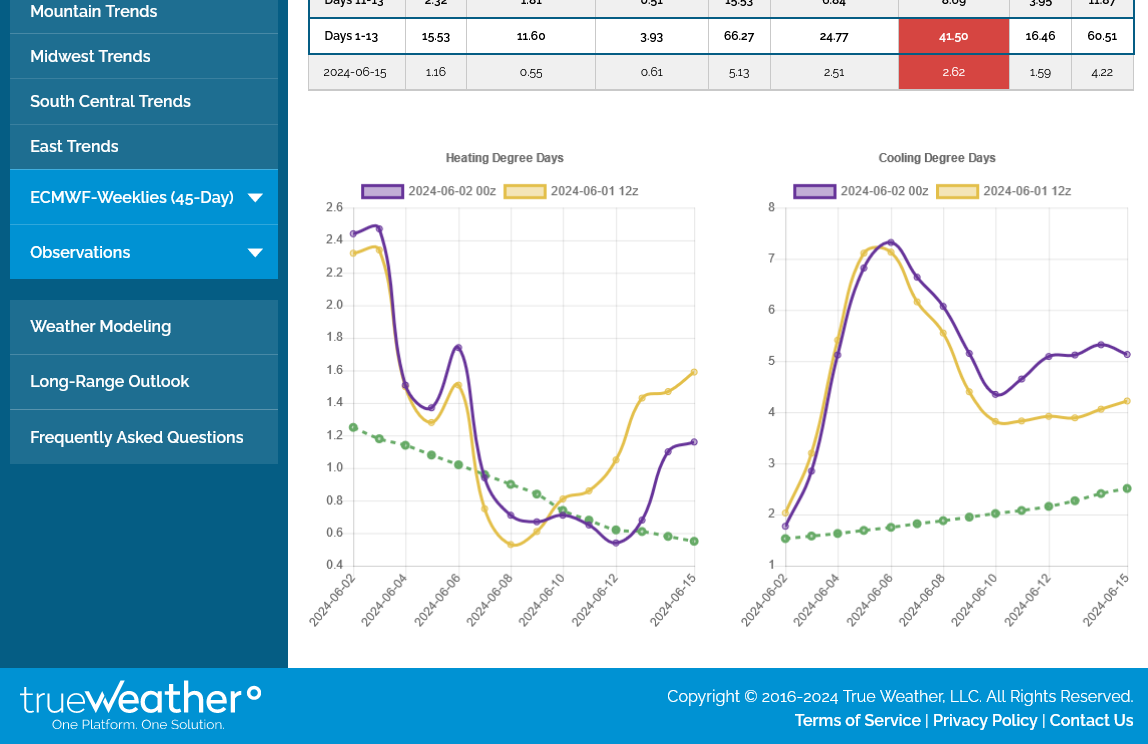
 ++++++++++++++++++++++
45 days for entire country below:
++++++++++++++++++++++++
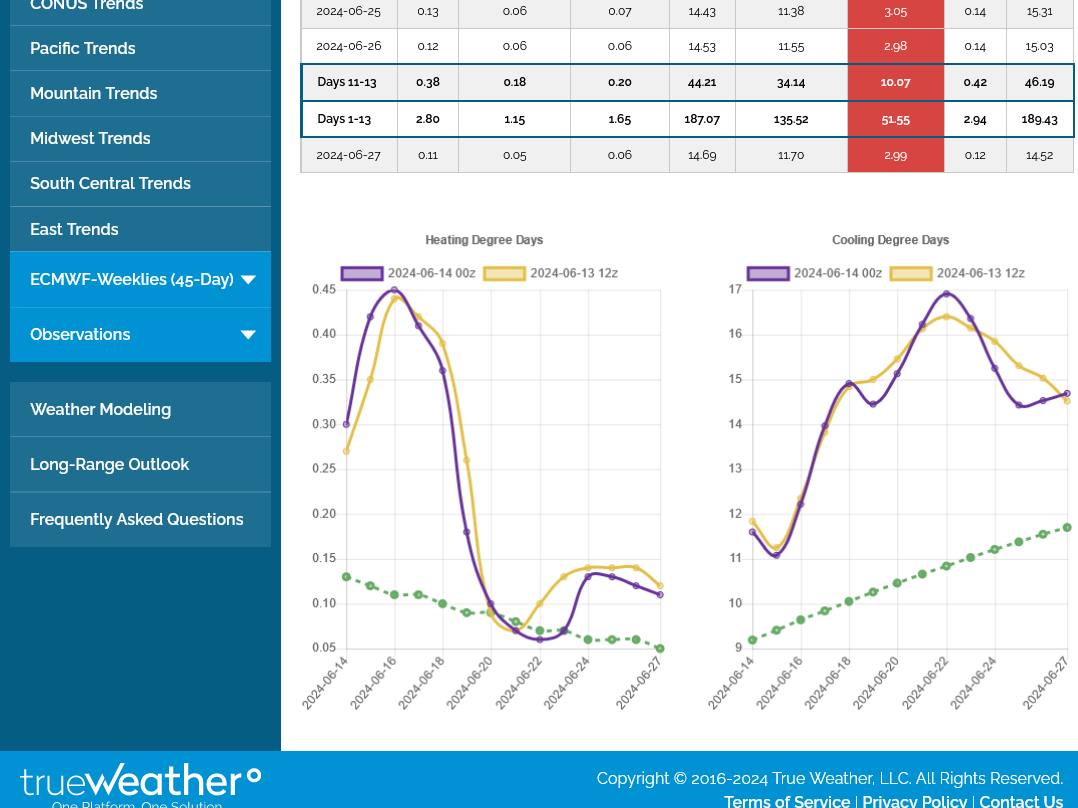
4. Upper levels mid June with individual ensembles from Canadian model. Upper level ridge shifts east. How strong? What location? Hot and dry will become a worry in the 2nd half of June for some locations!
384h GZ 500 forecast valid on Jun 18, 2024 00UTC


Forecasts for global GEM, control (GE
5. Drought monitor: Midwest in great shape overall but NOT, KS. KS wheat which is filling will likely get hurt in late June with the new pattern.
Last week as of May 28, 2024-no drought in California from the Winter El Nino. Most drought in the Midwest is wiped out completely!
DROUGHT MONITOR
https://droughtmonitor.unl.edu/
Heat in the south burned some NG to generate electricity for AC use thru last Thursday for the next EIA report released this Thursday at 9:30am.
Injection may not be as robust as previous weeks or average?
https://www.cpc.ncep.noaa.gov/products/tanal/temp_analyses.php
++++++++++
++++++++++++++++++++++
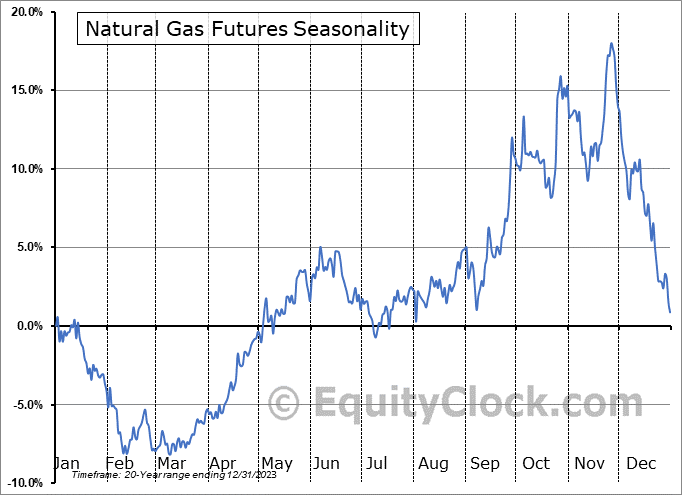
Seasonals for NG turn DOWN here:
https://charts.equityclock.com/natural-gas-futures-ng-seasonal-chart
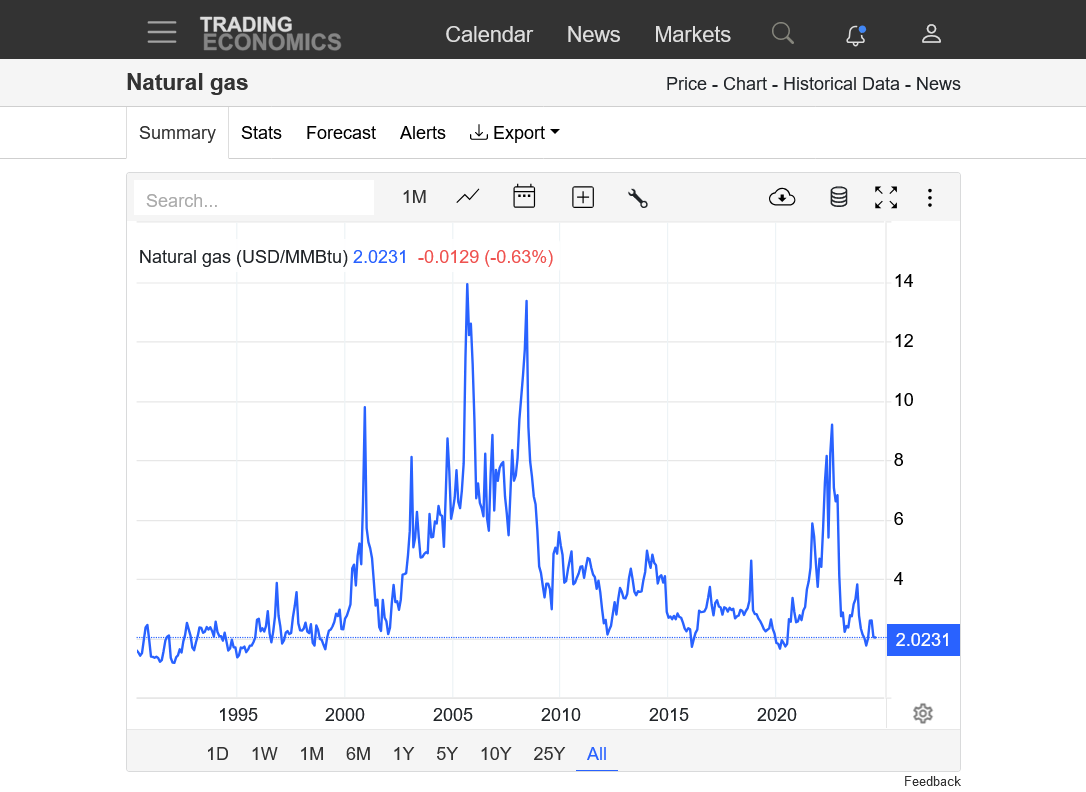
NG Price charts
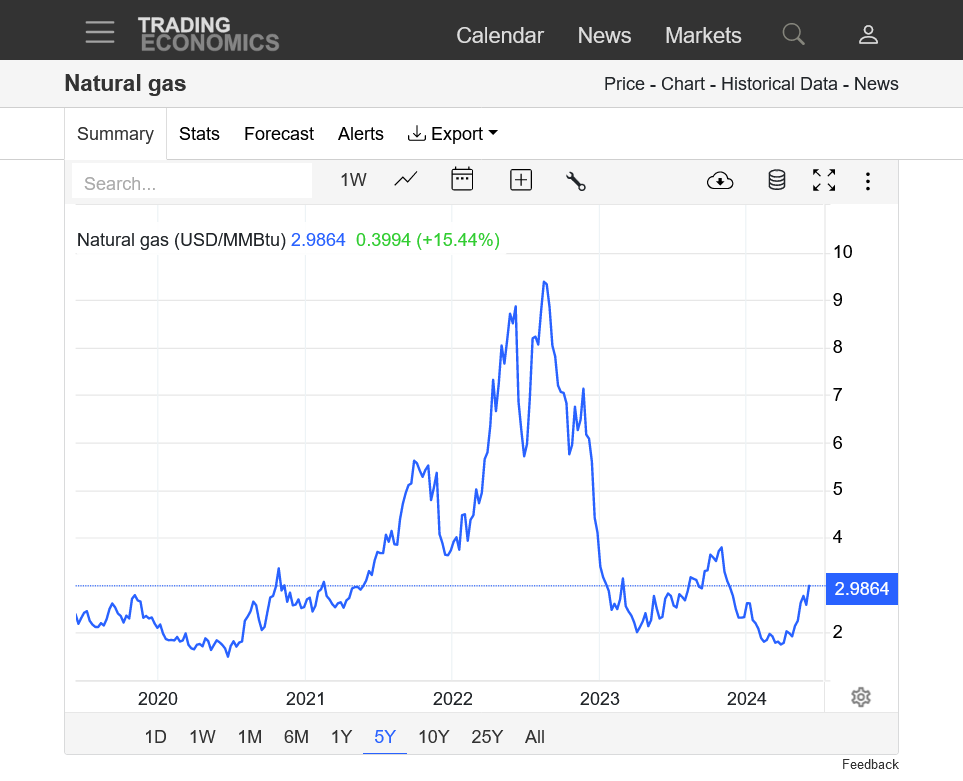
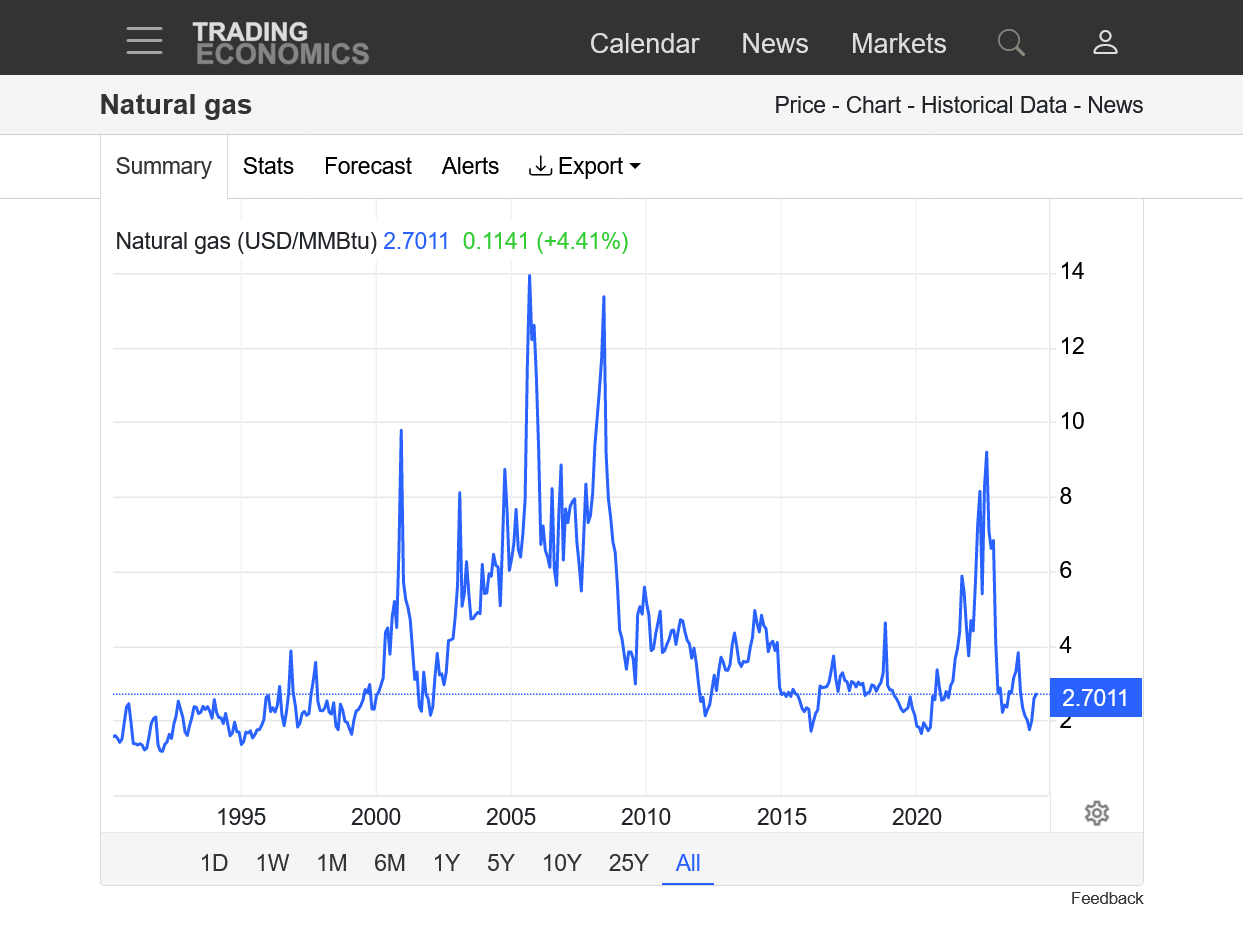
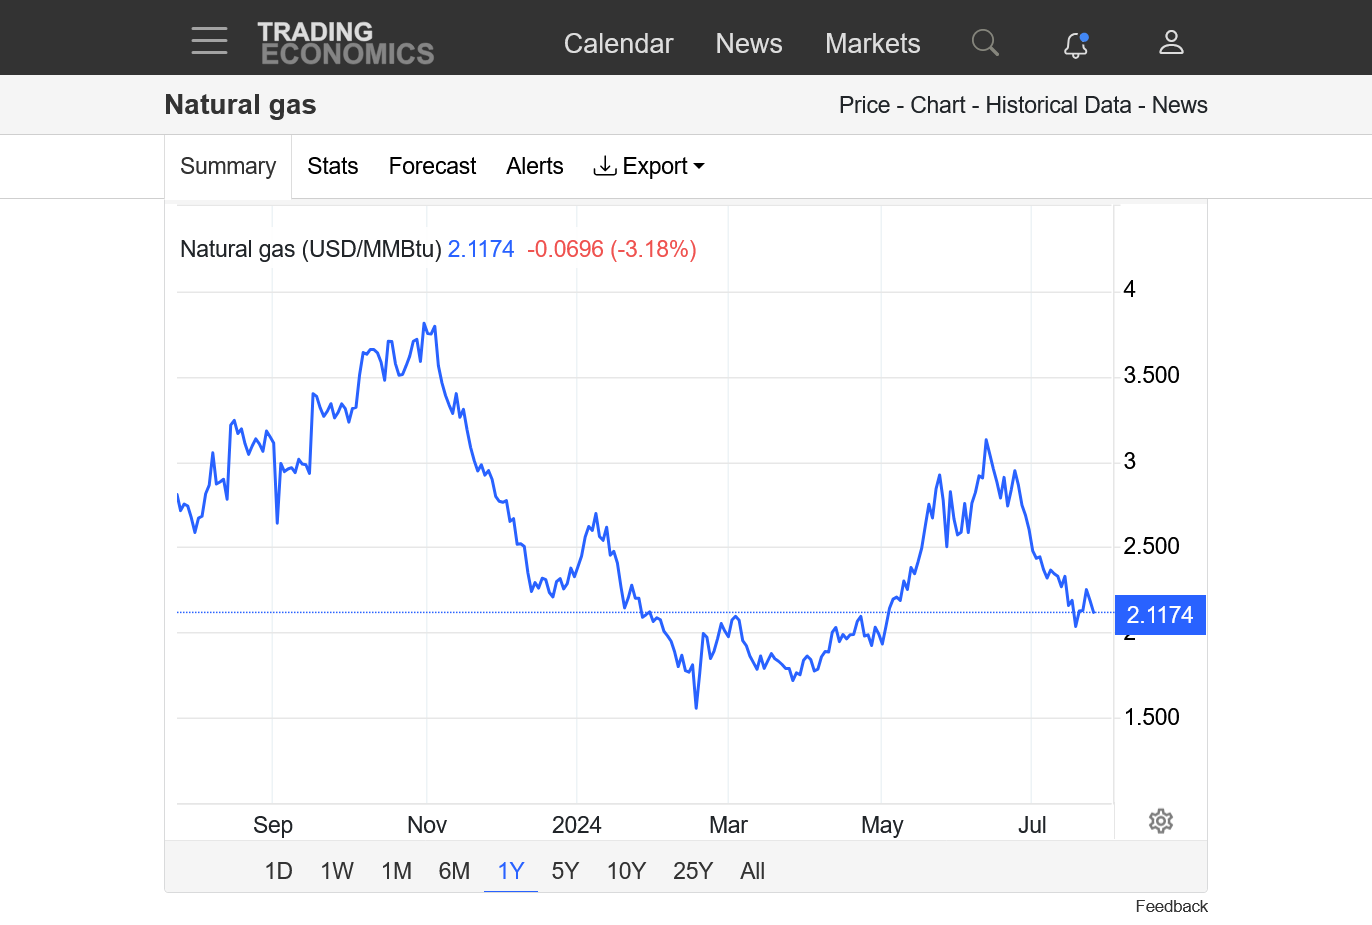
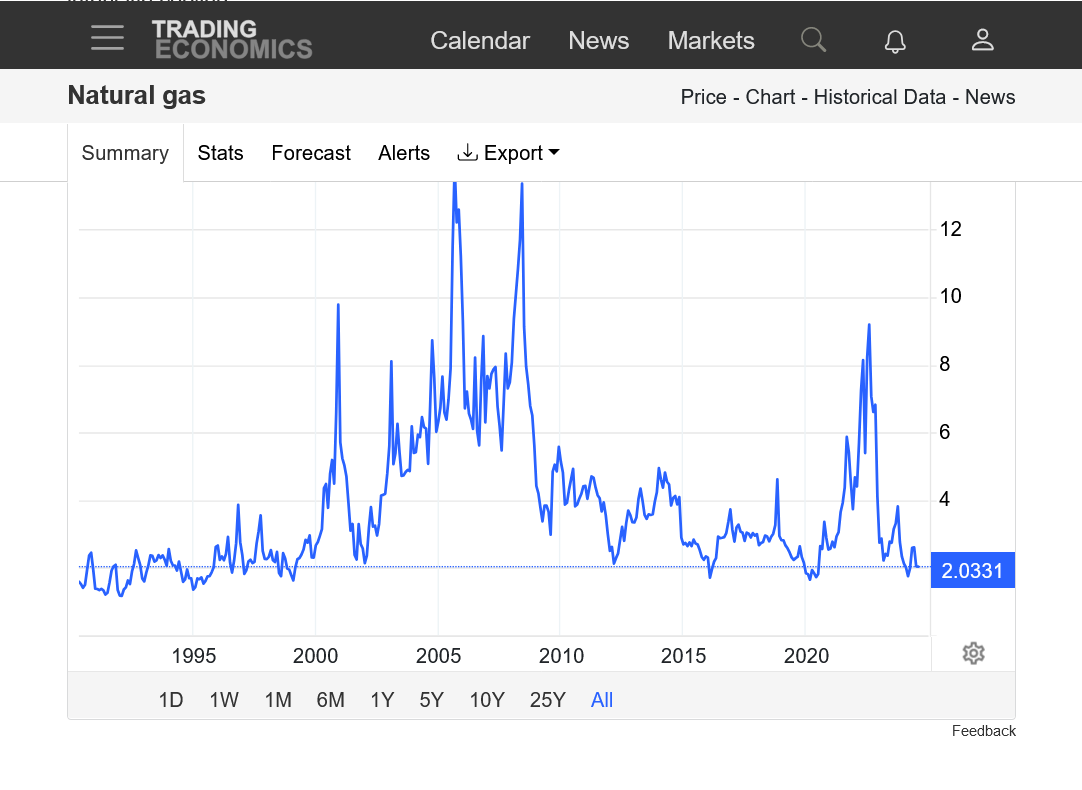
https://tradingeconomics.com/commodity/natural-gas
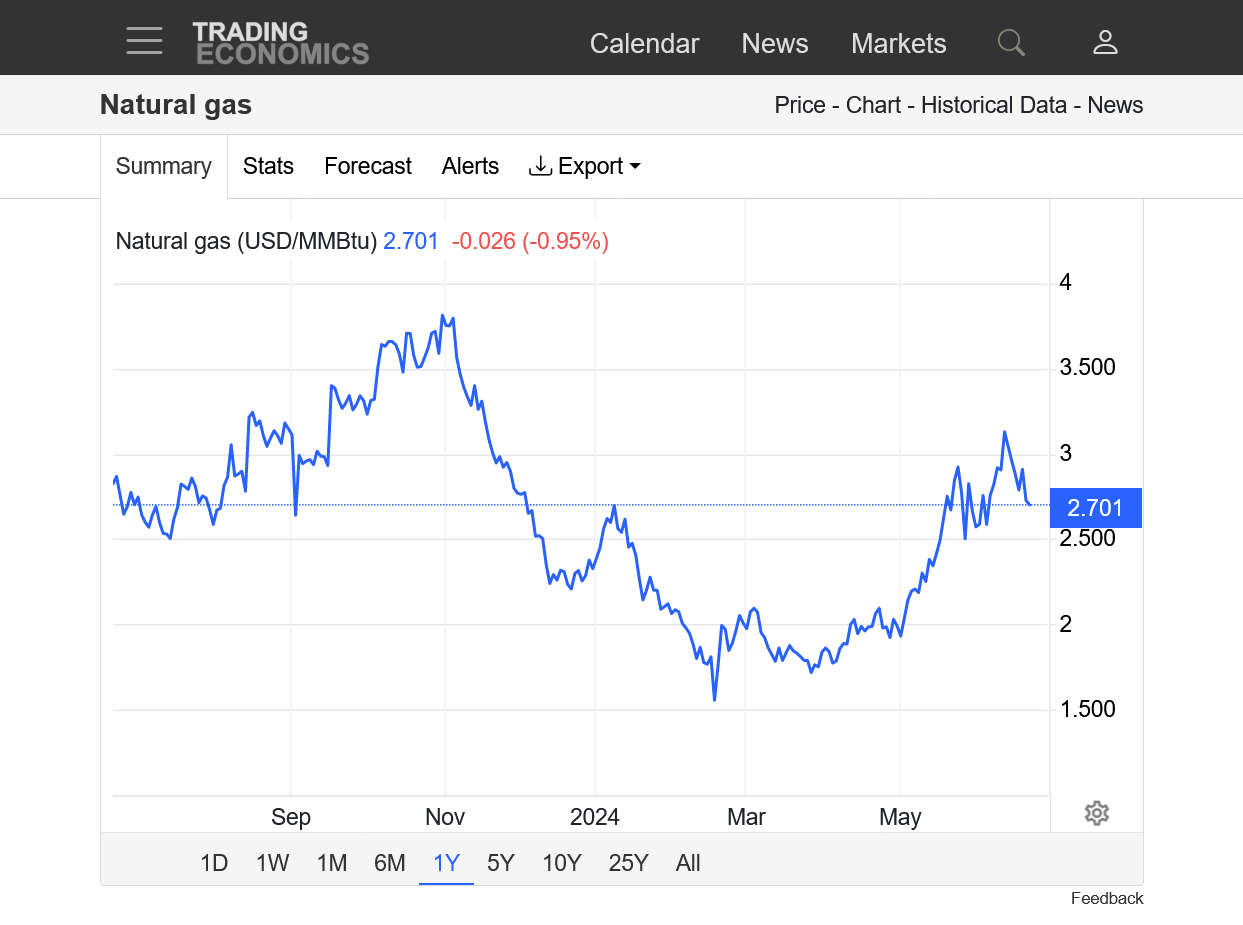
1. 1 month-chart is messed up as rollover from June to July NG last week caused distortion below. Showing a fake double top formation. The REAL, SINGLE top came on May 23rd!
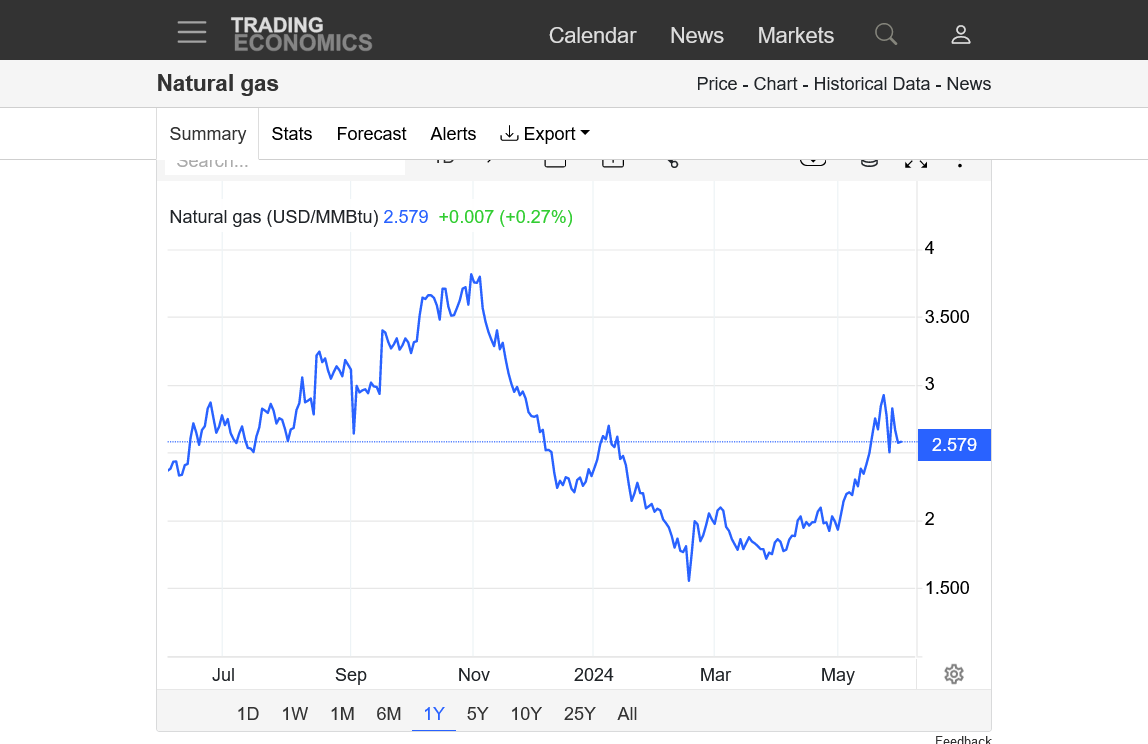
2. 1 year
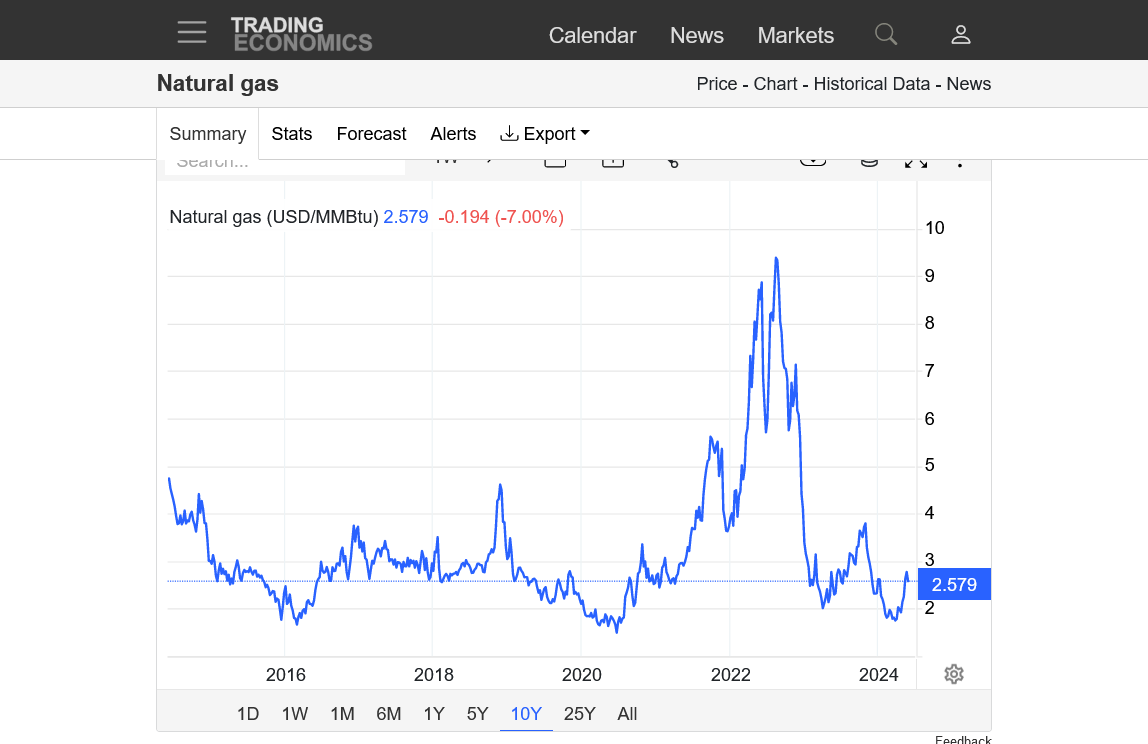
3. 10 years
4. 35 years


July Natural Gas had a gap higher on the open.
Now +$800/contract. I'm thinking this is the result of the pattern change described earlier this weekend/above.
NG strength continued overnight with a massive spike higher just before 8am, to over +$2,000/contract, followed by relentless selling.
Now below last night's open, only +$650/contract but not closing the gap higher.............yet.
Closing the gap would be a weak, "gap and crap" formation(weak because it's not near any sort of a top).
Regardless, it would negate the gap higher last night as an upside break away gap.
+++++++++++
The last 6z GEFS came out just before that spike higher and was +3 CDDS, which suggests a causation factor from weather trading. Big traders using fundamentals during the day session may have stepped in as they often do and overwhelmed overnight weather traders since then. Speculative with moderate confidence.
These were the last 4 runs of the GEFS, with the 6z run for CDDs in purple on the right.
Regardless of this, the crystal clear, potential pattern change to increasing heat in week 2 should be noted as CDDs ramp up.

NG went down to test the low from yesterdays open.........AND HELD.
So the gap higher remains open and valid as an upside breakaway gap, which is obviously pretty bullish.
Holding on the test is bullish.............but plunging from the 8am highs down to the retest of lows, shows how this is still featuring 2 sided trading.
NG, after holding the test at the top of last nights gap had soared back higher. Now +1,750/contract.
How would a trader trade this????
Somebody like me or Larry just can't stay long in a market like this trading weather.
Buying on the open last night was a great entry point. The spike higher overnight brought windfall profits real fast but who would risk all of that back to the break even point?
Or risk huge profits to the bottom of the gap, which would be a loss but in this case, have kept you in?
Somebody like me, would have put in a trailing stop last night and been taken out long before the spike down at the start of the day session.
And celebrating when ng plunged back to the open last night...........then really bummed now that ng has come back to near the highs overnight/very early morning.
One could have bought at the retest of top of the gap/lows from Sunday's open and would still be long here. For me, however this would still mean a trailing stop now because why would anybody risk another spike down and all the profits?
++++++++++++++++
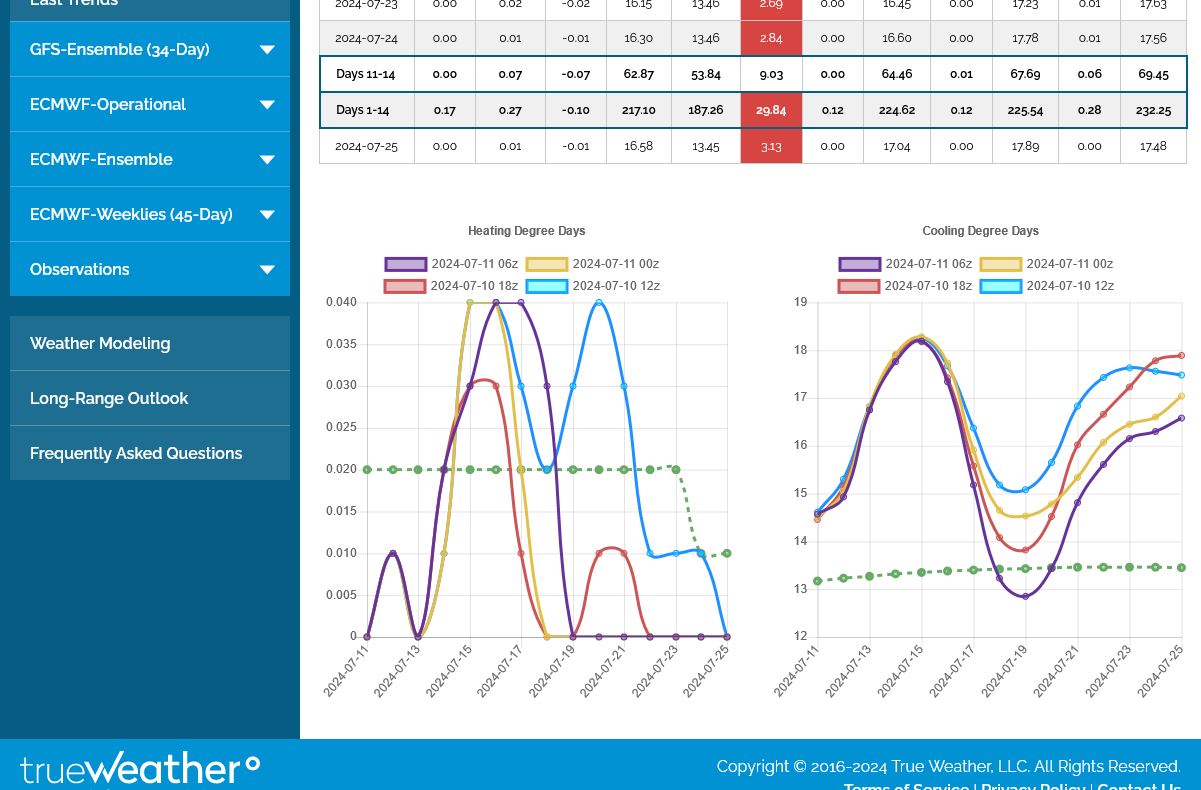
Elevated risk for significant heat in the 2nd half of June!!!!
These were the last 4 runs of the GEFS. CDDs are on the right. Green is the climatological average. The tan color was hottest and that early morning, 6z run caused the buying to peak at around 7am AFTER it was released.
NG was under relentless selling the rest of the day after that top.
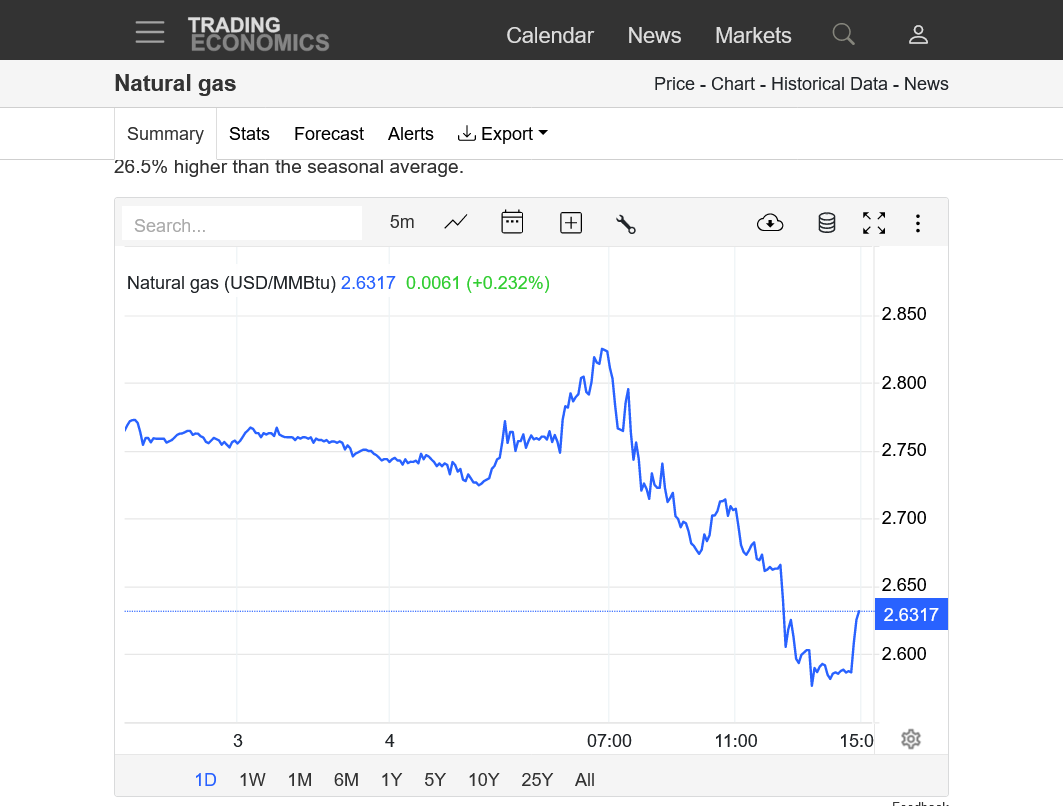
NG chart the past 24 hours:
The surge to over $2.8 around 7am came in response to the "hottest" 6z GEFS run guidance coming up the couple of hour before that. Guidance since then is NOT AS HOT but still well above average.
https://tradingeconomics.com/commodity/natural-gas

This just out 12z European Ensemble in purple on the right was +6 CDDs and has given NG a $600/contract pop higher:
https://tradingeconomics.com/commodity/natural-gas
NWS finally catching on to the hotter pattern change today:
https://www.cpc.ncep.noaa.gov/products/predictions/814day/index.php

As recent forecasts hinted at widespread summer heat developing later this month, natural gas futures advanced in early trading Wednesday. The July Nymex contract was up 5.7 cents to $2.643/MMBtu as of 8:42 a.m. ET. The July contract on Tuesday dropped 17.0 cents, erasing Monday’s 16.9-cent rally. EBW Analytics Group analyst Eli Rubin pointed to…
+++++++++++++
NG was its usual, volatile self the last 24 hours. Another spike down at 7am this morning.
1. 1 day
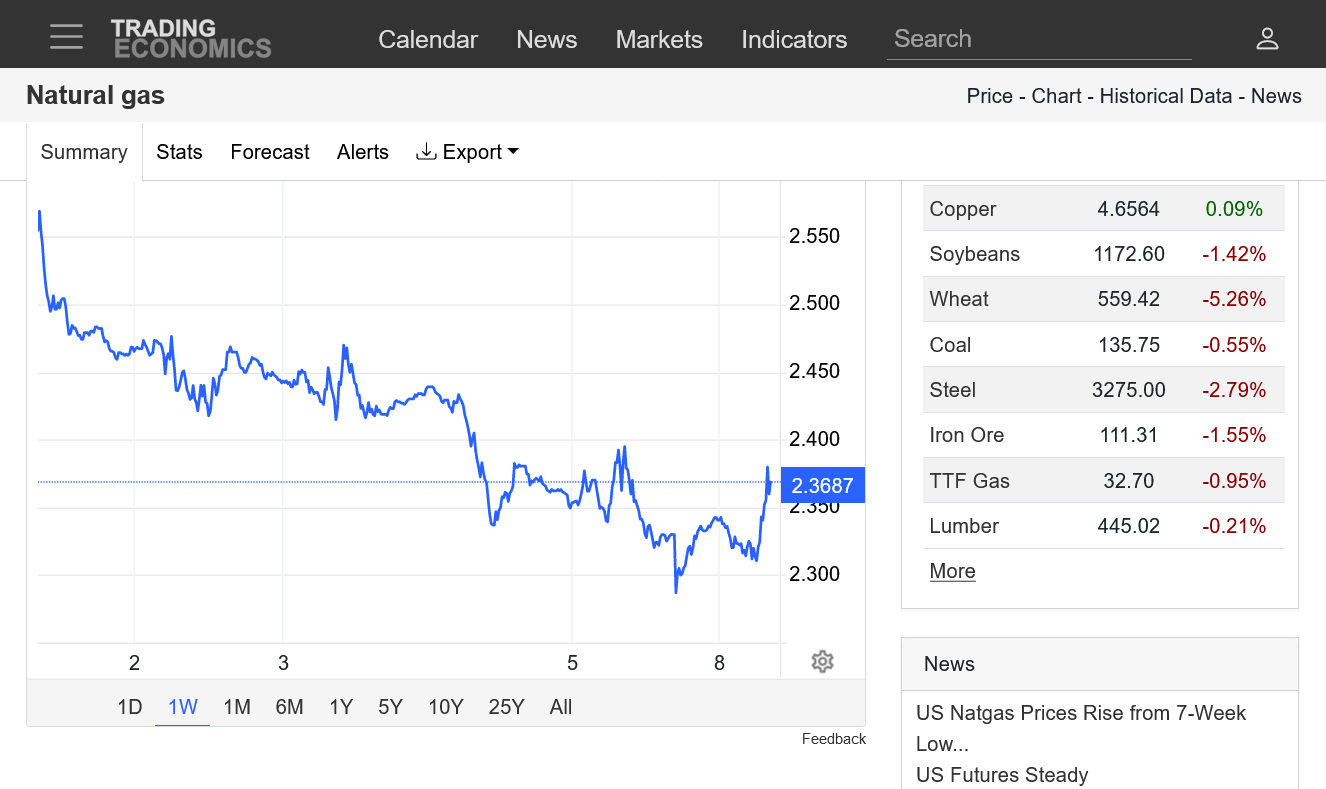
2. 1 week
https://tradingeconomics.com/commodity/natural-gas


+++++++++
YEP!
+98 Bcf. That's a huge injection! The blue line below continues to stay ABOVE the storage for any other year at this time of year!
https://ir.eia.gov/ngs/ngs.html
![]()
for week ending May 31, 2024 | Released: June 6, 2024 at 10:30 a.m. | Next Release: June 13, 2024
| Working gas in underground storage, Lower 48 states Summary text CSV JSN | |||||||||||||||||||||||||
|---|---|---|---|---|---|---|---|---|---|---|---|---|---|---|---|---|---|---|---|---|---|---|---|---|---|
| Historical Comparisons | |||||||||||||||||||||||||
| Stocks billion cubic feet (Bcf) | Year ago (05/31/23) | 5-year average (2019-23) | |||||||||||||||||||||||
| Region | 05/31/24 | 05/24/24 | net change | implied flow | Bcf | % change | Bcf | % change | |||||||||||||||||
| East | 575 | 538 | 37 | 37 | 543 | 5.9 | 458 | 25.5 | |||||||||||||||||
| Midwest | 681 | 652 | 29 | 29 | 596 | 14.3 | 530 | 28.5 | |||||||||||||||||
| Mountain | 218 | 210 | 8 | 8 | 134 | 62.7 | 130 | 67.7 | |||||||||||||||||
| Pacific | 273 | 267 | 6 | 6 | 160 | 70.6 | 225 | 21.3 | |||||||||||||||||
| South Central | 1,146 | 1,128 | 18 | 18 | 1,086 | 5.5 | 969 | 18.3 | |||||||||||||||||
| Salt | 330 | 324 | 6 | 6 | 315 | 4.8 | 295 | 11.9 | |||||||||||||||||
| Nonsalt | 817 | 804 | 13 | 13 | 772 | 5.8 | 674 | 21.2 | |||||||||||||||||
| Total | 2,893 | 2,795 | 98 | 98 | 2,520 | 14.8 | 2,312 | 25.1 | |||||||||||||||||
Totals may not equal sum of components because of independent rounding. | |||||||||||||||||||||||||
Working gas in storage was 2,893 Bcf as of Friday, May 31, 2024, according to EIA estimates. This represents a net increase of 98 Bcf from the previous week. Stocks were 373 Bcf higher than last year at this time and 581 Bcf above the five-year average of 2,312 Bcf. At 2,893 Bcf, total working gas is above the five-year historical range.
For information on sampling error in this report, see Estimated Measures of Sampling Variability table below.

Price bulls shook off a bearish government inventory report to send natural gas futures higher for a second day Thursday. At A Glance: EIA prints 98 Bcf injection Output at 98.5 Bcf/d National Avg. cash down 4.0 cents The July Nymex contract briefly sank to losses after the print but powered higher in the afternoon…
+++++
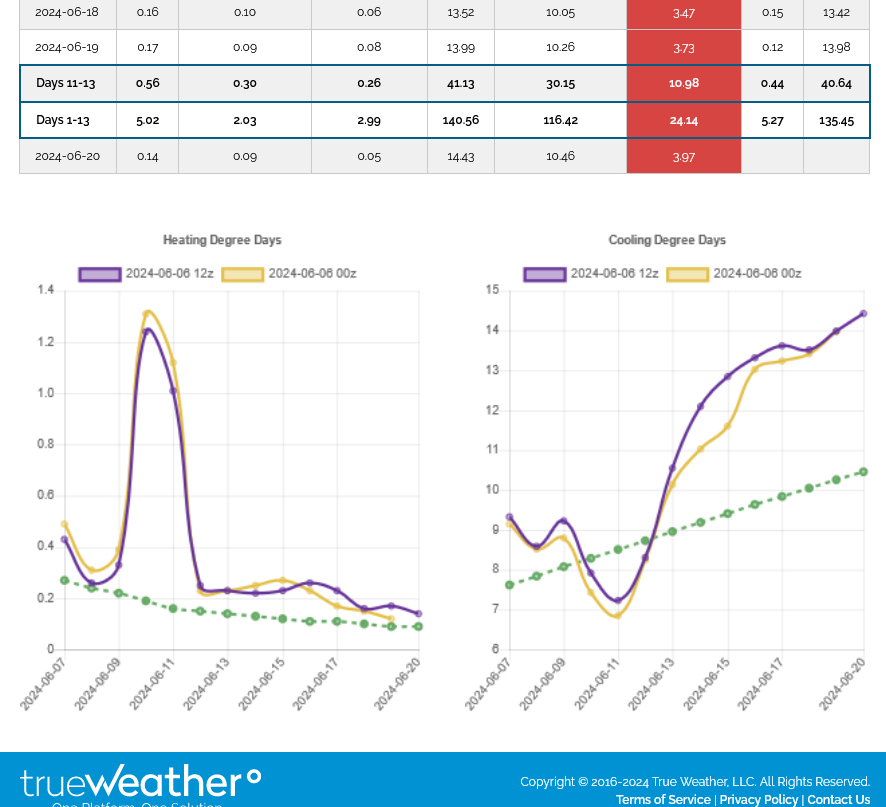
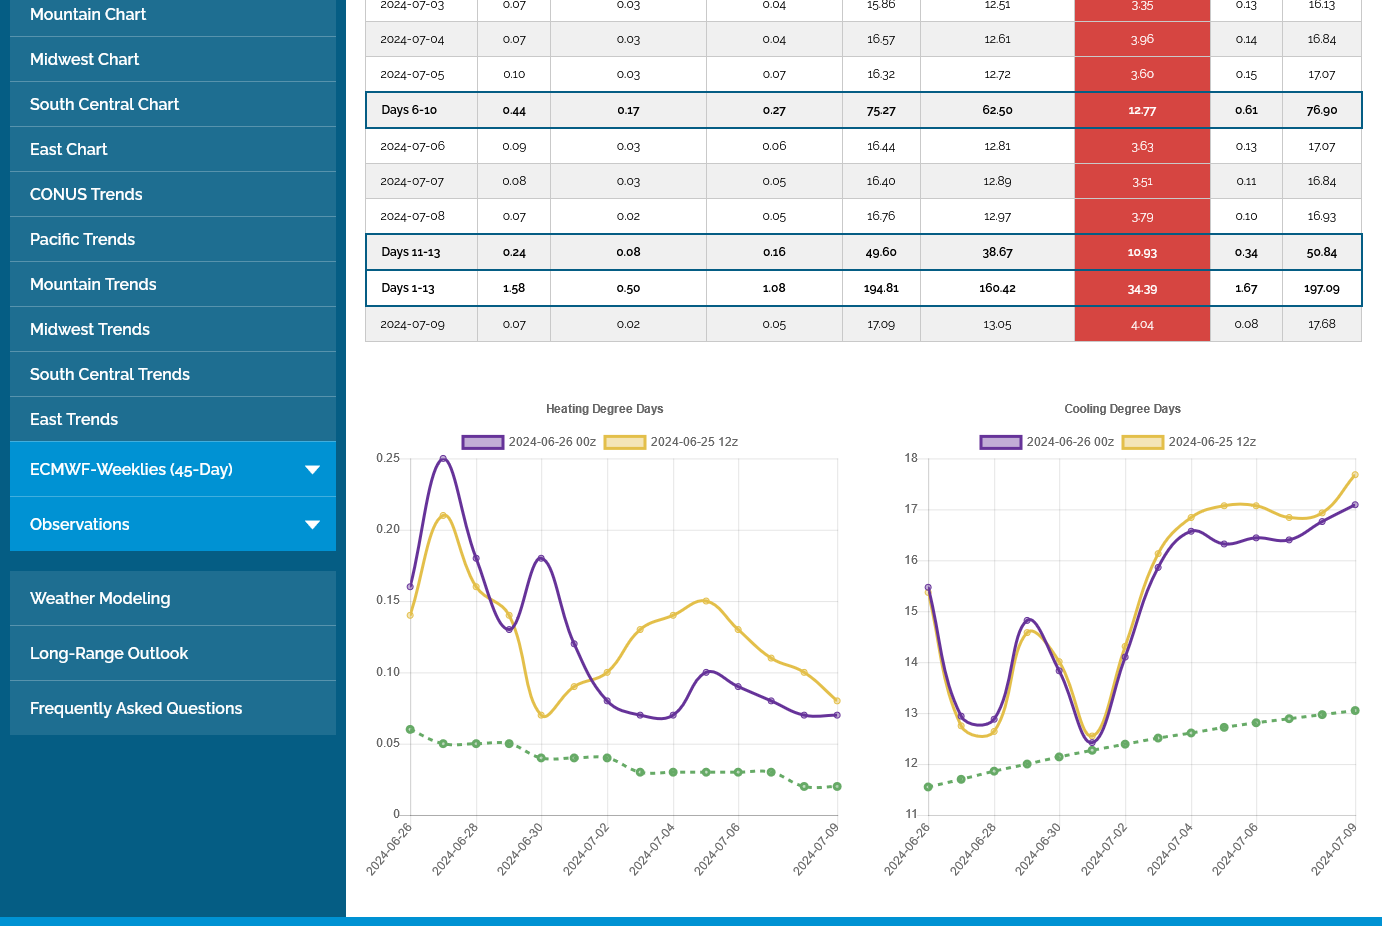
The last 12z European model was another +5 CDDs bullish. It's in purple on the right.
++++++++++++
Here come da heat!
Natural gas futures made a run toward the $3 level Friday, supported by weather forecasts showing late June could shape up to be one of the hottest on record.
+++++++++++++++++
This was the early Saturday morning European model. Even a bit hotter. CDDs for the last 0z run for the next 2 weeks were in purple on the right. The dashed green line is the average.

Last early Sunday 0z European model. Added another +2 CDDs. The main thing is the direction of the purple line on the right which is the TREND. A model run thats a bit less or more hot won't make much difference(other than a brief knee jerk reaction) when the PATTERN is STILL HOT. MUCH ABOVE the slowly increasing average in green. 
Not surprisingly, on the open, NGN gapped higher than the 2967 high on Friday, closed the gap to 2964 immediately then has stayed supported, making a high just above $3. Now at mid range, 2983, +650 from Friday's daytime close.
++++++++++
https://tradingeconomics.com/commodity/natural-gas
1. 1 month-solid uptrend
2. 1 year-major top 11-23, major low 2-24
3. 5 years-MAJOR top August 2022-then record supplies gushed in!!!!
4. 35 years- MAJOR tops 10-2005, then 6-2008. Then came the recession AND fracking.


I'm not predicting anything about the price the rest of the month, even though the weather is extremely bullish and still favors the upside.
We have a record amount of ng in storage for this time of year, prices have come a long way with this heat traded for a couple of weeks now. Seasonals that have been strong the past 2 months, weaken in the 2nd half of June.
These were temps last week for this Thursday's EIA. Above average in enough places to increase AC demand that results in more ng being burned to generate the electricity for it, so that the injection should be a bit weak vs average.
Just a reminder that last weeks injection was a bearish surprise above all guesses. Extreme temps usually rule for natural gas price determination but I wouldn't want to be long if the pattern shifted to cooler. No sign of that right now.
https://www.cpc.ncep.noaa.gov/products/tanal/temp_analyses.php
The last European model forecast was even HOTTER by +3 CDDs! Purple line on the right!

Last 12z GEFS came out -5 CDDs and ng crashed down, reversed 2300/ contract!
back higher for the day but still BELOW the open lat evening and below the highs on Friday.
this last 12z European model is still coming out just as hot as the early morning run, which is helping the modest come back but the upside is running out of steam up here!
Euro is out +1 CDD
https://x.com/NGInews/status/1800280174568800382/photo/1
Natural Gas Futures Briefly Top $3 as Record Warmth Seen for June; Cash Climbs: Natural gas futures shot above $3 in early trading Monday before falling back to earth as record hot forecasts for June got outweighed by concerns that the production spigot… http://
+++++++++++++
NO! NO! That's not what happened at all. The 12z GEFS came out -5 CDDs cooler/bearish (on the early, in house models running the data) which precipitated the huge spike down.
The European model came out hot +1 CDDs and we bounced back up.
This last 18z GEFS was +7 CDDs, so even hotter than the ones before the 12z runs.........and lookey here. NG is above $3, +$1,000 from the daytime close.
Natural gas analysts are issuing cautionary warnings to market bulls, still firmly in control and backed by substantial technical strength, as near-term softness is possible after futures crashed through $3.000/MMBtu resistance
++++++++++++
Overnight 0z Euro was +1.6 CDDs hotter again(purple line on the right-green is average-brown was the previous 12z run, 12 hours earlier), keeping us above $3 for now.
The midday, 12z GEFS came out -7 CDDs/bearish but the natural gas responded by going up 1,000/contract.
The later 12z European model early in the afternoon was +1.7 CDDs/bullish.
Last 0z European model was -2.5 CDDs but still the hottest model(purple-right). NG may be running out of steam up here. Other models not AS hot.

Natural gas futures pulled back early Wednesday after rallying above $3.00 on Tuesday as traders weighed the start-up of the long-delayed Mountain Valley Pipeline LLC (MVP) against record heat forecasts.
As mentioned earlier in the week, ng appears to be running out of steam up here even with forecasts remaining pretty hot.
EIA in a few minutes with the usual knee jerk price spike upon the release.
++++++++++
+74 Bcf. Bearish! according to the market.
However, the blue lines gap above the previous record storage is closing a bit.
![]()
for week ending June 7, 2024 | Released: June 13, 2024 at 10:30 a.m. | Next Release: June 21, 2024
| Working gas in underground storage, Lower 48 states Summary text CSV JSN | |||||||||||||||||||||||||
|---|---|---|---|---|---|---|---|---|---|---|---|---|---|---|---|---|---|---|---|---|---|---|---|---|---|
| Historical Comparisons | |||||||||||||||||||||||||
| Stocks billion cubic feet (Bcf) | Year ago (06/07/23) | 5-year average (2019-23) | |||||||||||||||||||||||
| Region | 06/07/24 | 05/31/24 | net change | implied flow | Bcf | % change | Bcf | % change | |||||||||||||||||
| East | 603 | 575 | 28 | 28 | 568 | 6.2 | 485 | 24.3 | |||||||||||||||||
| Midwest | 712 | 688 | R | 24 | 24 | 624 | 14.1 | 558 | 27.6 | ||||||||||||||||
| Mountain | 224 | 218 | 6 | 6 | 145 | 54.5 | 138 | 62.3 | |||||||||||||||||
| Pacific | 276 | 273 | 3 | 3 | 173 | 59.5 | 232 | 19.0 | |||||||||||||||||
| South Central | 1,159 | 1,146 | 13 | 13 | 1,102 | 5.2 | 989 | 17.2 | |||||||||||||||||
| Salt | 336 | 330 | 6 | 6 | 323 | 4.0 | 298 | 12.8 | |||||||||||||||||
| Nonsalt | 823 | 817 | 6 | 6 | 779 | 5.6 | 692 | 18.9 | |||||||||||||||||
| Total | 2,974 | 2,900 | R | 74 | 74 | 2,610 | 13.9 | 2,401 | 23.9 | ||||||||||||||||
| R=Revised. Working gas stocks were revised to reflect resubmissions of data during the five-week period from May 3, 2024, to May 31, 2024, increasing stocks by 6 Bcf to 9 Bcf for each week during this period. The reported revisions caused the stocks for May 31, 2024, to change from 2,893 Bcf to 2,900 Bcf, and working gas stocks for the week ending May 24, 2024, changed from 2,795 Bcf to 2,804 Bcf. As a result, the implied net change between the weeks ending May 31, 2024, and May 24, 2024, changed from 98 Bcf to 96 Bcf. More information about the revised working gas levels can be found at: https://ir.eia.gov/ngs/ngshistory.xls. Totals may not equal sum of components because of independent rounding. | |||||||||||||||||||||||||
Working gas in storage was 2,974 Bcf as of Friday, June 7, 2024, according to EIA estimates. This represents a net increase of 74 Bcf from the previous week. Stocks were 364 Bcf higher than last year at this time and 573 Bcf above the five-year average of 2,401 Bcf. At 2,974 Bcf, total working gas is above the five-year historical range.
For information on sampling error in this report, see Estimated Measures of Sampling Variability table below.
The last 0z European Ensemble was -2.4 CDDs. Still hot but note the direction in late week 2, converging towards the rising green line(average) and away from near record CDDs for this time of year.
Also note that the price of NG ran out of steam a couple of days ago because of this.
Near record CDDs in the forecast for the 2nd half of June was the driving force to get us above $3. To keep us above $3 with this much ng in storage, at a time of year that features short term tops, LESS HEAT is LESS BULLISH.
If we were suddenly shifting from a bearish, cool pattern to the current updated forecast, it would be MUCH MORE BULLISH.
Changes compared to EXPECTATIONS determine market direction more than anything!
These were the last 4 solutions of the GEFS model(American model) purple being the latest 12z run around midday that dropped almost -8 CDDS from the previous run. This is for the entire 48 states.
I don't buy this. It's an OUTLIER and NOT a trend that will continue. In my opinion.
I believe this to be at least partly responsible for the weakness in ng prices the last several hours.
The European model was also cooler but by -3.4 CDDS.

++++++++
I wondered if this could be from shifting the heat ridge away from the East Coast into the Midwest.
WOW! It's actually causes CDDs to drop just below average in the Midwest at the end of June, below! If that happens it will be a pleasant surprise but will still likely mean most dry weather in the ECB.
Pretty big gap lower for NG on the open.
Also a WEEKLY gap lower!
Not because the weather pattern is suddenly much cooler
1. This was the last 12z European Ensemble model in purple on the right for CDDs. Green is average.
There is LESS heat at the end of week 1/early week 2 but then CDDs start climbing again.
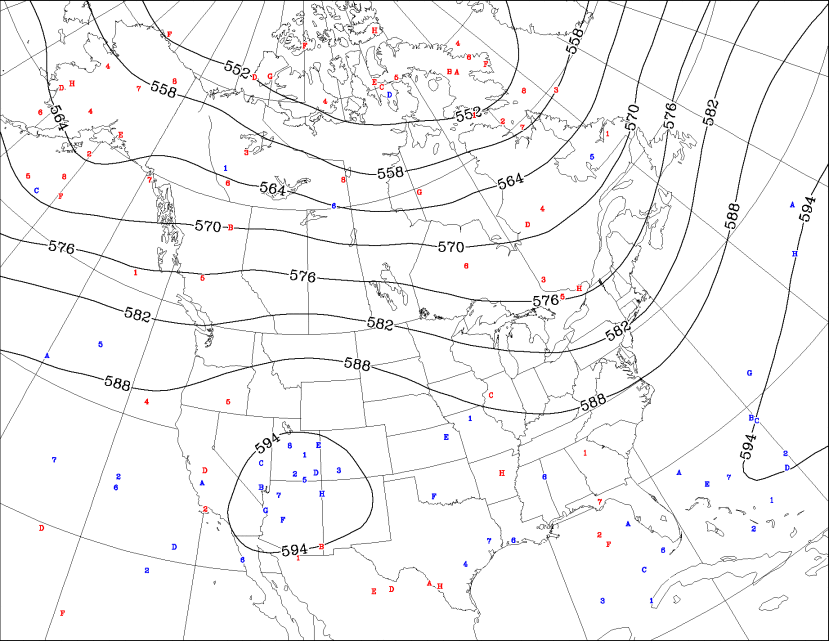
2. With a massive heat ridge building at the end of week 2. That is NOT a bearish 500 mb map below.

Gap lower stays open after a very early morning, feeble attempt to retest the bottom of the gap(from last nights open).
So it's a downside breakaway gap.
If filled, it would be a gap and crap with positive selling exhaustion implications WHEN NEAR A SIGNIFICANT LOW..........which this IS NOT.
1. 1 day. Gap is from around 2870(Fri and weekly low) to 2848(Mon and new week high)
2. 1 month. Major high June 11(6 days ago) market ran out of steam/buyers. Couldn't react bullish any more to hot forecasts that were bombarding this market for weeks.
3. 5 year: Major top last Fall and MEGA top August 2022, before new supplies massively picked up from high price incentive
4. 35 years. Extreme volatility and spikes up BEFORE massive fracking gushed copious ng supplies the last 15 years.
https://tradingeconomics.com/commodity/natural-gas


Overnight guidance was HOTTER and gave us a spike higher earlier this morning but ng is struggling to hold gains.
Purple line on the right is the last 0z European for CDDs at +2 vs the previous run. There is an extremely high chance for this heat dome to last well into July........but the market has known this forever.
The last 12z EE model in purple on the right was -3 CDDs but anything but bearish overall!

I was tied up earlier and would have posted this several hours ago.
The E model was a whopping -8 CDDs early this morning!

The EIA report is delayed by 1 day because of the holiday.
These were the temps. Hot West but COOL EAST, where the most people live. So the injection could be pretty robust for mid June.
https://www.cpc.ncep.noaa.gov/products/tanal/temp_analyses.php

NG has been reacting to less heat in the forecast the last 2 days.
The EIA report just released caused the usual volatility for a few minutes...........then resumed going lower. NG in storage on the blue line below, remain at record levels for mid-June, though the surplus has eroded slightly. This heat wave WILL erode that surplus, possibly back into the top of the 5 year range. However, prices spiked higher LAST WEEK, when the market dialed that in well in advance, as it usually does.
![]()
for week ending June 14, 2024 | Released: June 21, 2024 at 10:30 a.m. | Next Release: June 27, 2024
| Working gas in underground storage, Lower 48 states Summary text CSV JSN | |||||||||||||||||||||||||
|---|---|---|---|---|---|---|---|---|---|---|---|---|---|---|---|---|---|---|---|---|---|---|---|---|---|
| Historical Comparisons | |||||||||||||||||||||||||
| Stocks billion cubic feet (Bcf) | Year ago (06/14/23) | 5-year average (2019-23) | |||||||||||||||||||||||
| Region | 06/14/24 | 06/07/24 | net change | implied flow | Bcf | % change | Bcf | % change | |||||||||||||||||
| East | 631 | 603 | 28 | 28 | 592 | 6.6 | 510 | 23.7 | |||||||||||||||||
| Midwest | 736 | 712 | 24 | 24 | 651 | 13.1 | 585 | 25.8 | |||||||||||||||||
| Mountain | 230 | 224 | 6 | 6 | 154 | 49.4 | 145 | 58.6 | |||||||||||||||||
| Pacific | 279 | 276 | 3 | 3 | 187 | 49.2 | 235 | 18.7 | |||||||||||||||||
| South Central | 1,168 | 1,159 | 9 | 9 | 1,119 | 4.4 | 1,008 | 15.9 | |||||||||||||||||
| Salt | 337 | 336 | 1 | 1 | 328 | 2.7 | 300 | 12.3 | |||||||||||||||||
| Nonsalt | 831 | 823 | 8 | 8 | 790 | 5.2 | 708 | 17.4 | |||||||||||||||||
| Total | 3,045 | 2,974 | 71 | 71 | 2,702 | 12.7 | 2,484 | 22.6 | |||||||||||||||||
Totals may not equal sum of components because of independent rounding. | |||||||||||||||||||||||||
Working gas in storage was 3,045 Bcf as of Friday, June 14, 2024, according to EIA estimates. This represents a net increase of 71 Bcf from the previous week. Stocks were 343 Bcf higher than last year at this time and 561 Bcf above the five-year average of 2,484 Bcf. At 3,045 Bcf, total working gas is above the five-year historical range.
For information on sampling error in this report, see Estimated Measures of Sampling Variability table below.
Note: The shaded area indicates the range between the historical minimum and maximum values for the weekly series from 2019 through 2023. The dashed vertical lines indicate current and year-ago weekly periods.
++++++++++++++++++++++++
The gap lower on Sunday Night(from less hot forecasts) WAS filled when weather models turned even HOTTER on Wednesday. However, weather models have turned MUCH LESS HOT, since then, indicating that changes in the weather forecast are the main driving force NOT technical signatures on price charts. The weather MAKES the signatures. The weather changes FIRST, then the market responds.
Regardless, the June 11 spike high from the most extreme heat being dialed in to the price, marks a very significant, short term top.
We're actually as some decent support down here, around the Jan highs but the weather is what matters most.
https://tradingeconomics.com/commodity/natural-gas
1. 1 month
2. 1 year
3. Max-35 years

NG forecasts morphed less hot for several days which put pressure on natural gas. Overnight, the last 0z European Ensemble added +3 CDDs(purple/right). Note the dip down in week 1 from less heat, then the return of major heat in week 2. The week 2 and beyond forecast is extremely uncertain right now. There WILL BE a big DOME of rain suppressing upper level warmth, lower level HEAT.........SOMEWHERE. The location is extremely uncertain and a key to EVERYTHING.
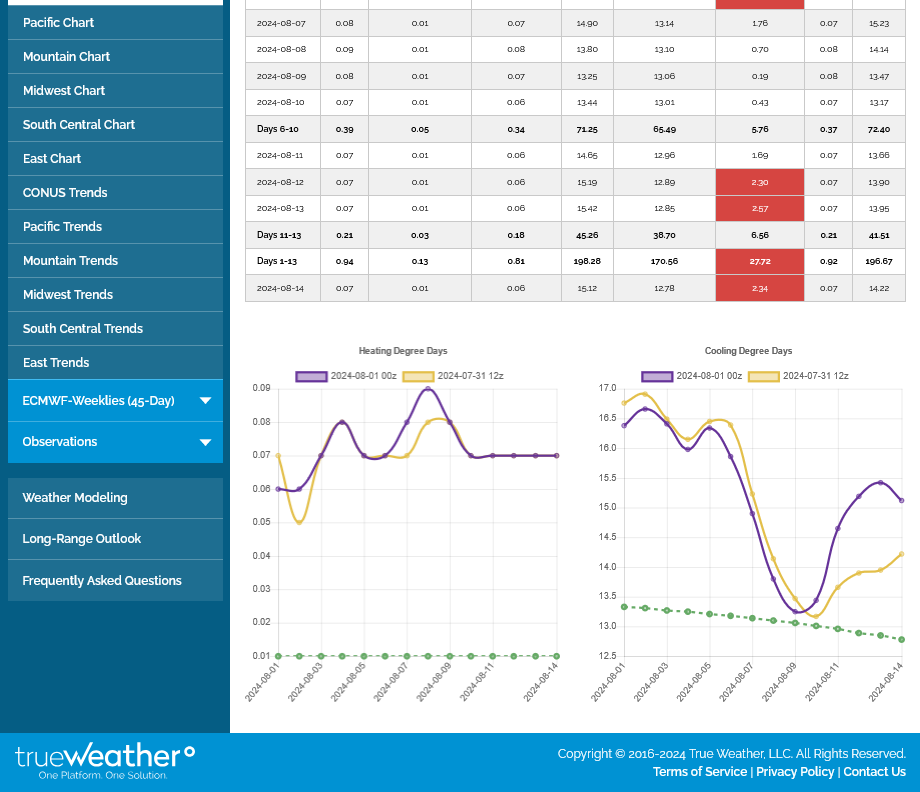
Temps for this Thursday's EIA. Should be a smallish build vs average for this time of year because heat waves increase AC use, which comes from electricity generated in a big way from burning natural gas at power plants.
Power plants send this out to the "electrical grid"
https://www.cpc.ncep.noaa.gov/products/tanal/temp_analyses.php

https://www.cfr.org/backgrounder/how-does-us-power-grid-work

Not much chance that the graph below will happen(renewables passing up ng in 2030) but at least they acknowledge the truth........a net zero, no fossil fuel future is a complete fairy tale:

+++++++++++
Here's the reality based on the physical laws of energy/physics, economics and grid dynamics:
https://www.marketforum.com/forum/topic/94557/
There Is No Energy Transition, Just Energy Addition
https://wattsupwiththat.com/2023/03/12/there-is-no-energy-transition-just-energy-addition/
While wind and solar power are taking a larger piece out of a growing world primary energy pie, fossil fuels are expected to have more absolute growth through 2050.

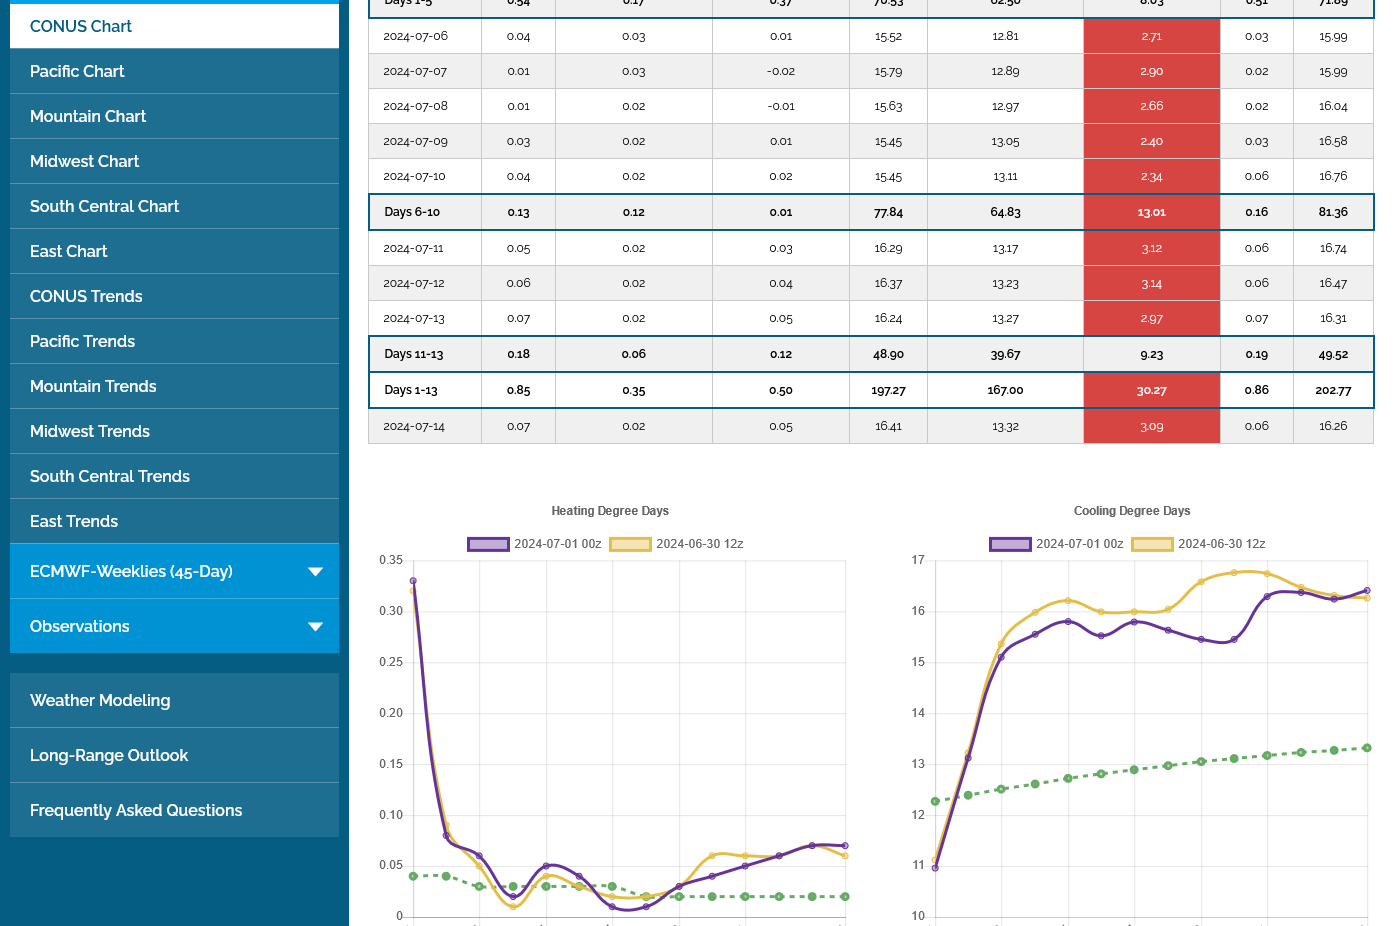
The last 0z European model was +2 CDDs, which gave us a pop higher until just after 5am, then the less hot 6z GEFS came out -5 CDDs vs the previous run and we dropped $800/contract in short order.
1. European model. Purple on the right is the last run. Comes out every 12 hours. +2 CDDs on late week 2 heat!
2. GEFS model. Purple on the right is the last run. Comes out every 6 hours. -5 CDDs......on late week 2 LESS heat!


This last 0z EE was -2 CDDs LESS bullish. NOT bearish, just LESS bullish.
July natural gas futures moved decidedly lower in early trading Wednesday as the market took profits ahead of the contract’s expiration at the close of business.
+++++++++++++++++
As mentioned several hours ago........the EE was LESS bullish.
Major heat last week, so a wimpy injection likely!
Wimpy injection for late June, small spike up/reaction.
Note that the surplus continues to be eroded. The blue line for storage is now just barely above all previous years in late June:
![]()
for week ending June 21, 2024 | Released: June 27, 2024 at 10:30 a.m. | Next Release: July 3, 2024
| Working gas in underground storage, Lower 48 states Summary text CSV JSN | |||||||||||||||||||||||||
|---|---|---|---|---|---|---|---|---|---|---|---|---|---|---|---|---|---|---|---|---|---|---|---|---|---|
| Historical Comparisons | |||||||||||||||||||||||||
| Stocks billion cubic feet (Bcf) | Year ago (06/21/23) | 5-year average (2019-23) | |||||||||||||||||||||||
| Region | 06/21/24 | 06/14/24 | net change | implied flow | Bcf | % change | Bcf | % change | |||||||||||||||||
| East | 646 | 631 | 15 | 15 | 616 | 4.9 | 537 | 20.3 | |||||||||||||||||
| Midwest | 753 | 736 | 17 | 17 | 677 | 11.2 | 614 | 22.6 | |||||||||||||||||
| Mountain | 237 | 230 | 7 | 7 | 163 | 45.4 | 152 | 55.9 | |||||||||||||||||
| Pacific | 283 | 279 | 4 | 4 | 200 | 41.5 | 244 | 16.0 | |||||||||||||||||
| South Central | 1,179 | 1,168 | 11 | 11 | 1,127 | 4.6 | 1,023 | 15.2 | |||||||||||||||||
| Salt | 334 | 337 | -3 | -3 | 330 | 1.2 | 301 | 11.0 | |||||||||||||||||
| Nonsalt | 845 | 831 | 14 | 14 | 797 | 6.0 | 722 | 17.0 | |||||||||||||||||
| Total | 3,097 | 3,045 | 52 | 52 | 2,783 | 11.3 | 2,569 | 20.6 | |||||||||||||||||
Totals may not equal sum of components because of independent rounding. | |||||||||||||||||||||||||
Working gas in storage was 3,097 Bcf as of Friday, June 21, 2024, according to EIA estimates. This represents a net increase of 52 Bcf from the previous week. Stocks were 314 Bcf higher than last year at this time and 528 Bcf above the five-year average of 2,569 Bcf. At 3,097 Bcf, total working gas is above the five-year historical range.
For information on sampling error in this report, see Estimated Measures of Sampling Variability table below.
With the earliest Category 4 hurricane ever threatening the Atlantic, as well as weather models shedding demand over the weekend, natural gas futures continued to slide in early trading Monday.
++++++++++++
0z European model was -5 CDDs LESS BULLISH!
Purple line on the right. Note its still WELL ABOVE the average green line.
If this line last week had been BELOW the green line and this was the solution, the market would interpret that as MUCH MORE BULLISH vs expectations and we'd be higher with the same exact current forecast for the next 2 weeks.
Should be a smaller than usual injection on Friday vs average for the last week in June thanks to this heat. Electricity for AC use is generated by burning natural gas.
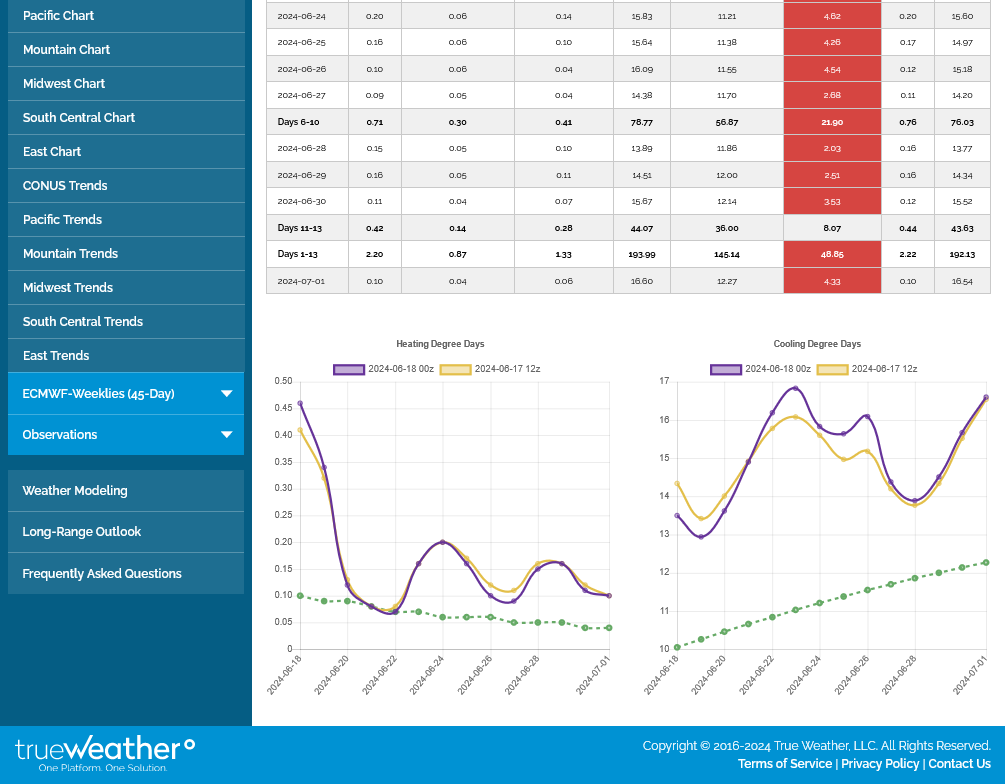
The last 12z European model CDDs in purple on the right was unchanged for the previous run. CDDs are still WELL ABOVE average but NOT AS hot as forecasts a couple of weeks ago, so in a relative sense, LESS bullish.
If we'd been bearishly cool 2 weeks ago and it turned this hot, it would be BULLISH.
+++++++++++++++++
Seasonals this time of year/late June/early July are WEAK but early July is often a Summer bottom:
https://charts.equityclock.com/natural-gas-futures-ng-seasonal-chart
To become BULLISH again, we really need this upper level ridge forecast for 2 weeks from now to shift farther EAST and south where the most people live. Its also where alot of the long range forecasts for July had it, so there is LESS heat than expected in these shorter range models.
![]()
+32 Bcf was a small injection for this time of year but expected from the heat that week.
A cooler July than predicted weeks ago in the highest population areas(but still very warm) has been LESS bullish and pressured prices, along with seasonals that often bottom in early July.
Note: The blue line on the graph below remains at record high supplies but the record surplus was eroded by the June heat.
for week ending June 28, 2024 | Released: July 3, 2024 at 12:00 p.m. | Next Release: July 11, 2024
| Working gas in underground storage, Lower 48 states Summary text CSV JSN | |||||||||||||||||||||||||
|---|---|---|---|---|---|---|---|---|---|---|---|---|---|---|---|---|---|---|---|---|---|---|---|---|---|
| Historical Comparisons | |||||||||||||||||||||||||
| Stocks billion cubic feet (Bcf) | Year ago (06/28/23) | 5-year average (2019-23) | |||||||||||||||||||||||
| Region | 06/28/24 | 06/21/24 | net change | implied flow | Bcf | % change | Bcf | % change | |||||||||||||||||
| East | 660 | 646 | 14 | 14 | 637 | 3.6 | 559 | 18.1 | |||||||||||||||||
| Midwest | 779 | 758 | R | 21 | 21 | 699 | 11.4 | 639 | 21.9 | ||||||||||||||||
| Mountain | 239 | 236 | R | 3 | 3 | 171 | 39.8 | 158 | 51.3 | ||||||||||||||||
| Pacific | 282 | 283 | -1 | -1 | 213 | 32.4 | 251 | 12.4 | |||||||||||||||||
| South Central | 1,174 | 1,178 | R | -4 | -4 | 1,139 | 3.1 | 1,031 | 13.9 | ||||||||||||||||
| Salt | 326 | 334 | -8 | -8 | 329 | -0.9 | 297 | 9.8 | |||||||||||||||||
| Nonsalt | 848 | 845 | 3 | 3 | 811 | 4.6 | 735 | 15.4 | |||||||||||||||||
| Total | 3,134 | 3,102 | R | 32 | 32 | 2,859 | 9.6 | 2,638 | 18.8 | ||||||||||||||||
| R=Revised. The reported revisions caused the stocks for June 21, 2024 to change from 3,097 Bcf to 3,102 Bcf. As a result, the implied net change between the weeks ending June 14 and June 21 changed from 52 Bcf to 57 Bcf. Totals may not equal sum of components because of independent rounding. | |||||||||||||||||||||||||
Working gas in storage was 3,134 Bcf as of Friday, June 28, 2024, according to EIA estimates. This represents a net increase of 32 Bcf from the previous week. Stocks were 275 Bcf higher than last year at this time and 496 Bcf above the five-year average of 2,638 Bcf. At 3,134 Bcf, total working gas is above the five-year historical range.
For information on sampling error in this report, see Estimated Measures of Sampling Variability table below.
Note: The shaded area indicates the range between the historical minimum and maximum values for the weekly series from 2019 through 2023. The dashed vertical lines indicate current and year-ago weekly periods.
++++++++++++++++++++++++++++
Temps last week for the next EIA report. Much cooler northern half of the country. Hot South and West.
https://www.cpc.ncep.noaa.gov/products/tanal/temp_analyses.php
The lows are likely in for natural gas!
After gapping lower Sunday evening, at the end of a move down, ng filled the gap for a powerful gap and crap selling exhaustion.
Confirmed when 0z European model came out a whopping -7 CDDS BEARISH very early this morning but it was unable to generate enough selling to go lower.
Extreme bearish (weather) news with no bearish reaction at the end of big move lower = selling exhaustion = no new aggressive sellers left.
1. As mentioned several times now, early July is the time frame for a seasonal low.
2. The massive surplus above the previous record high in supply was eroded in June.......though supplies are still very ample.
3. The recent forecasts have been LESS and LESS bullish compared to record bullish a month ago but still NOT bearish. The last, current LESS bullish forecast is still NOT bearish.
4. Prices have plunged almost 8,000/contract in less than 1 month. It's way overdone/oversold.
The last EE is in purple on the right. Not AS HOT, especially in week 2.

+++++++++++++++++++++++
1. 1 week
2. 1 month
3. 1 year
4. 35 years
https://tradingeconomics.com/commodity/natural-gas\


The weather forecast keeps getting cooler/less bullish. This is making it tough for natural gas to get any traction after the early week, technical upside reversal, gap and crap selling exhaustion low.
Last 0z European Ensemble in purple on the right are the CDDs. 
Amazing. The weather models have just kept getting less and less hot, almost every run this week. These were the last GEFS solutions, with the purple being the last 6z run on the right for CDDs.
Bearish number +65 Bcf. Increasing the record surplus a bit as shown with the blue line on the graph below.
https://ir.eia.gov/ngs/ngs.html
![]()
for week ending July 5, 2024 | Released: July 11, 2024 at 10:30 a.m. | Next Release: July 18, 2024
| Working gas in underground storage, Lower 48 states Summary text CSV JSN | |||||||||||||||||||||||||
|---|---|---|---|---|---|---|---|---|---|---|---|---|---|---|---|---|---|---|---|---|---|---|---|---|---|
| Historical Comparisons | |||||||||||||||||||||||||
| Stocks billion cubic feet (Bcf) | Year ago (07/05/23) | 5-year average (2019-23) | |||||||||||||||||||||||
| Region | 07/05/24 | 06/28/24 | net change | implied flow | Bcf | % change | Bcf | % change | |||||||||||||||||
| East | 682 | 660 | 22 | 22 | 650 | 4.9 | 576 | 18.4 | |||||||||||||||||
| Midwest | 800 | 779 | 21 | 21 | 719 | 11.3 | 661 | 21.0 | |||||||||||||||||
| Mountain | 245 | 239 | 6 | 6 | 178 | 37.6 | 164 | 49.4 | |||||||||||||||||
| Pacific | 289 | 282 | 7 | 7 | 222 | 30.2 | 258 | 12.0 | |||||||||||||||||
| South Central | 1,183 | 1,174 | 9 | 9 | 1,146 | 3.2 | 1,036 | 14.2 | |||||||||||||||||
| Salt | 327 | 326 | 1 | 1 | 325 | 0.6 | 291 | 12.4 | |||||||||||||||||
| Nonsalt | 856 | 848 | 8 | 8 | 822 | 4.1 | 745 | 14.9 | |||||||||||||||||
| Total | 3,199 | 3,134 | 65 | 65 | 2,916 | 9.7 | 2,695 | 18.7 | |||||||||||||||||
Totals may not equal sum of components because of independent rounding. | |||||||||||||||||||||||||
Working gas in storage was 3,199 Bcf as of Friday, July 5, 2024, according to EIA estimates. This represents a net increase of 65 Bcf from the previous week. Stocks were 283 Bcf higher than last year at this time and 504 Bcf above the five-year average of 2,695 Bcf. At 3,199 Bcf, total working gas is above the five-year historical range.
For information on sampling error in this report, see Estimated Measures of Sampling Variability table below.
Note: The shaded area indicates the range between the historical minimum and maximum values for the weekly series from 2019 through 2023. The dashed vertical lines indicate current and year-ago weekly periods.
The last 12z European model, purple on the right was ANOTHER -3 CDDs. A month ago, ALL the forecasts for July were for high heat the entire month. Its gotten less and less hot and now, even features a brief period with BELOW AVERAGE CDDs.
The heat will be a constant feature out West, where less people live. These are POPULATION WEIGHTED CDDs.

This was the forecast a month ago, for instance:

The last 12z European model was ANOTHER -5 CDDs bearish.........but natural gas went up anyway!! This is a market that doesn't want to go any lower! Reacting bullishly to bearish news!
Over the weekend, the models continued to get cooler and cooler. The last 12z European model vs the previous one from 12 hours earlier was -5.5 CDDs and -12 CCDs compared to Friday.
The entire 2 week period forecast a month ago was +52 CDDs vs average. So +1.7/day vs average.
The entire 2 week period forecast is now just +5 CDDs total compared to average. So +.17/day vs average. A loss of -47 CDDs total vs a month ago.
I don't remember a change that drastic EVER during the Summer, up or down.
In the Winter, that's happened a few times because of HDDs being MUCH higher. I just don't recall it at this time of year.

A month ago, nobody could have imagined the middle of July would actually feature BELOW average CDDs. Every single forecast was for MUCH ABOVE temperatures and extreme heat.
These were the last 2 CDD forecasts from the European model on the right. Week 1 is BELOW the green, dashed lone(average). Right now is the seasonal peak for CDDs, which start drifting lower later this month.

+++++++++++++++
Temperatures last week for tomorrow's EIA:
https://www.cpc.ncep.noaa.gov/products/tanal/temp_analyses.php

BULLISH!! Just +10 Bcf! Blue line on the storage graph almost down to the top of the 5 year range for the first time since early this year(when the very mild Winter greatly reduced residential heating demand, which increased storage vs previous draw down periods)
https://ir.eia.gov/ngs/ngs.html
![]()
for week ending July 12, 2024 | Released: July 18, 2024 at 10:30 a.m. | Next Release: July 25, 2024
| Working gas in underground storage, Lower 48 states Summary text CSV JSN | |||||||||||||||||||||||||
|---|---|---|---|---|---|---|---|---|---|---|---|---|---|---|---|---|---|---|---|---|---|---|---|---|---|
| Historical Comparisons | |||||||||||||||||||||||||
| Stocks billion cubic feet (Bcf) | Year ago (07/12/23) | 5-year average (2019-23) | |||||||||||||||||||||||
| Region | 07/12/24 | 07/05/24 | net change | implied flow | Bcf | % change | Bcf | % change | |||||||||||||||||
| East | 686 | 682 | 4 | 4 | 659 | 4.1 | 592 | 15.9 | |||||||||||||||||
| Midwest | 814 | 800 | 14 | 14 | 736 | 10.6 | 684 | 19.0 | |||||||||||||||||
| Mountain | 248 | 245 | 3 | 3 | 184 | 34.8 | 169 | 46.7 | |||||||||||||||||
| Pacific | 289 | 289 | 0 | 0 | 230 | 25.7 | 262 | 10.3 | |||||||||||||||||
| South Central | 1,173 | 1,183 | -10 | -10 | 1,149 | 2.1 | 1,037 | 13.1 | |||||||||||||||||
| Salt | 318 | 327 | -9 | -9 | 322 | -1.2 | 283 | 12.4 | |||||||||||||||||
| Nonsalt | 855 | 856 | -1 | -1 | 828 | 3.3 | 753 | 13.5 | |||||||||||||||||
| Total | 3,209 | 3,199 | 10 | 10 | 2,959 | 8.4 | 2,744 | 16.9 | |||||||||||||||||
Totals may not equal sum of components because of independent rounding. | |||||||||||||||||||||||||
Working gas in storage was 3,209 Bcf as of Friday, July 12, 2024, according to EIA estimates. This represents a net increase of 10 Bcf from the previous week. Stocks were 250 Bcf higher than last year at this time and 465 Bcf above the five-year average of 2,744 Bcf. At 3,209 Bcf, total working gas is above the five-year historical range.
For information on sampling error in this report, see Estimated Measures of Sampling Variability table below.
Note: The shaded area indicates the range between the historical minimum and maximum values for the weekly series from 2019 through 2023. The dashed vertical lines indicate current and year-ago weekly periods.
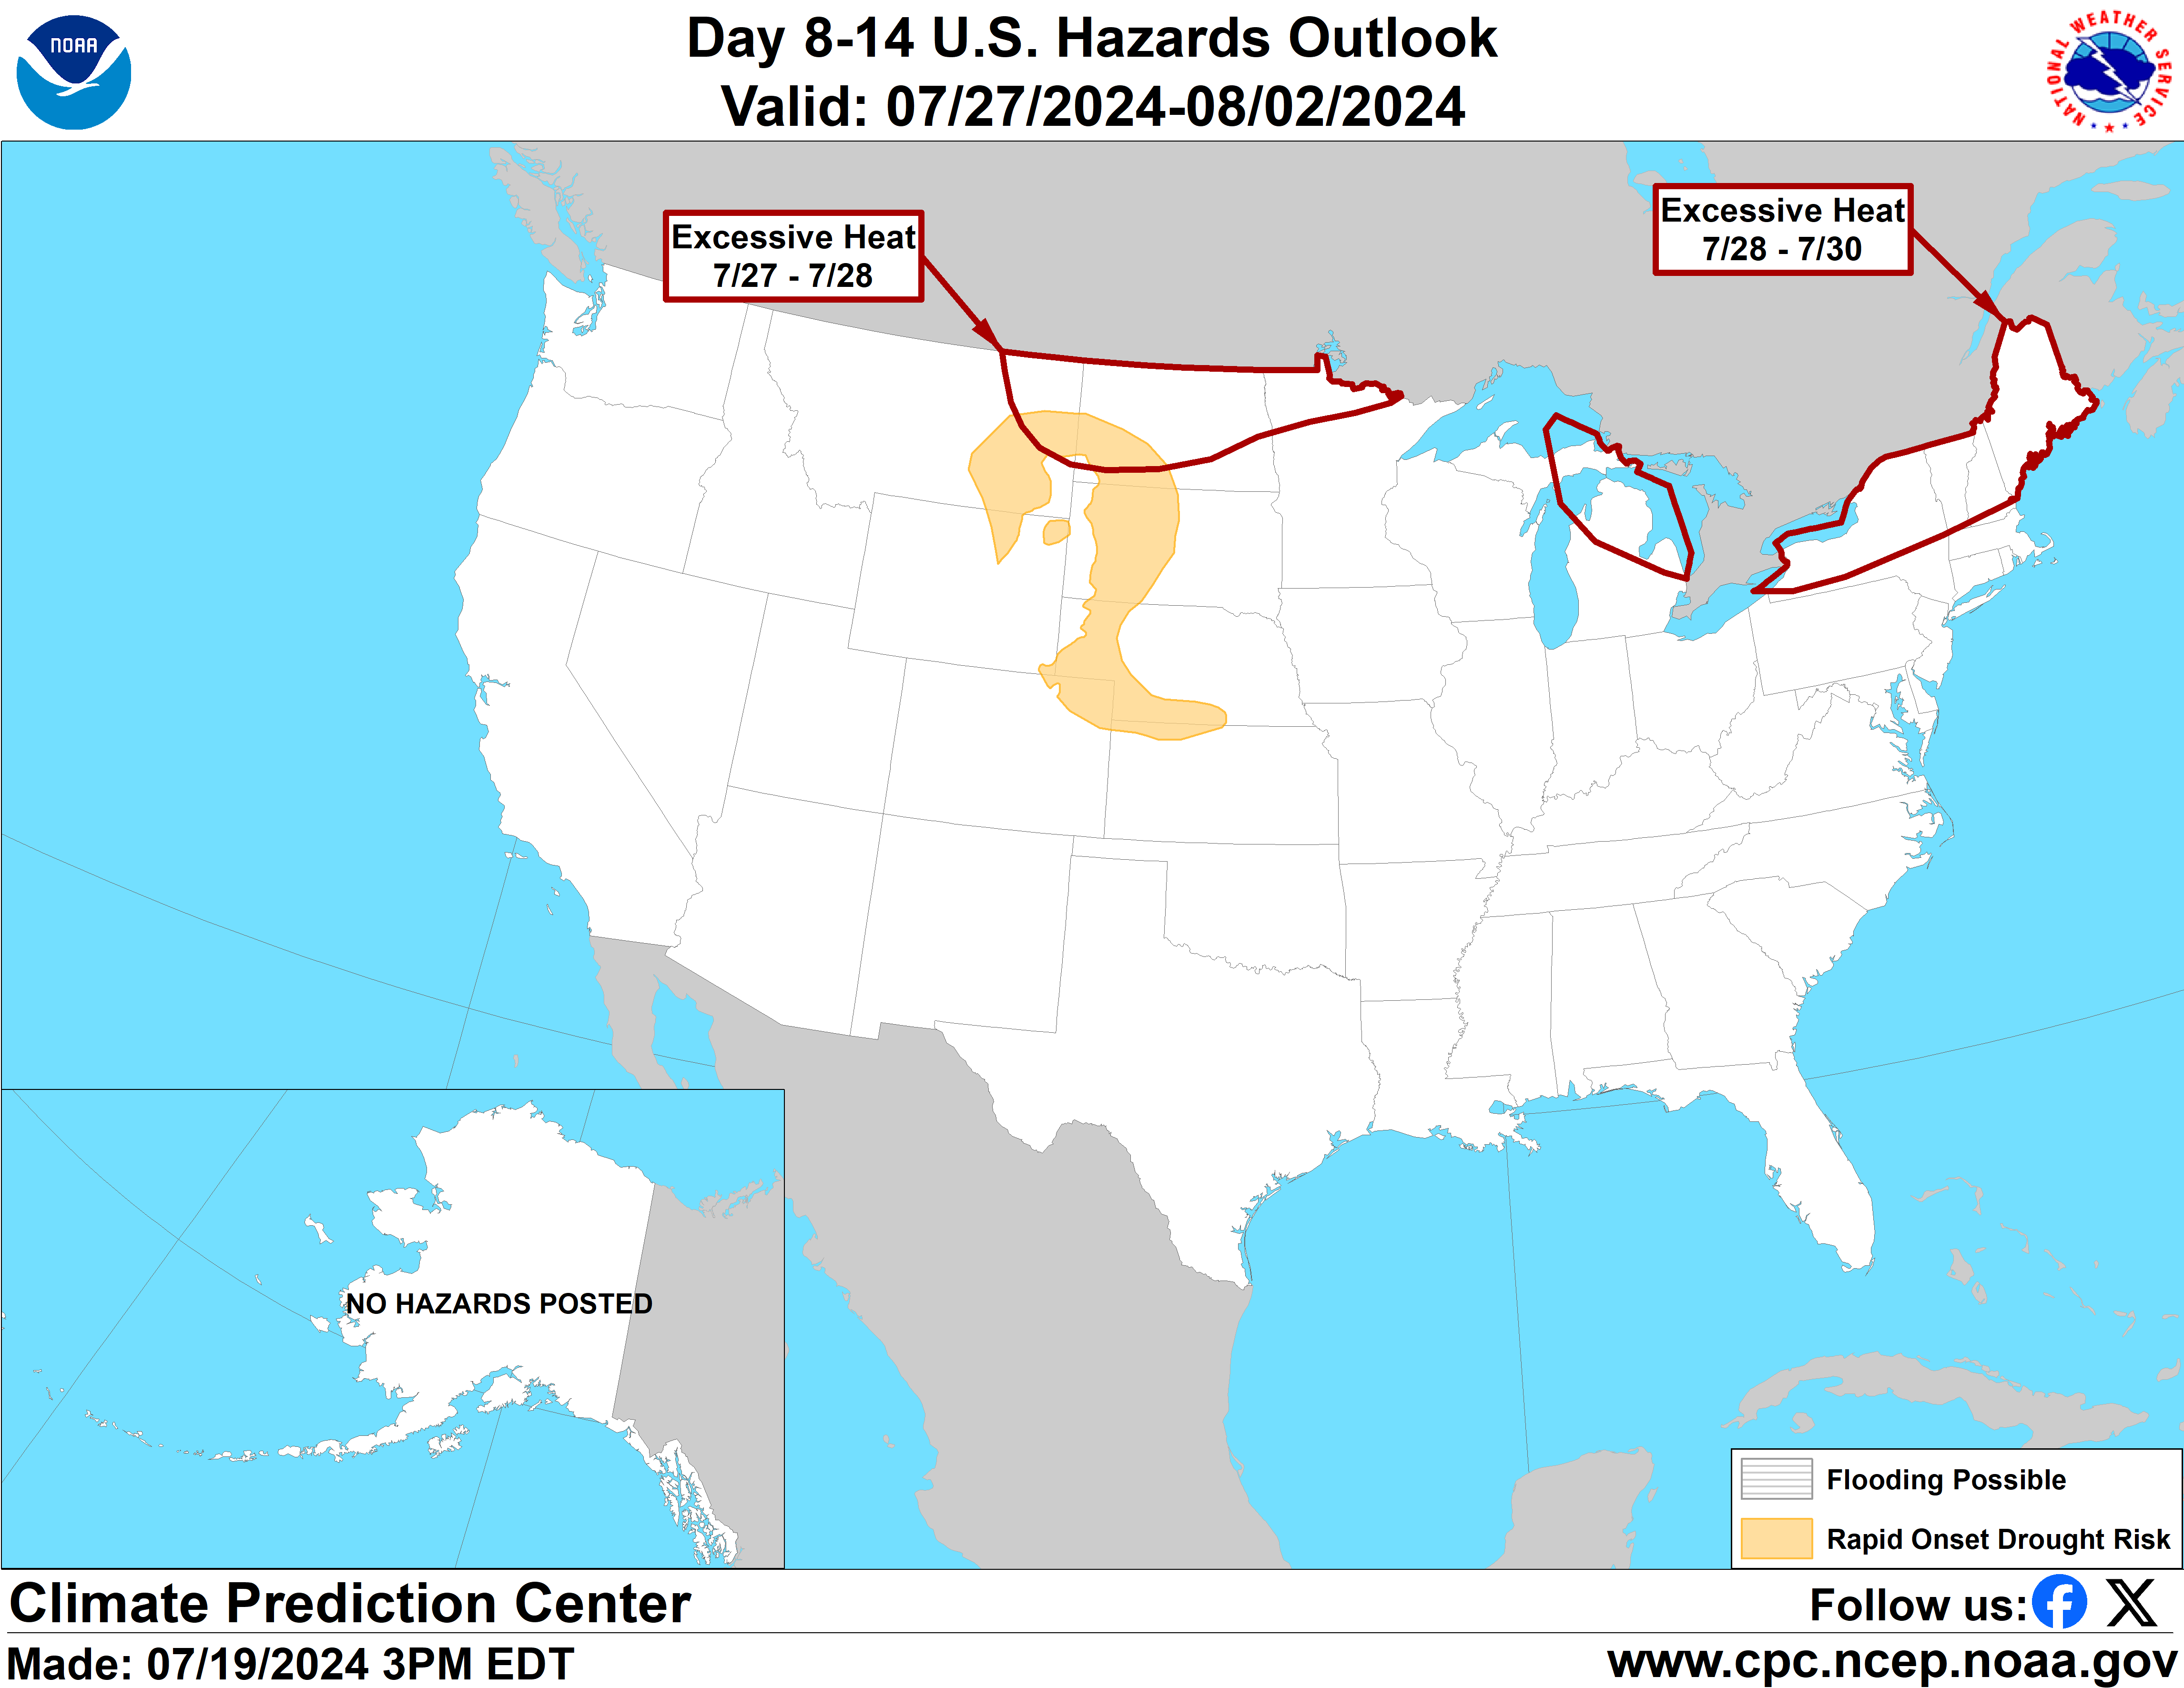
Here comes the heat.........spreading across the Northern Tier in week 2:
On the right are the last 4 runs of the GEFS, last 12z run in purple, not quite as hot:
https://www.cpc.ncep.noaa.gov/products/predictions/threats/threats.php
Here's the just out, 12z Canadian model. Back to more northwest flow in the Midwest (dome backing up again) vs earlier in the week that showed the heat ridge expanding eastward.
This is for early August, 16 days from now.
https://weather.gc.ca/ensemble/charts_e.html?Hour=384&Day=0&RunTime=12&Type=gz
++++++++
Not AS hot as earlier in the week. Last GEFS 12z run in purple on the right=CDD.
Dashed green line is the slowly decreasing seasonal average. We peaked last week, historically if you go just by the average. However, August can feature intense heat and seasonals for NG actually turn up here.
++++++++++
The typical, seasonal highs occur right around the time that the first major cold waves of Autumn are hitting.....around October/November-ish. Sometimes in early December if the heating season starts out extremely cold, especially if storage levels are low.
Storage should be robust this year going into the heating season. Current, very low prices are the market telling us that too.
https://charts.equityclock.com/natural-gas-futures-ng-seasonal-chart
++++++++
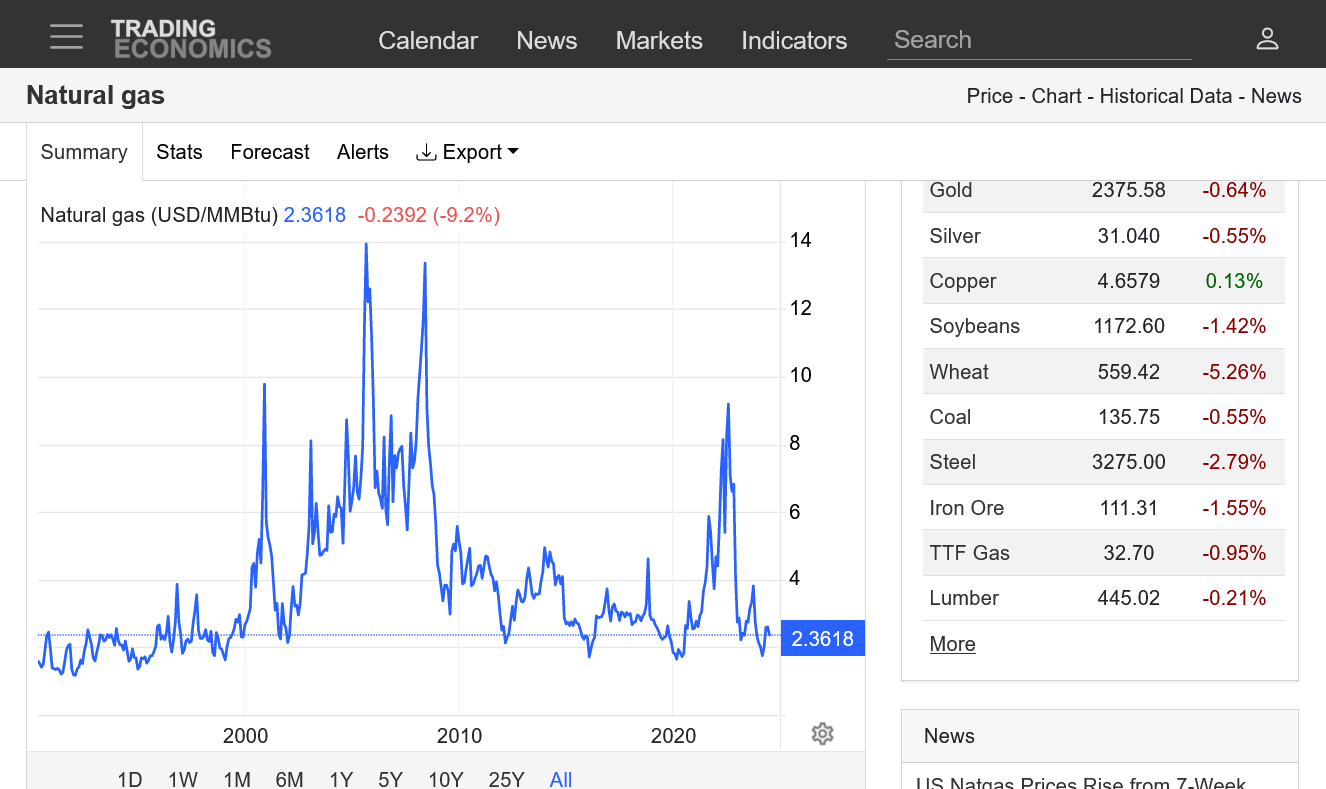
The price is down almost 10,000/contract in the last month+ from temperatures being MUCH, MUCH cooler than predicted for July compared to what was expected BEFORE the Summer.
We encountered some MAJOR support just above $2 last week.
Odds are, that will hold if the heat picks up, along with seasonals being positive.
https://tradingeconomics.com/commodity/natural-gas
Temps for this EIA report:
Keep in mind that last week was historically the HOTTEST week of the year. So AVERAGE TEMPS are usually hot. With so many areas being above average, we should see a smallish injection..although the middle of the country was mild.
https://www.cpc.ncep.noaa.gov/products/tanal/temp_analyses.php
 ++++++++++++
+22 Bcf is wimpy but apparently more than the market was anticipating. BEFORE the release, ng futures bounced but they dropped immediately after the release and remain weak. The weather forecast continues to heat up in early August but not AS hot as the forecast from earlier this week.
Note that the blue line on the graph below, which has been WELL above the previous storage range since January because of the record mild Winter's reduction in residential heating demand..........has eroded from the Summer heat eating away at the surplus, which is now just close to the previous highest ever for this time of year(instead of well above it).
Supplies are still very ample, which is why prices are VERY low, down near $2.
The price of natural gas is one of the very few items that has NOT been impacted by inflation because there's just too much supply gushing in. Despite Biden and the fake green energy frauds pretending that we are headed towards the end of fossil fuels, natural gas continues to gush in with gusto and no sign of that ending.
Increasing solar and wind are likely providing additional electricity supplies that reduce the amount needed from natural gas and this is also a factor. However, natural gas is KING and will be for at least the next decade, probably MUCH longer in this realm.
https://ir.eia.gov/ngs/ngs.html
![]()
for week ending July 19, 2024 | Released: July 25, 2024 at 10:30 a.m. | Next Release: August 1, 2024
| Working gas in underground storage, Lower 48 states Summary text CSV JSN | |||||||||||||||||||||||||
|---|---|---|---|---|---|---|---|---|---|---|---|---|---|---|---|---|---|---|---|---|---|---|---|---|---|
| Historical Comparisons | |||||||||||||||||||||||||
| Stocks billion cubic feet (Bcf) | Year ago (07/19/23) | 5-year average (2019-23) | |||||||||||||||||||||||
| Region | 07/19/24 | 07/12/24 | net change | implied flow | Bcf | % change | Bcf | % change | |||||||||||||||||
| East | 697 | 686 | 11 | 11 | 667 | 4.5 | 607 | 14.8 | |||||||||||||||||
| Midwest | 827 | 814 | 13 | 13 | 752 | 10.0 | 703 | 17.6 | |||||||||||||||||
| Mountain | 251 | 248 | 3 | 3 | 188 | 33.5 | 172 | 45.9 | |||||||||||||||||
| Pacific | 289 | 289 | 0 | 0 | 232 | 24.6 | 263 | 9.9 | |||||||||||||||||
| South Central | 1,167 | 1,173 | -6 | -6 | 1,142 | 2.2 | 1,030 | 13.3 | |||||||||||||||||
| Salt | 313 | 318 | -5 | -5 | 313 | 0.0 | 273 | 14.7 | |||||||||||||||||
| Nonsalt | 854 | 855 | -1 | -1 | 829 | 3.0 | 757 | 12.8 | |||||||||||||||||
| Total | 3,231 | 3,209 | 22 | 22 | 2,982 | 8.4 | 2,775 | 16.4 | |||||||||||||||||
Totals may not equal sum of components because of independent rounding. | |||||||||||||||||||||||||
Working gas in storage was 3,231 Bcf as of Friday, July 19, 2024, according to EIA estimates. This represents a net increase of 22 Bcf from the previous week. Stocks were 249 Bcf higher than last year at this time and 456 Bcf above the five-year average of 2,775 Bcf. At 3,231 Bcf, total working gas is above the five-year historical range.
For information on sampling error in this report, see Estimated Measures of Sampling Variability table below.
Note: The shaded area indicates the range between the historical minimum and maximum values for the weekly series from 2019 through 2023. The dashed vertical lines indicate current and year-ago weekly periods.
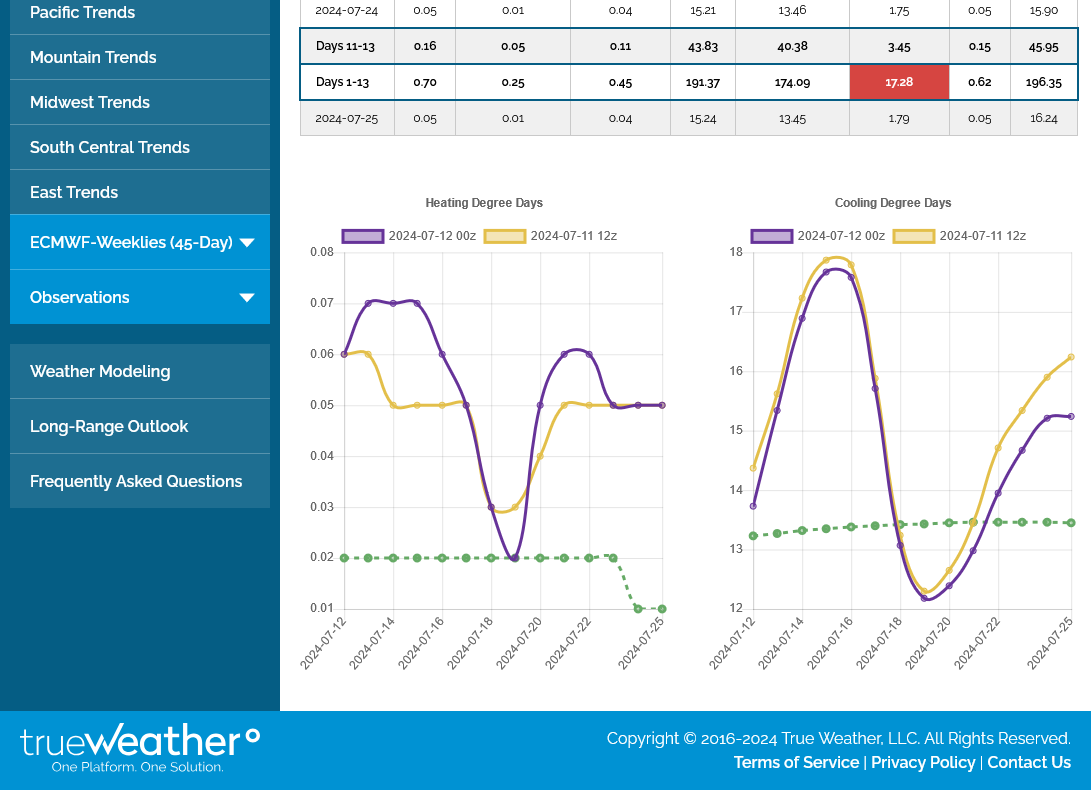
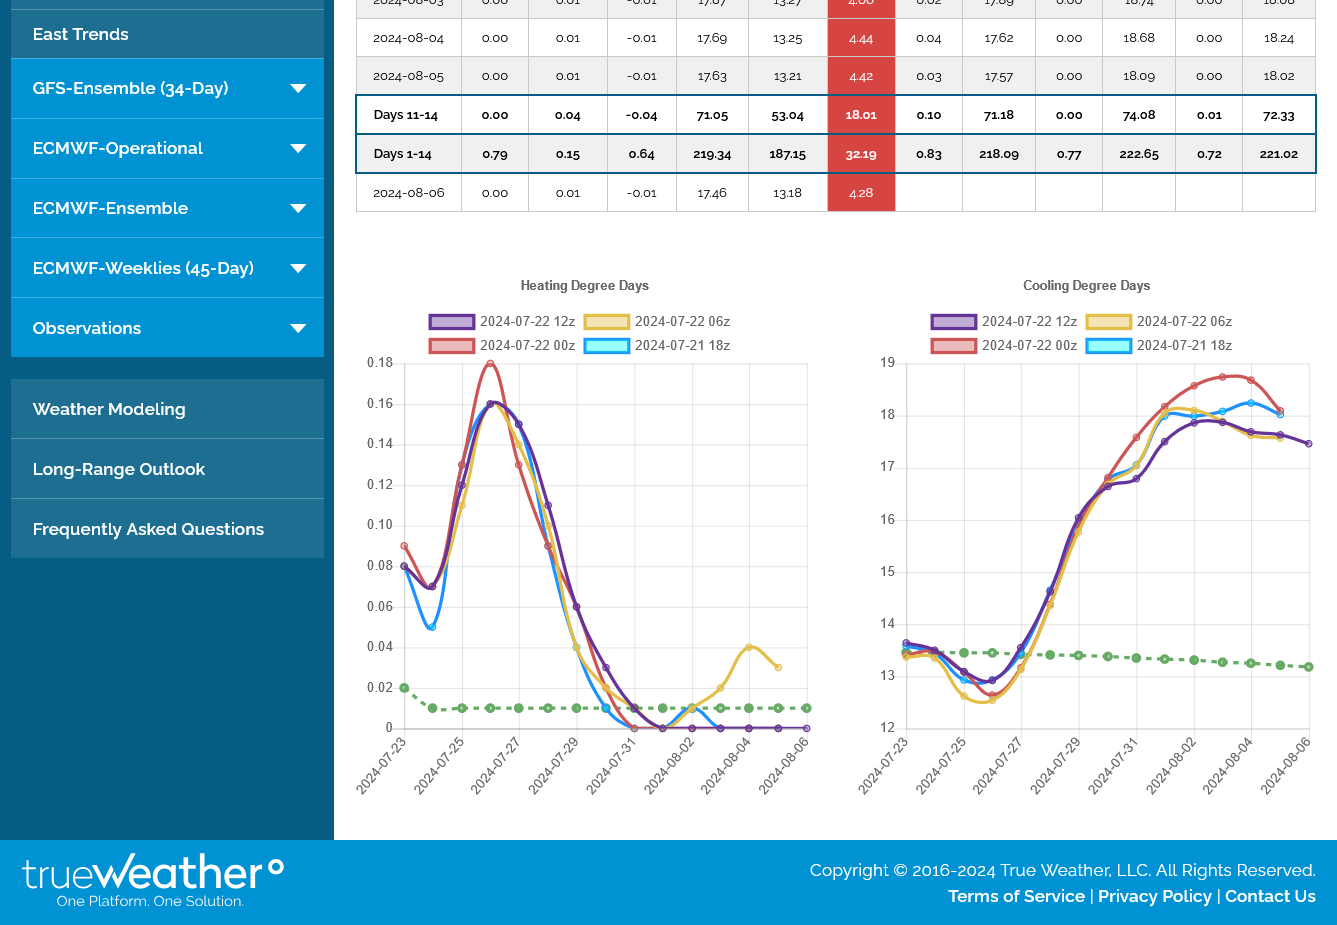
Forecasts, like they have been this Summer have continued to be LESS hot overnight.
This was the last 0z European Ensemble model in purple on the right below. -2 CDDS vs the previous run 12 hours earlier. The dashed green line is the slowly dropping historical average. We should note the spike up in heat this week, then much less heat in week 2 cooling that gets us close to average.
This is still VERY warm but just NOT AS warm compared to previous forecasts which is BEARISH vs expectations.

++++++++++++++
Natural gas prices are incredibly cheap here, breaking thru $2 this morning with the front month, August expiring today too. This could be a bad sign and being caused by a rapidly shrinking economy. It may be the result of weakening Industrial demand. I've seen this happen several times but OTHER SUPPLY factors could be causing most of it.
The price below is the September contract which will be the front month tomorrow.
https://tradingeconomics.com/commodity/natural-gas


Temps last week were hot in the West but seasonably pleasant in the middle of the country for what is seasonally(average) the hottest week of the year.
https://www.cpc.ncep.noaa.gov/products/tanal/temp_analyses.php
September ng spiked below $2 this morning and took out a ton of stops before bouncing back but is still extremely weak and may go back down again to test that level.
Overnight, the models were a bit(Euro was +2.4 CDDs) hotter but we should note the significant COOLING in week 2 vs week 1. HOTTER=BULLISH in August but not so much when the overall pattern is COOLING.
Everything is set up to make a significant low here, using $2 as the massive support to stop the retreat, along with strong upward seasonals that are kicking in now and last until rhe storage refill season is almost over…..late Fall.

The lows in natural gas may be in.
Even COOLER temperatures in the overnight forecasts are, once again pressuring natural gas prices after the very strong reversal up signal on Tuesday......testing the really strong support level of $2, with life of contract lows for September natural gas, then closing decisively higher.
This last 0z European model was -3 CDDs vs the previous run, with temps cooling all the way back to average (green dashed lines) at the end of the 2 week forecast.

Guidance in week 2 was hotter overnight! +1.5 CDDS on this last 0z Euro in purple on the right.
+19 Bcf. This was actually a bullish number..........with a knee jerk price spike higher but the market went lower after that, apparently because of the pattern change to cooler coming up(despite the overnight models, for the first time in a week actually being hotter).
We should note that this has eroded the surplus enough so that we are barely at the top of the 5 year average(blue line below) instead of being well above it since January(from the record mild Winter).
https://ir.eia.gov/ngs/ngs.html
![]()
for week ending July 26, 2024 | Released: August 1, 2024 at 10:30 a.m. | Next Release: August 8, 2024
| Working gas in underground storage, Lower 48 states Summary text CSV JSN | |||||||||||||||||||||||||
|---|---|---|---|---|---|---|---|---|---|---|---|---|---|---|---|---|---|---|---|---|---|---|---|---|---|
| Historical Comparisons | |||||||||||||||||||||||||
| Stocks billion cubic feet (Bcf) | Year ago (07/26/23) | 5-year average (2019-23) | |||||||||||||||||||||||
| Region | 07/26/24 | 07/19/24 | net change | implied flow | Bcf | % change | Bcf | % change | |||||||||||||||||
| East | 711 | 697 | 14 | 14 | 677 | 5.0 | 623 | 14.1 | |||||||||||||||||
| Midwest | 842 | 827 | 15 | 15 | 770 | 9.4 | 722 | 16.6 | |||||||||||||||||
| Mountain | 253 | 251 | 2 | 2 | 190 | 33.2 | 175 | 44.6 | |||||||||||||||||
| Pacific | 286 | 289 | -3 | -3 | 231 | 23.8 | 262 | 9.2 | |||||||||||||||||
| South Central | 1,157 | 1,167 | -10 | -10 | 1,128 | 2.6 | 1,025 | 12.9 | |||||||||||||||||
| Salt | 307 | 313 | -6 | -6 | 301 | 2.0 | 264 | 16.3 | |||||||||||||||||
| Nonsalt | 851 | 854 | -3 | -3 | 828 | 2.8 | 761 | 11.8 | |||||||||||||||||
| Total | 3,249 | 3,231 | 18 | 18 | 2,997 | 8.4 | 2,808 | 15.7 | |||||||||||||||||
Totals may not equal sum of components because of independent rounding. | |||||||||||||||||||||||||
Working gas in storage was 3,249 Bcf as of Friday, July 26, 2024, according to EIA estimates. This represents a net increase of 18 Bcf from the previous week. Stocks were 252 Bcf higher than last year at this time and 441 Bcf above the five-year average of 2,808 Bcf. At 3,249 Bcf, total working gas is within the five-year historical range.
For information on sampling error in this report, see Estimated Measures of Sampling Variability table below.
Note: The shaded area indicates the range between the historical minimum and maximum values for the weekly series from 2019 through 2023. The dashed vertical lines indicate current and year-ago weekly periods.
++++++++++++++
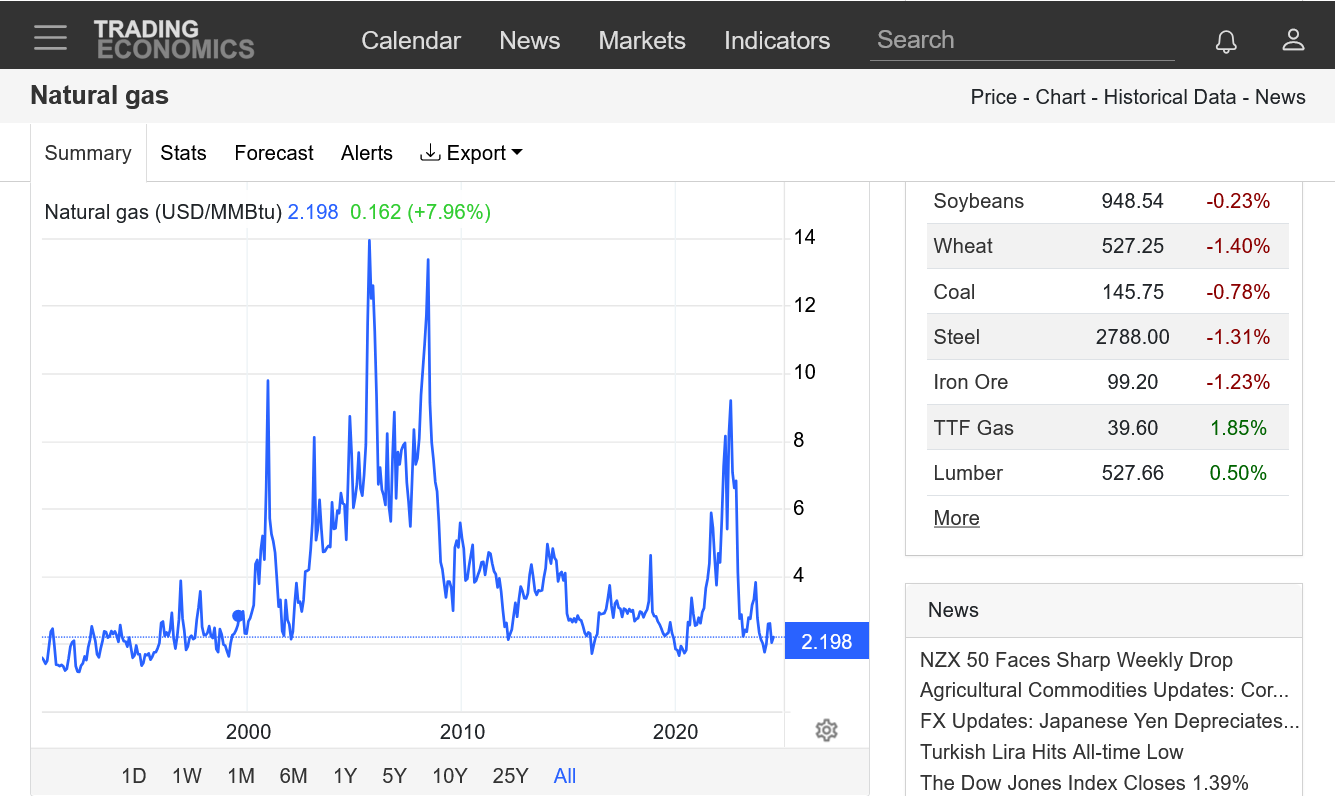
Supplies are still robust, however. Regardless, it's surprising that we are so close to $2, a historically LOW price. Prices have only spent less than 2% of the time below this the last 25 years!
The 12z GEFS came in a whopping -8 CDDs bearish vs the previous run, in purple on the right below. The previous run was +3 CDDs. This caused natural gas to crash thru $2. Incredibly low!

+++++++++++++++++++++++++++++++++++++++
This was the last 500 mb map for August 16th from that run:

The predicted/anticipated record hot Summer across the United States that was dialed into prices and the anticipated greater/bullish demand dynamics ha e failed to happen. This failure is part of the reason for the price collapse, now extending into August. The typical seasonal low in July has now been extended into August. BUT THERE IS MUCH MORE TO THIS!
Is Industrial demand collapsing from a rapidly contracting economy?
That would explain this.
In the last 25 years, natural gas prices have only been lower than this very briefly and for less than 1% of the time!!!
1. 35 years
2. 1 week
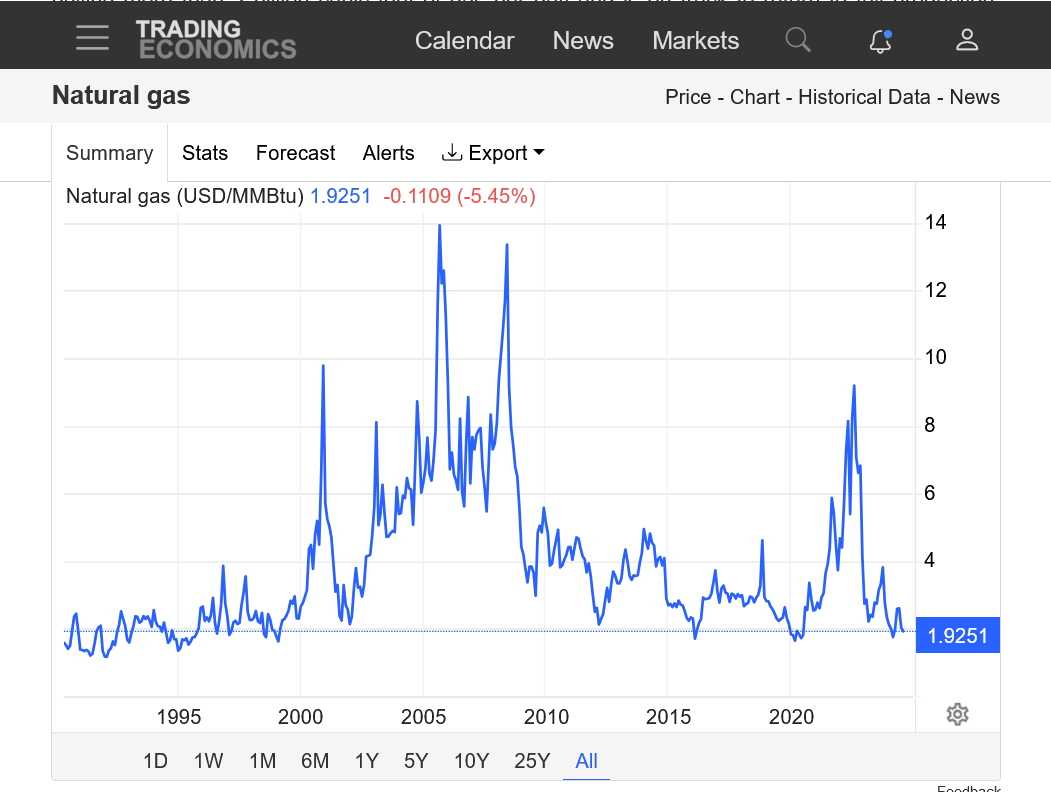
https://tradingeconomics.com/commodity/natural-gas
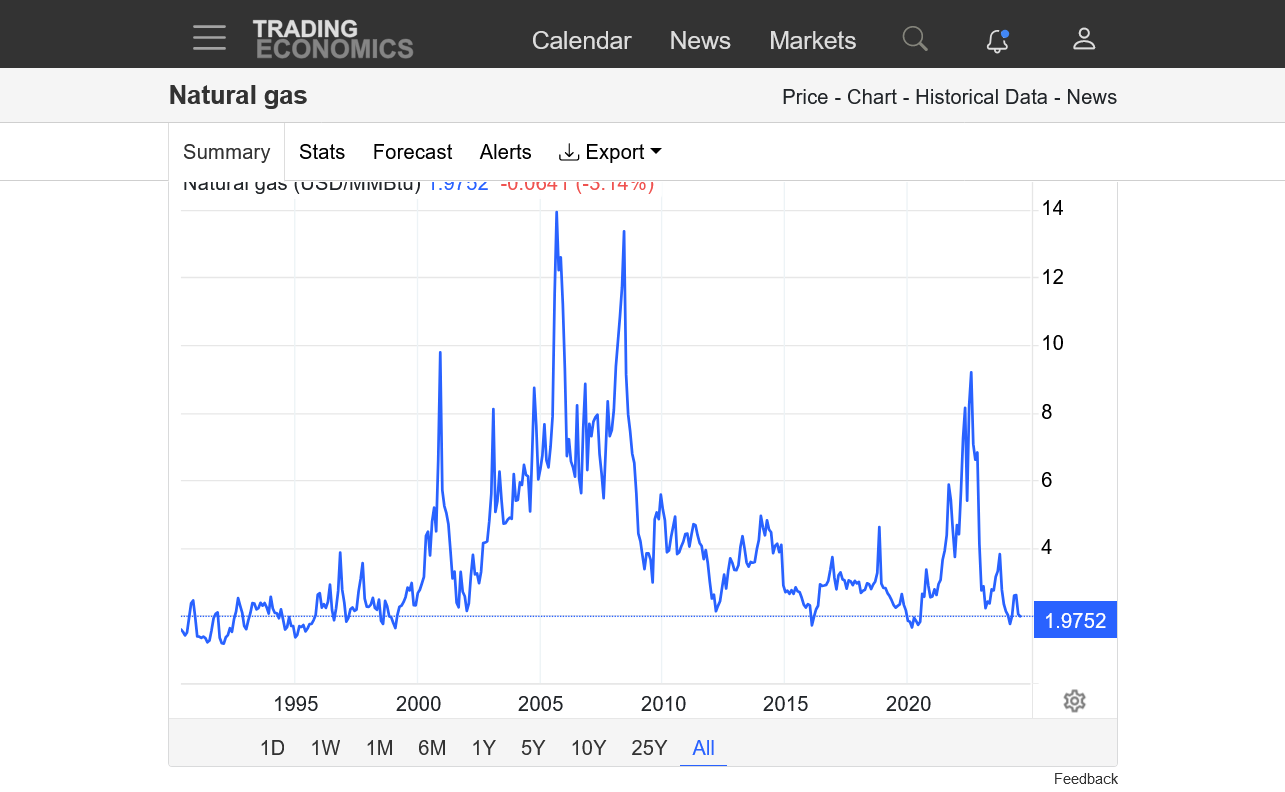

https://www.marketforum.com/forum/topic/104700/#106362
Natural gas prices have their lows at the end of Winter in almost every year for seasonal reasons(cold is over and its time to fill up storage).
The exceptions to that happen from recessions. 2020, and 2009 for instance, when ng prices also dropped into the Summer because of the huge cutback in industrial demand for natural gas from the manufacturing sector, for instance that happens in recessions.
The price of natural gas has only been this low for extremely brief periods the past 25 years.......and NEVER in August.
The last time ng was LOWER than this in August was almost 3 decades ago.
There is something extremely powerful going on right now!!!!
https://tradingeconomics.com/united-states/stock-market
Models overnight were a bit cooler.......AGAIN! Natural gas continues mind boggling weak!
Weak demand moving forward from a coming recession is weighing heavy on the market. At some point, this incredible move lower will run out of steam at these extremely low prices. Keep in mind that almost EVERYTHING, EVERYWHERE has gone up in price. So in real terms/prices compared to everything else, these are RECORD LOW PRICES FOR NATURAL GAS!!!
These were the last 4 runs of the GEFS, with CDDs on the right and the last 6z run in purple.
The market is asking:
Where's the heat???
Just out European model a whopping -5 CDDs colder/bearish........and the market actually bounced slightly higher, suggesting cooler weather forecasts have exhausted their impact after weeks and weeks of less and less heat and cooler and cooler weather forecasts.
Temps last week for the Thursday, EIA storage report at 9:30am.
Hot in the center of the country to the Northeast.
Probably an injection slightly LESS than average for late July, which is a week PAST the seasonally hottest week of the year.
https://www.cpc.ncep.noaa.gov/products/tanal/temp_analyses.php
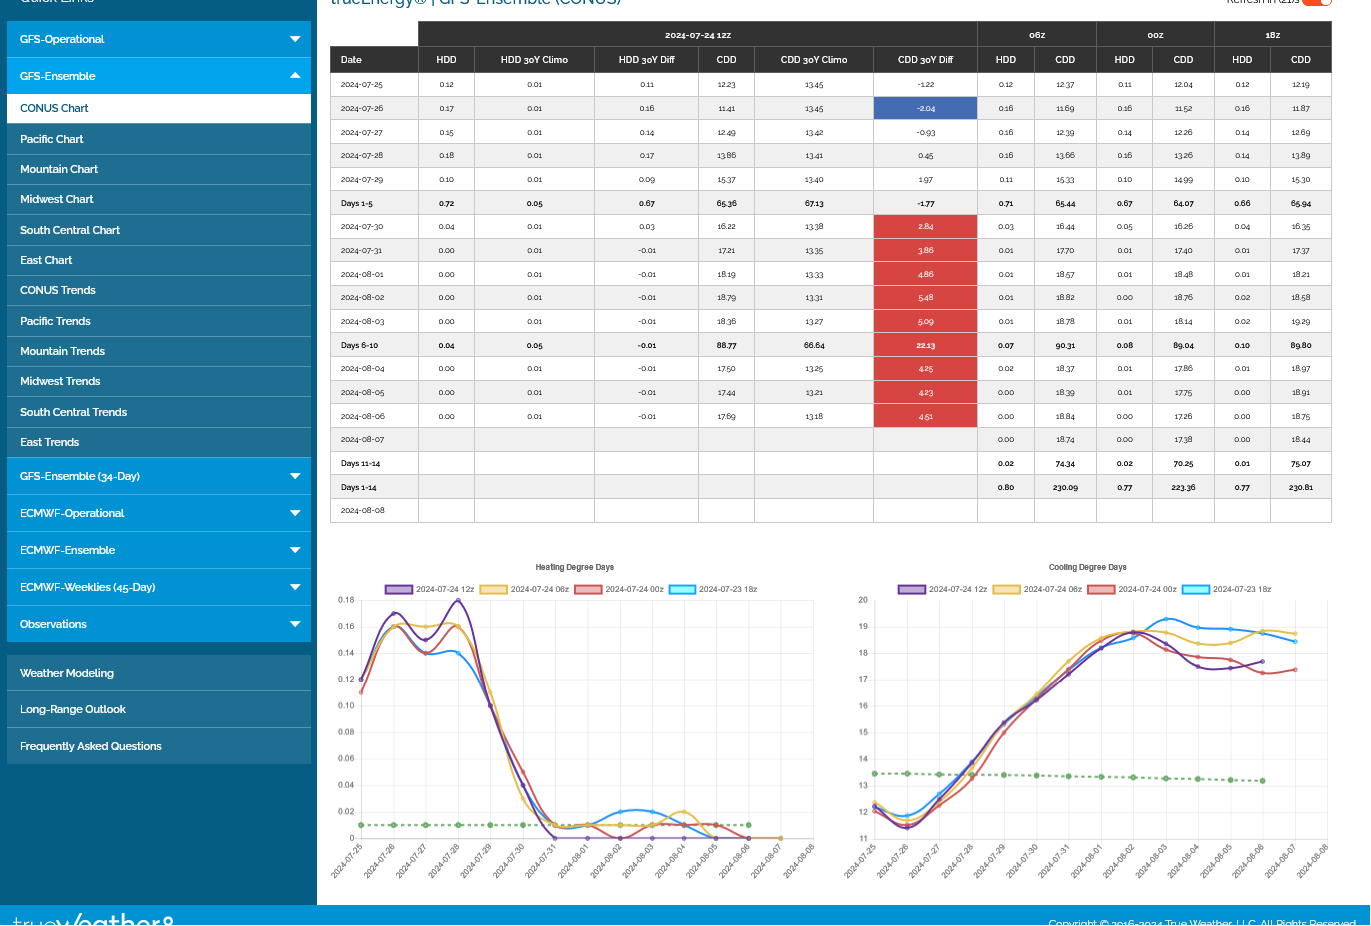
The tide has turned. Forecast models all getting HOTTER NOW.....will it continue????
NG very likely just put in a bottom that could last for the rest of the year or longer.........Maybe!
The last 4 runs of the GEFS for CDDs on the right. Purple is the last run. The heat will be cranking up in week 2!!

https://tradingeconomics.com/commodity/natural-gas
1. 35 years. Extremely low prices vs the past 25 years.
2. Potential, significant bottom, now back above $2. A really bad recession could alter that and cause more downside.

Here we go again. The last 12z GEFS in purple on the right, was -7 CDDs vs the previous 2 runs.

8pm
The next 18z GEFS was hotter again. Models having some trouble with the magnitude of the heat in this week 2 pattern, though they all agree that is will be pretty dry and MUCH warmer.

Overnight models hotter again for week 2. 0z European model in purple on the right.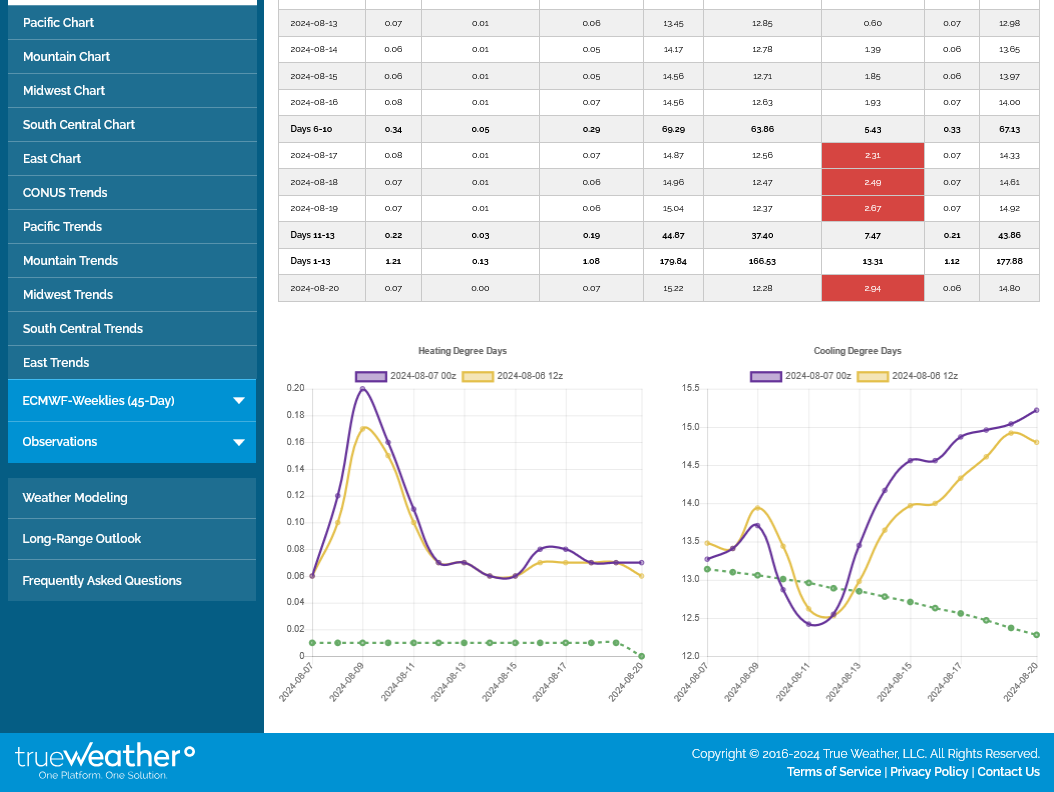
This last 12z European models was a whopping -5 CDDs cooler/bullish! The market doesn't care because:
1. Prices are extremely low
2. A significant low has likely been put in based on the chart formation/signature.
3. Seasonals are higher the last 3 months of refill season before Winter/COLD hits.
4. It's still going to get much warmer. Maybe not quite as fast, but the pattern is still the same.
5. Sometimes the news is not as important as HOW THE MARKET REACTS TO THE NEWS. There was no reaction to this by the market.
Models were COOLER AGAIN overnight (-2 CDDs below on the last 0z European model) and this time, the market has responded lower. The weekly EIA report's bearish expectations are also a factor:

I'm not trading this market at the moment but would find it hard to be short down here at this price, with increasing heat on the way. The thing that makes me leery of being long is a potentially tanking economy.
Also, the position of the upper level heat ridge in 2 weeks is too far west to be mega bullish for the high population centers in the east and south.
The Rockies and Plains/Upper Midwest will have the greatest positive temperature anomalies. 
+21 Bcf seems bullish to me. but maybe the market expected it? We've had an initial, small spike higher.
We have eroded the record surplus with the blue line below vs the 5 year average but still very robust storage levels.
![]()
https://ir.eia.gov/ngs/ngs.html
for week ending August 2, 2024 | Released: August 8, 2024 at 10:30 a.m. | Next Release: August 15, 2024
| Working gas in underground storage, Lower 48 states Summary text CSV JSN | |||||||||||||||||||||||||
|---|---|---|---|---|---|---|---|---|---|---|---|---|---|---|---|---|---|---|---|---|---|---|---|---|---|
| Historical Comparisons | |||||||||||||||||||||||||
| Stocks billion cubic feet (Bcf) | Year ago (08/02/23) | 5-year average (2019-23) | |||||||||||||||||||||||
| Region | 08/02/24 | 07/26/24 | net change | implied flow | Bcf | % change | Bcf | % change | |||||||||||||||||
| East | 719 | 711 | 8 | 8 | 694 | 3.6 | 641 | 12.2 | |||||||||||||||||
| Midwest | 854 | 842 | 12 | 12 | 788 | 8.4 | 742 | 15.1 | |||||||||||||||||
| Mountain | 257 | 253 | 4 | 4 | 195 | 31.8 | 178 | 44.4 | |||||||||||||||||
| Pacific | 289 | 286 | 3 | 3 | 232 | 24.6 | 262 | 10.3 | |||||||||||||||||
| South Central | 1,152 | 1,157 | -5 | -5 | 1,113 | 3.5 | 1,023 | 12.6 | |||||||||||||||||
| Salt | 300 | 307 | -7 | -7 | 288 | 4.2 | 258 | 16.3 | |||||||||||||||||
| Nonsalt | 851 | 851 | 0 | 0 | 825 | 3.2 | 766 | 11.1 | |||||||||||||||||
| Total | 3,270 | 3,249 | 21 | 21 | 3,022 | 8.2 | 2,846 | 14.9 | |||||||||||||||||
Totals may not equal sum of components because of independent rounding. | |||||||||||||||||||||||||
Working gas in storage was 3,270 Bcf as of Friday, August 2, 2024, according to EIA estimates. This represents a net increase of 21 Bcf from the previous week. Stocks were 248 Bcf higher than last year at this time and 424 Bcf above the five-year average of 2,846 Bcf. At 3,270 Bcf, total working gas is within the five-year historical range.
For information on sampling error in this report, see Estimated Measures of Sampling Variability table below.
Note: The shaded area indicates the range between the historical minimum and maximum values for the weekly series from 2019 through 2023. The dashed vertical lines indicate current and year-ago weekly periods.
Natural gas is now +1,000/contract in the last hour+ after the release of the EIA number. Making new highs since the low was put in earlier this week. Confirming the low. ...........probably.
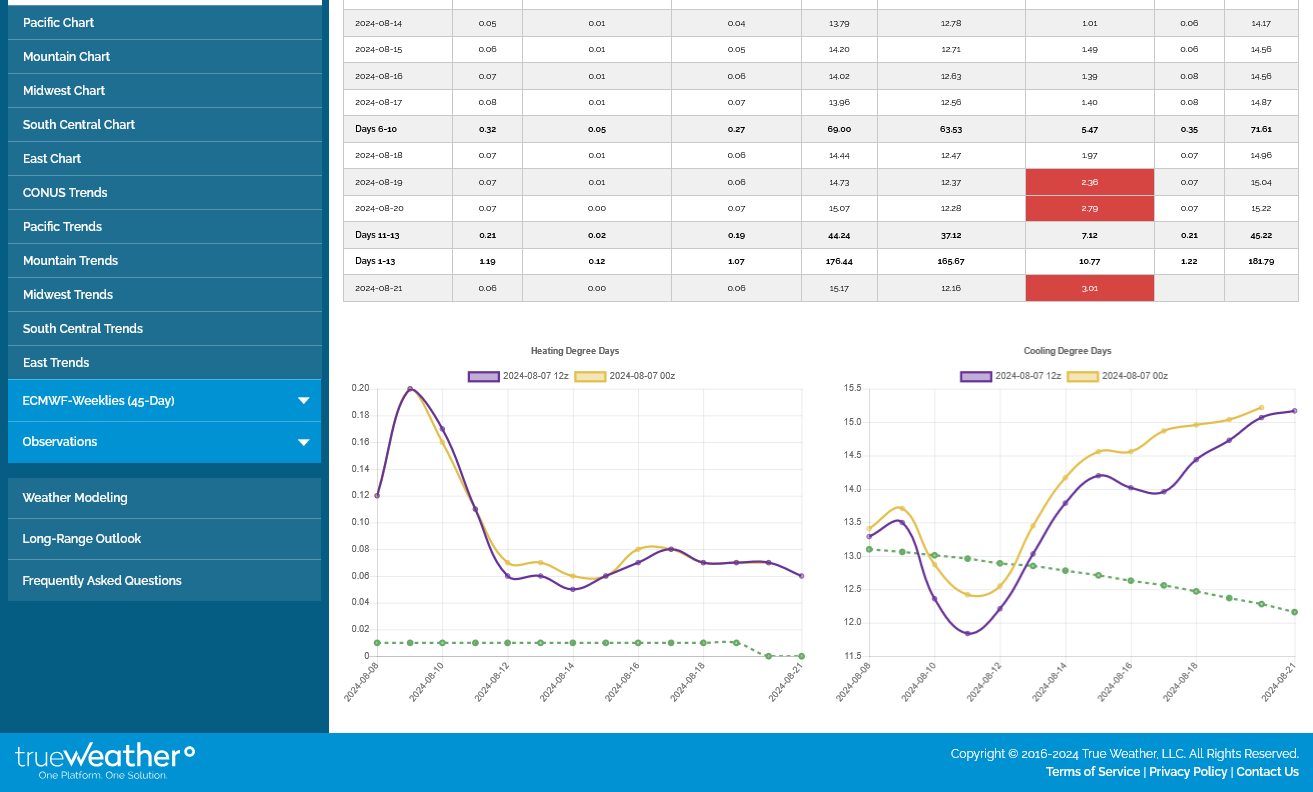
Natural gas continues to confirm seasonal lows, along with a BULLISH weather forecast.
The last 0z European model, on the right, in purple was +4 CDDs vs the previous 12z model. Note the dashed green line, which is the historical average is slowly dropping but THE FORECAST features CDDs that stay elevated, well above average and more like mid-July, the hottest time of Summer.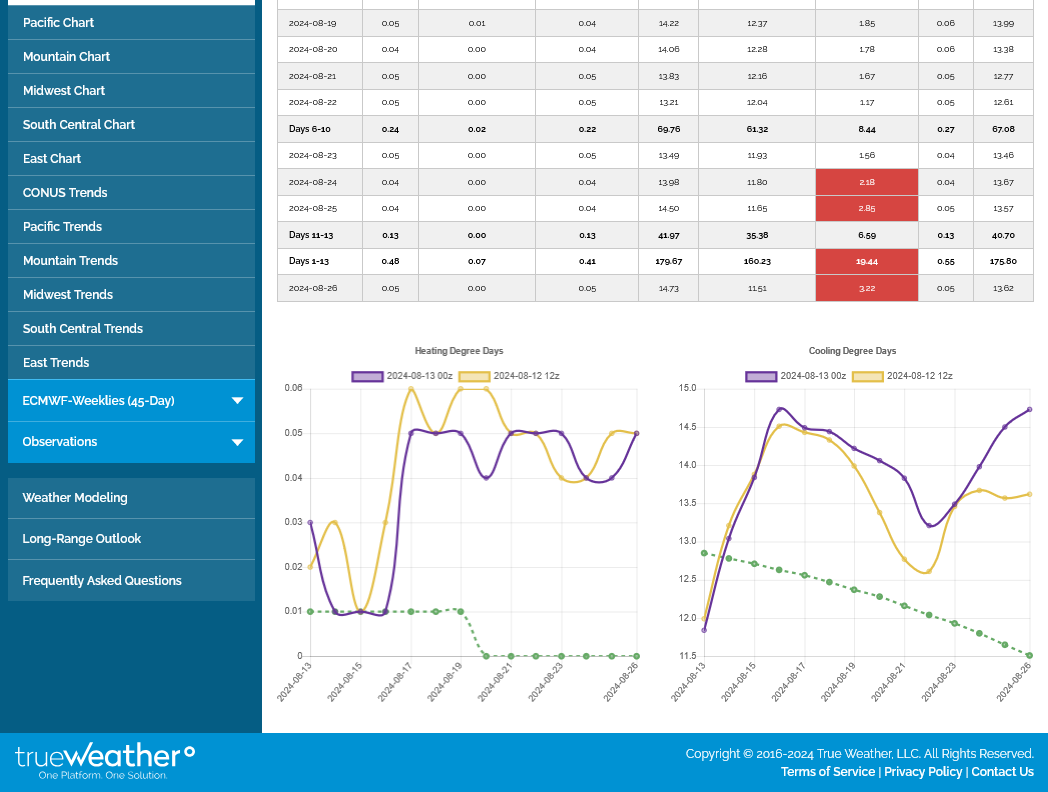 +++++++++
There are 2 items that steal some of the bullishness away.
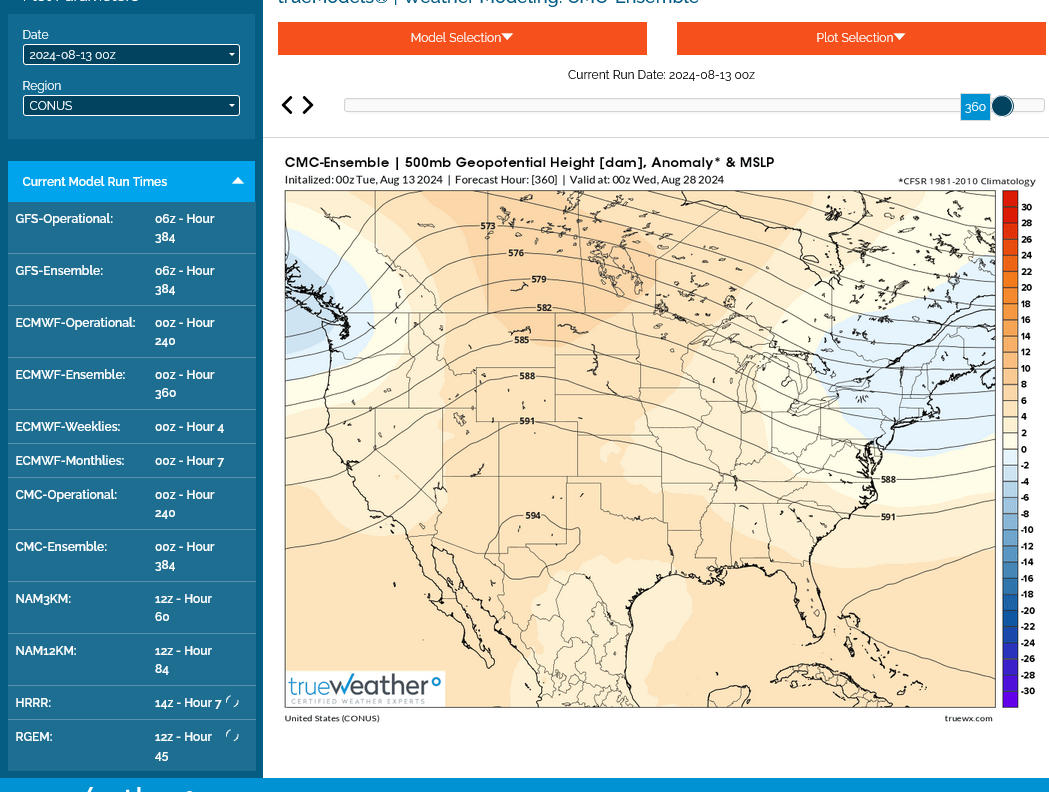
1. The heat is too far west, with an upper level trough over the high population centers in the East. This was the last 0z CANADIAN MODEL, below.
2. An apparent, oncoming recession which reduces demand/usage in the Industrial sector.
These were the 7 day temperatures for the next EIA, natural gas storage report released at 9:30 am every Thursday.
Mostly very warm conditions, with the heat centered out West, where less people live. So the INJECTION number should be smallish and bullish vs average........but the market may have already dialed in most of this expectation.

The 12z European model from earlier today was a whopping -8 CDDs! It's in purple below.
The market had already sold off hours before this model output came out. I think that sometimes, in house models are run before the main government models, which meteorologists at private firms can pass to large funds.

-6 Bcf!
WOW! We don't have withdrawals very often in the Summer/this time of year. The record surplus from earlier this year continues to be eroded. Note the blue line on the graph below having a LESS steep upward/increase slope vs the last 5 years having a STEEPER storage increase slope. Storage has not been keeping up with historical averages. Storage is still very robust, however and near the top of the range.
Otherwise, we wouldn't still be trading so close to $2 for the front month, September right now.
https://ir.eia.gov/ngs/ngs.html
![]()
for week ending August 9, 2024 | Released: August 15, 2024 at 10:30 a.m. | Next Release: August 22, 2024
| Working gas in underground storage, Lower 48 states Summary text CSV JSN | |||||||||||||||||||||||||
|---|---|---|---|---|---|---|---|---|---|---|---|---|---|---|---|---|---|---|---|---|---|---|---|---|---|
| Historical Comparisons | |||||||||||||||||||||||||
| Stocks billion cubic feet (Bcf) | Year ago (08/09/23) | 5-year average (2019-23) | |||||||||||||||||||||||
| Region | 08/09/24 | 08/02/24 | net change | implied flow | Bcf | % change | Bcf | % change | |||||||||||||||||
| East | 723 | 719 | 4 | 4 | 712 | 1.5 | 658 | 9.9 | |||||||||||||||||
| Midwest | 869 | 854 | 15 | 15 | 807 | 7.7 | 765 | 13.6 | |||||||||||||||||
| Mountain | 260 | 257 | 3 | 3 | 200 | 30.0 | 181 | 43.6 | |||||||||||||||||
| Pacific | 287 | 289 | -2 | -2 | 238 | 20.6 | 263 | 9.1 | |||||||||||||||||
| South Central | 1,125 | 1,152 | -27 | -27 | 1,097 | 2.6 | 1,021 | 10.2 | |||||||||||||||||
| Salt | 286 | 300 | -14 | -14 | 275 | 4.0 | 252 | 13.5 | |||||||||||||||||
| Nonsalt | 839 | 851 | -12 | -12 | 822 | 2.1 | 770 | 9.0 | |||||||||||||||||
| Total | 3,264 | 3,270 | -6 | -6 | 3,055 | 6.8 | 2,889 | 13.0 | |||||||||||||||||
Totals may not equal sum of components because of independent rounding. | |||||||||||||||||||||||||
Working gas in storage was 3,264 Bcf as of Friday, August 9, 2024, according to EIA estimates. This represents a net decrease of 6 Bcf from the previous week. Stocks were 209 Bcf higher than last year at this time and 375 Bcf above the five-year average of 2,889 Bcf. At 3,264 Bcf, total working gas is within the five-year historical range.
For information on sampling error in this report, see Estimated Measures of Sampling Variability table below.
Note: The shaded area indicates the range between the historical minimum and maximum values for the weekly series from 2019 through 2023. The dashed vertical lines indicate current and year-ago weekly periods.
Natural Gas Futures Jump After EIA Reports Rare Summer Storage Draw
Natural gas futures pushed higher Thursday after the U.S. Energy Information Administration (EIA) reported a rare summer withdrawal of 6 Bcf from storage for the week ended Aug. 9.
+++++++++
This helps to explain some the strong moves up at times during the last week, even when CDD projections for the next 2 weeks were LESS bullish.
Hey Mike,
NGI’s “indication” fwiw was for +1. So, this was 7 to the bullish side and a very rare summer draw. After doing so for nearly 25 years with detailed paperwork to back it up, I no longer follow NG weekly storage stats closely. I no longer have enough interest to feel it is worth my time. Otherwise, I’m sure I’d have a detailed post about this.
Thanks, Larry!
I miss those days when you did a comprehensive analysis of ng metrics like this. They were 2nd best to nobody, including sites that charge a ton of money for stuff like that.
There is nobody(s) on the planet that have closer analytical mindsets that us two!
I can very much relate to why you stopped trading NG using mostly weather. The incredible jerky movements from large specs using short term algorithms to spike the market in the opposite direction for a brief period to shake out and stop out weak positions, then reverse is caused me to more of a commentator here vs 20 years ago, when I was in high gear, ready for trading anything that grows, when it was getting planted or in the ground.... but the favorite was always natural gas.
What was interesting about today's price action is the spike higher immediately after the release to +$800/contract and now we're a bit lower. So people smarter than me knew this number was coming and that explained alot of the strength in ng the past week. Buy the rumor---sell the fact.
I used to record the storage data every single week for 2+ decades, starting in the early 90's when I first started trading.
That was when I hand plotted a dozen+ markets every day(before the internet), drawing trendlines and following technicals. Read several books on technical analysis.
This makes it fun analyzing other markets here, that others trade using the patterns that were learned over 25 years ago.
So I went back and am eyeing that ng storage data numbers from these links and doing fast math on the changes to look for a decreasing number.
There were only 2 weeks that featured a Summer draw down.
1. July 29, 2016 with a storage number that was 3,288 -6 Bcf vs the previous week.
Weekly Data from 2010-current
Lower 48 States Natural Gas Working Underground Storage (Billion Cubic Feet)
https://www.eia.gov/dnav/ng/hist/nw2_epg0_swo_r48_bcfw.htm
.png)
2. August 4, 2007 with a storage reporting 2,775 -12 Bcf vs the previous week. I actually remember this one vividly because it was the first Summer drawdown since I started trading in the early 1990's/
Weekly Data from 1994-2015
Lower 48 States Natural Gas Working Underground Storage (Billion Cubic Feet)
https://www.eia.gov/dnav/ng/hist/nw_epg0_sao_r48_bcfw.htm
.png)
I can't promise that I didn't miss one because I quickly looked over 30 years worth of Summer data. Regardless, we can see how unusual it is to have a negative number (draw down) in the Summer injection season.
3. The 3rd time in 31 Summers worth of data, was today's -6 Bcf!
+++++++++++++++
One thing to note on the 2 graphs above.
The 2nd graph from 1994 to 2005 features end of Winter/early Spring lows in storage around 1,000 Bcf or lower 6 times......which was around 50%/half the time.
After 2005, especially because of horizontal fracking of shale gas, storage only dropped to 1,000 Bcf or lower 1 time.....at the end of Winter/early Spring 2025.
More like 1 time every 20 years!! Which is 5% of the time..........although 2019 got pretty low. So we can add that year and say 1 time every 10 years = 10% of the time.
Before shale gas, storage dropped to precariously low levels 5 times more often than since then.
Additional note:
There was major heat is much of the country last week but this was still a BULLISH surprise.
I think we've had a couple bullish EIA reports recently. An educated guess here is that the supply spikets are being turned down because financial incentive at these prices near $2, are some of the lowest in the last 20 years is drying up.
As we always say:
The cure for high prices............IS HIGH PRICES!
The cure for low prices..............IS LOW PRICES!
++++++++
Just checked............that IS what's happening:
This is a good lesson below to learn about the dynamics of the natural gas market!
https://ycharts.com/indicators/us_gas_rotary_rigs

Analysis: After COVID, demand fell off a cliff in 2020, along with very low prices that even dipped below $2 supplies dried up. Storage was robust.
When demand returned in 2021/22, supplies couldn't keep up and prices more than quadrupled.
Supplies returned and really started gushing in by late Summer, 2022 but not before prices had quadrupled. Then in the Fall of 2022, we had record smashing 100+ injections.
The price charts below show this exactly:
1. 5 years-price spike lower from COVID-2020. Spike in prices higher-2022 from producers reacting to low COVID prices by cutting back. Producers ramp up to record production in late Summer of 2022 because of high prices.........and prices crash again because of that. Staying low in 2023/24 with a record surplus building in storage........which has been whittled down the last couple of months as ONCE AGAIN, production is being cut back from low prices.
2. 35 years-other than the 2022 spike higher (from supplies drying up after the COVID spike lower) shale gas gushing in has helped keep prices historically LOW compared to 2000-2009.
https://tradingeconomics.com/commodity/natural-gas

Based on the above, fundamentals for ng should be turning more bullish here. However, if the economy slows or we have a recession, it has a strong bearish impact. Sort of like COVID in 2020 but not nearly as powerful.
It's getting late in the year for heat to chew thru more storage but seasonals are strong, prices low and supplies have been cut back. I don't give advice to traders, you can decide for yourself what to do but personally, I can't be short down here for any reason.