Get all the comprehensive weather here:
https://www.marketforum.com/forum/topic/83844/
++++++++++++++++
There will be a slight risk on many days late this week which the Storm Prediction Center has not added to the days 4-8 yet because of uncertainty.
However, the risk level WILL elevate on day 5, Friday.
edit: the chance for severe level storms has dropped on Saturday from the rain cooled air ahead of the cold front. However, I still feel there is a higher risk on Saturday than the storm Prediction Center has been predicting. Not an outbreak or violent tornadoes but at least a level 3 out of 5 risk that includes a,potential tornado.
This is the 250 mb jet stream(32,000 feet) late Saturday from the last 6z GFS model. The pinks in the center of the jet STREAM are a jet STREAK with the HIGHEST winds. They create the strongest dynamics of all.
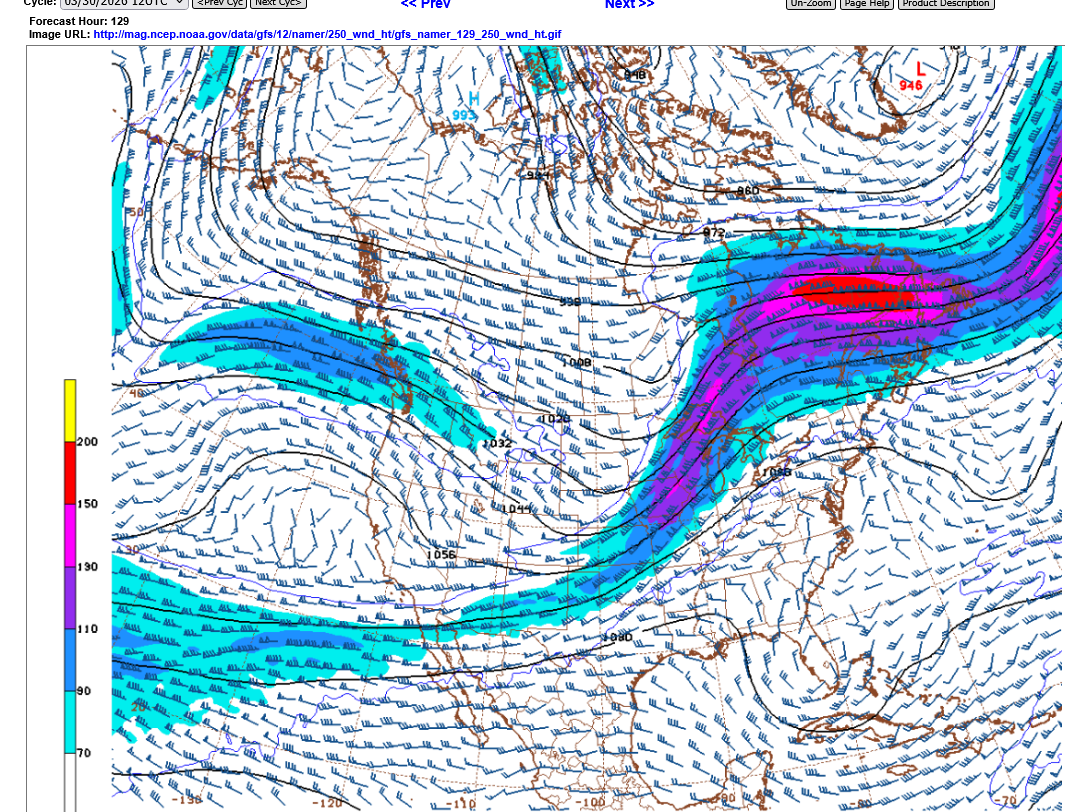
Southwest IN will be in the right rear quadrant of the jet stream/streak above which increases upper level divergence. That will enhance storm activity in addition to the lift from the cold front other dynamics associated with the developing storm.
It doesn't look like a major tornado outbreak but it wouldn't be surprising to see the Storm Prediction Center put down an area of level 3, elevated risk at some point for Friday and especially Saturday.
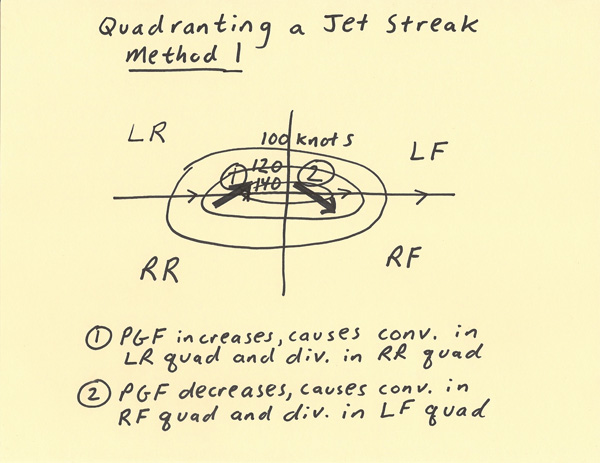
| HABYTIME MINI LECTURE 26: QUADRANTING A JET STREAK |
METEOROLOGIST JEFF HABY
https://www.theweatherprediction.com/habyhints2/601/
++++++++++++++
2 METHODS OF QUADRANTING JET STREAK
METEOROLOGIST JEFF HABY
https://theweatherprediction.com/habyhints3/748/
++++++++++++++++
THE 300 / 200 MB CHART
METEOROLOGIST JEFF HABY
theweatherprediction.com
https://www.weather.gov/source/zhu/ZHU_Training_Page/winds/JetStream_Stuff/300_200_chart.htm
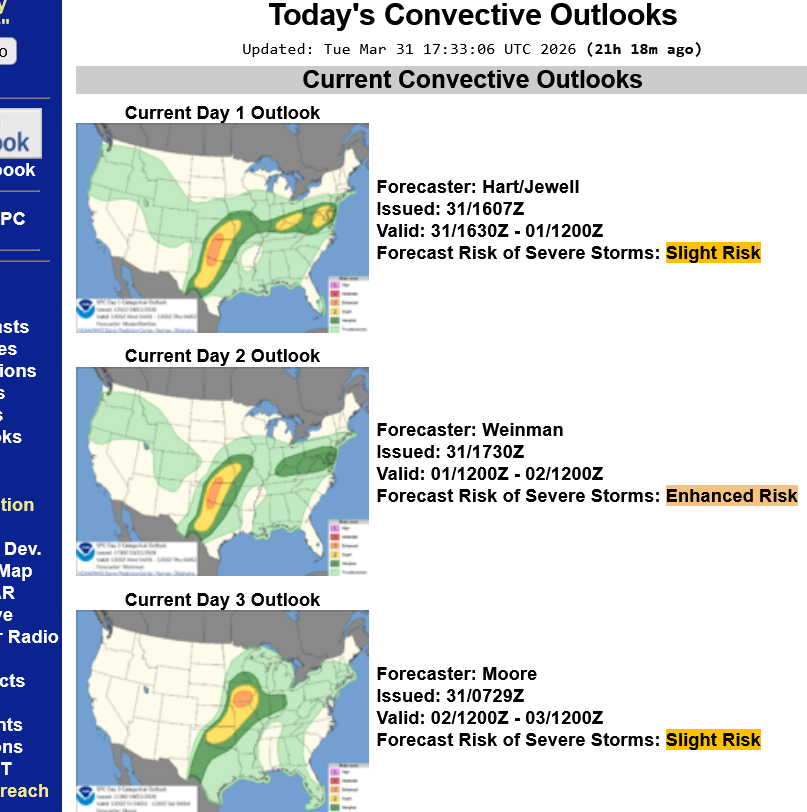
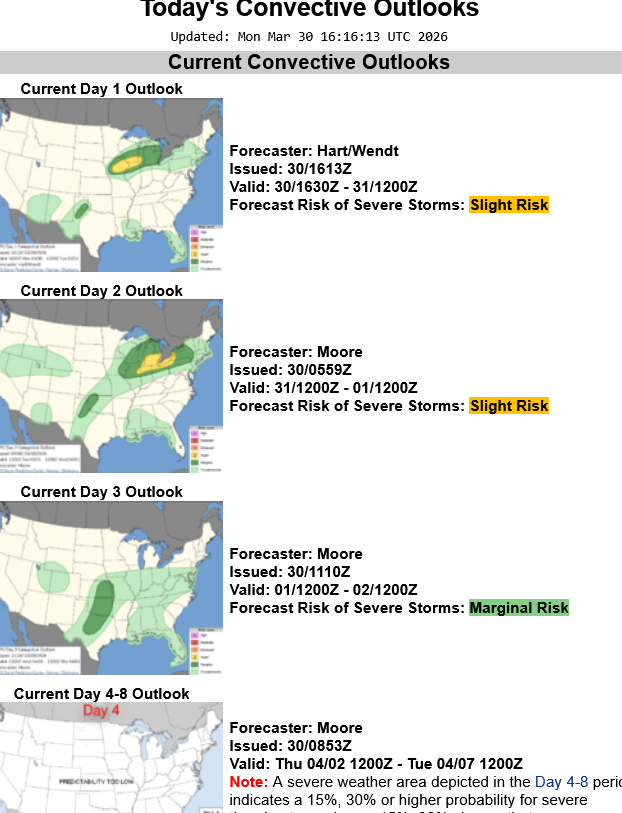
At the link below, you can get the Storm Prediction Center's daily risk assessments going out 8 days. Nothing outlined for days 4-8 here on Monday but they WILL add a couple of THOSE days to their risk assessment as we get closer based on the jet stream analysis on the previous page:
https://www.spc.noaa.gov/products/outlook/
Below is an image of the assessment at Noon on March 30, 2026. Again, look for that bottom 2 windows (days 3-8) to start adding risk tomorrow. Mainly for days 3-4 tomorrow which will be for Friday and Saturday.
Max Velocity puts on a great show, although he exaggerates and sensationalizes a bit at times to increase viewers. His live severe weather coverage is the best.
+++++++++++++
Ryan Hall Y'all also covers severe weather events extraordinarily well.
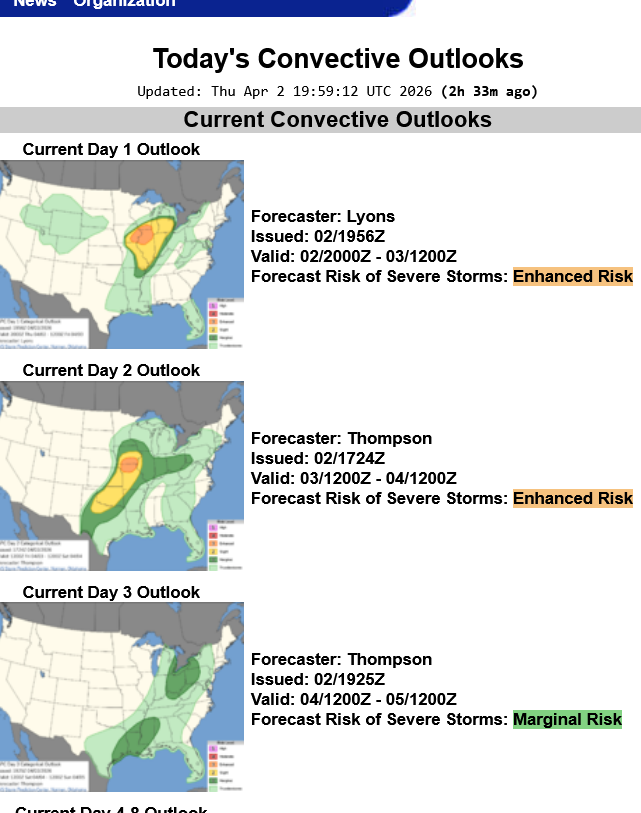
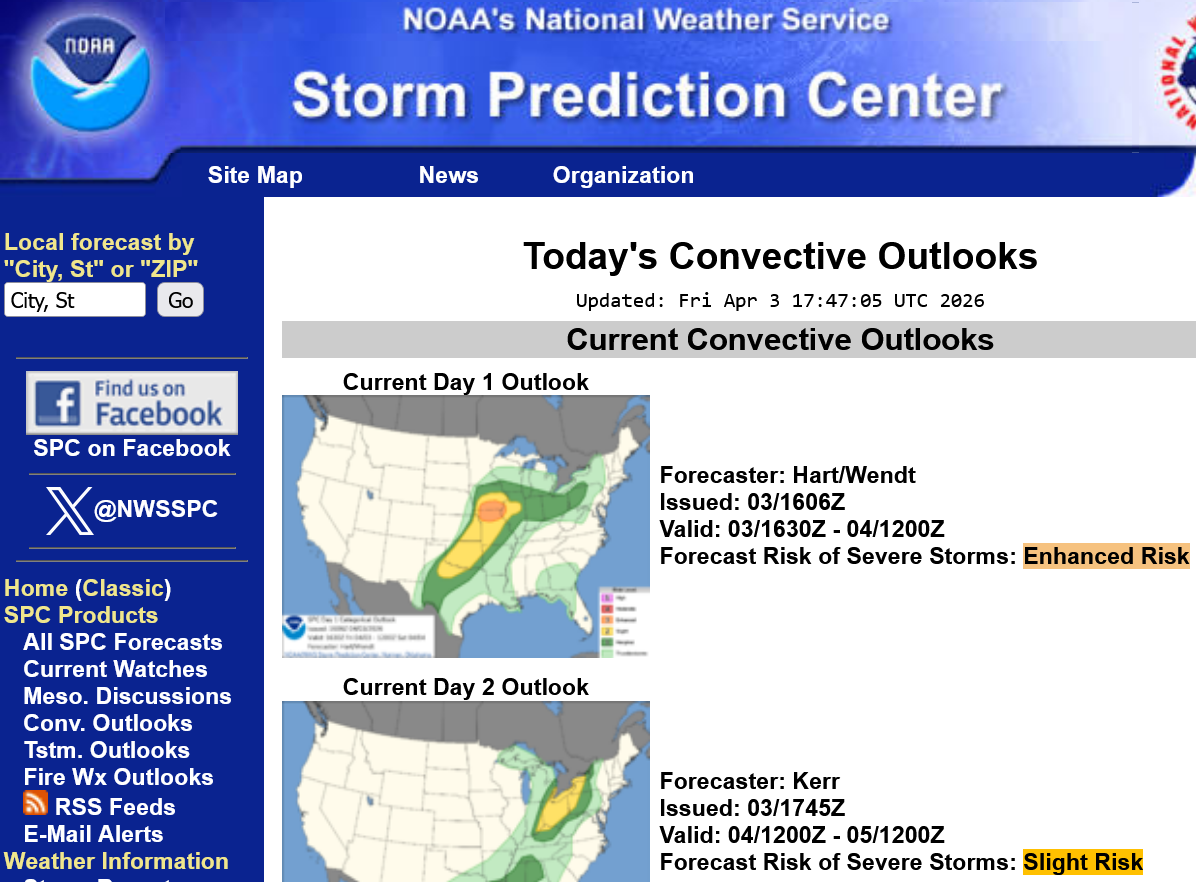
The Storm Prediction Center added risk areas today. Surprised they haven't put anything out for day 5 yet but they should do that tomorrow when its day 4.
https://www.spc.noaa.gov/products/outlook/
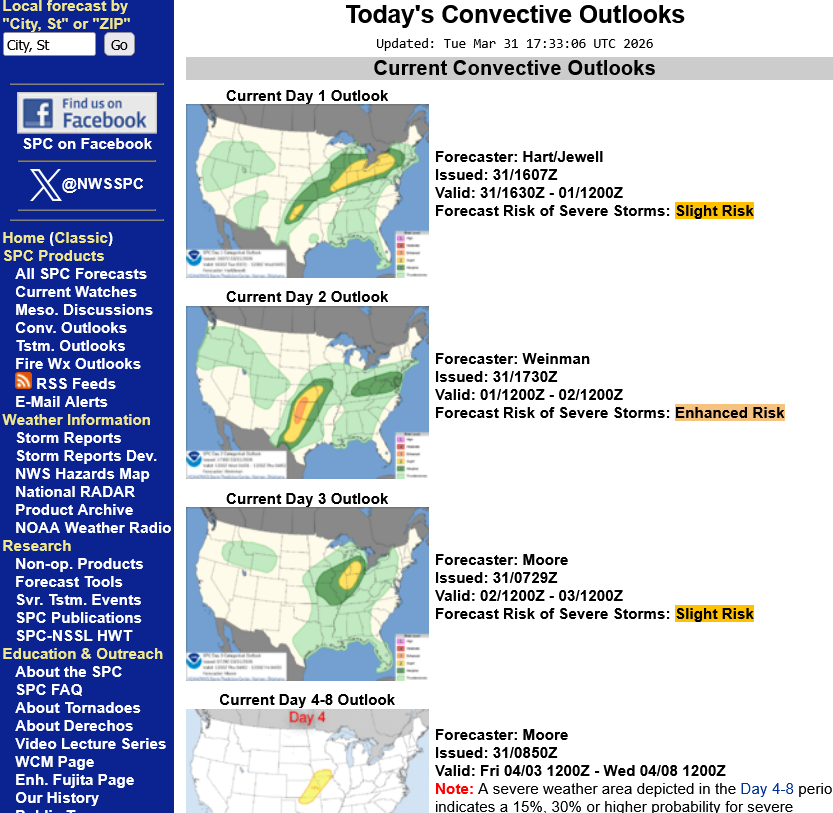
They still have not added risk for Saturday because of uncertainty but they finally recognized the magnitude of the threat with an enhanced, level 3 now indicated for the next 3 days. Day 3 is Friday when that elevated risk will shift much farther north and east, then be on the way out as it threatens additional areas farther north and east on Saturday.
We can see the big changes, just from yesterday's outlook areas that tell us why the Storm Prediction Center has been hesitant to outlook the areas for late in the week because of such high uncertainty.
Current Hazards at the link below.
For your NWS and county, go to the link below.
Then you can hit any spot on the map, including where you live and it will go to that NWS with all the comprehensive local weather information for that/your county.

This link below provides some great data. After going to the link, hit "Mesoanalysis" then, the center of any box for the area that you want, then go to observation on the far left, then surface observations to get constantly updated surface observations or hit another of the dozens of choices.
 +
+
+++++++++
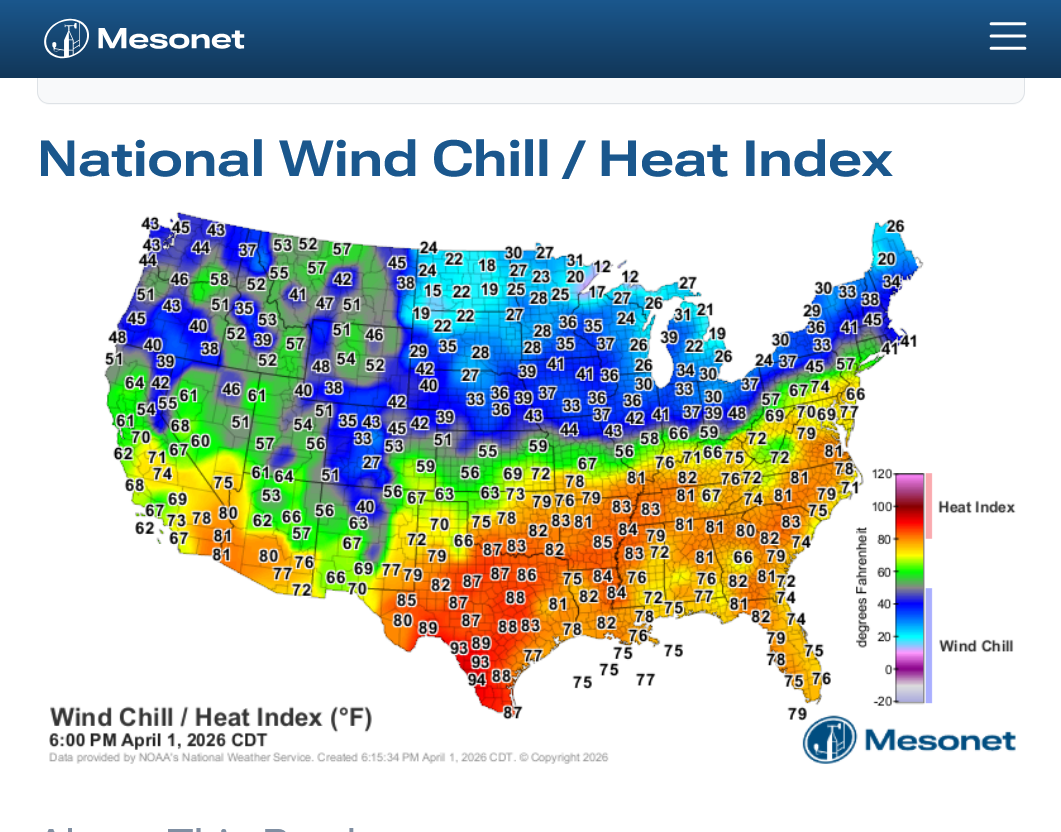
Another 60+ temperature contrast on either side of this system, something we've seen repeatedly in the last month with very cold air in Canada/Alaska and record heat in large swaths of the US.
The top map is the 6pm image, the 2nd one is updated every hour.
https://www.mesonet.org/weather/air-temperature/national-wind-chill-heat-index

Director, Seasonal Forecasting
Atmospheric and Environmental Research
JANUS Research Group
March 30, 2026
https://published.aer.com/aoblog/aoblog.html
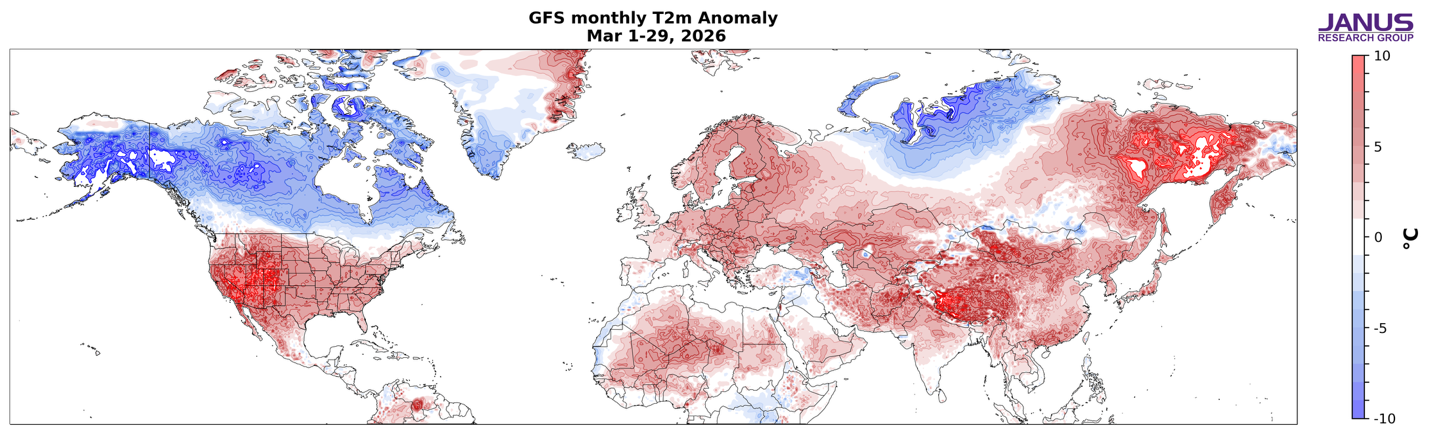
Previous discussion between Larry and metmike related to this incredible pattern!!!
Re: Re: Historic SW US March heatwave
By metmike - March 22, 2026, 2:58 p.m.
Re: Historic SW US March heatwave
By WxFollower - March 24, 2026, 7:49 a.m.
++++++++++
Scroll down from those links
Your favorite weather broadcasters are live tonight:
Tracking the most adverse weather below:

Norman Oklahoma:


Tulsa Oklahoma:
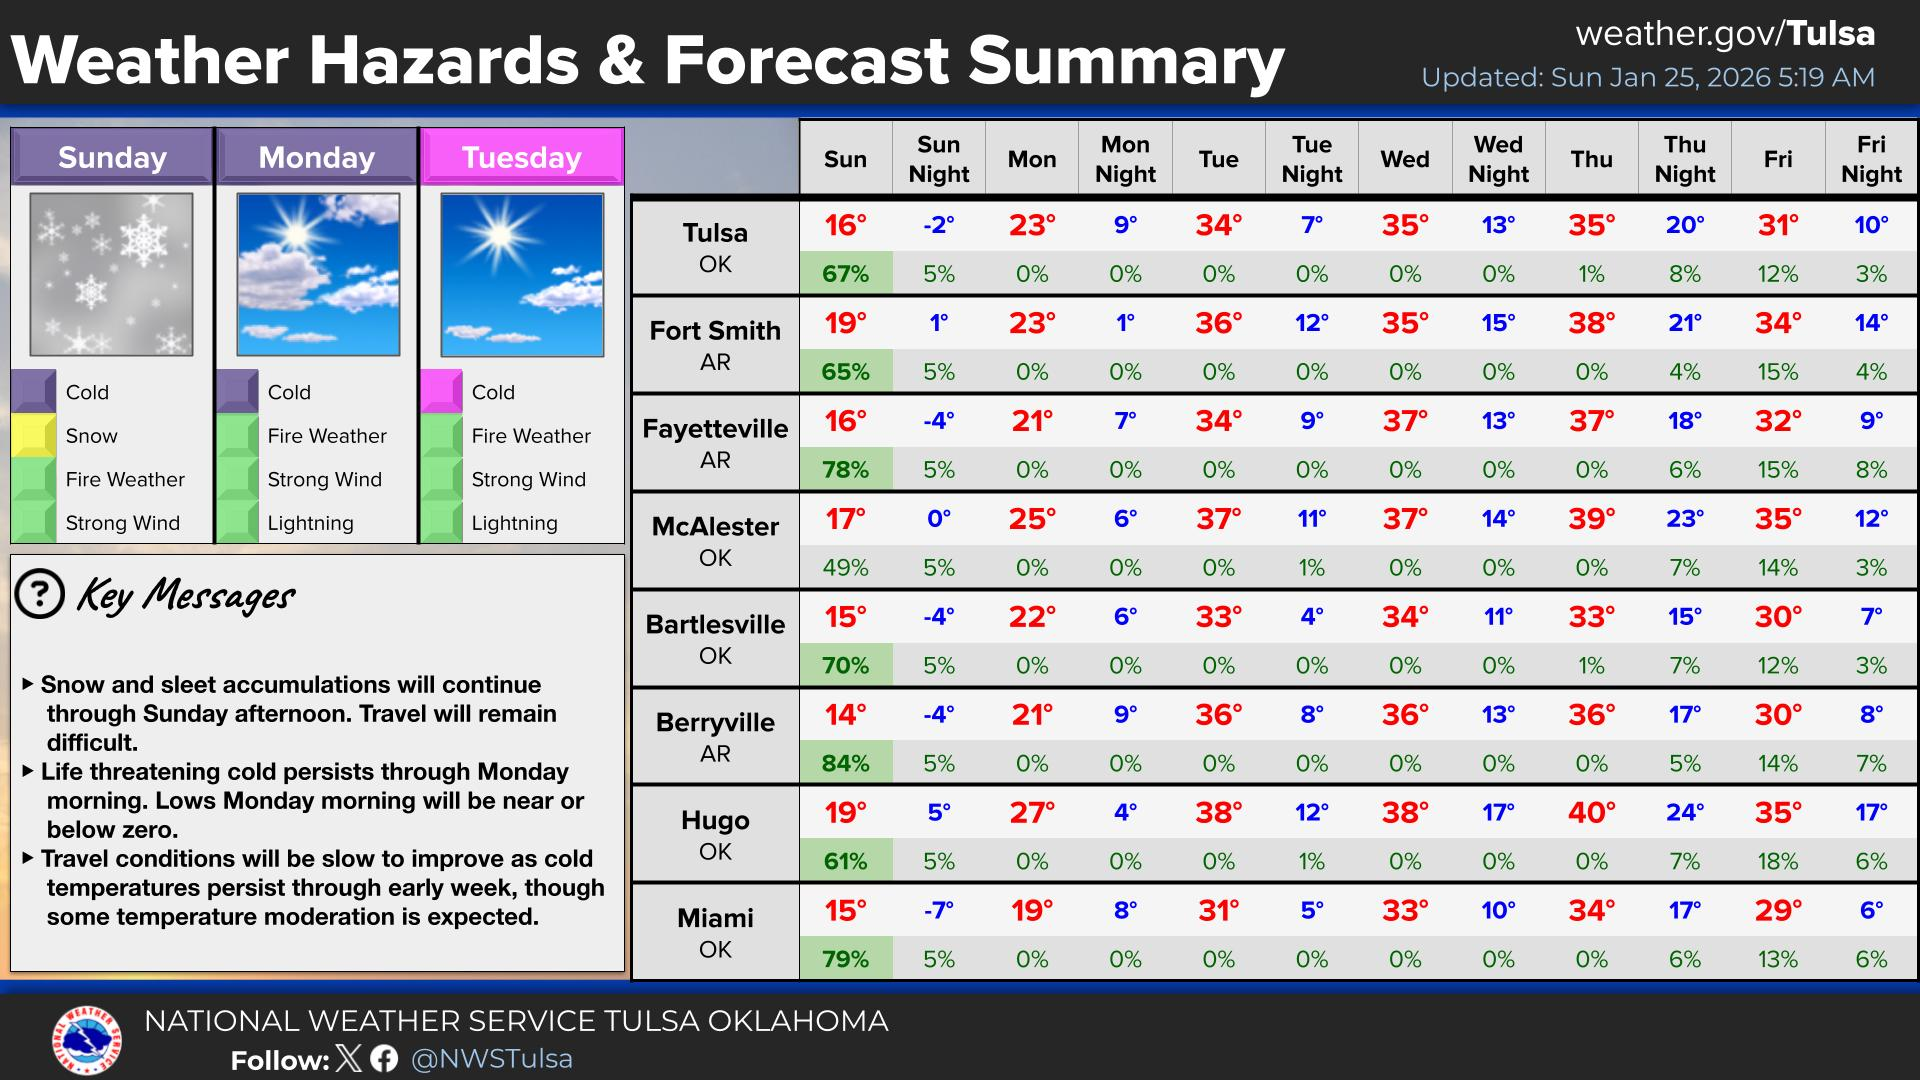
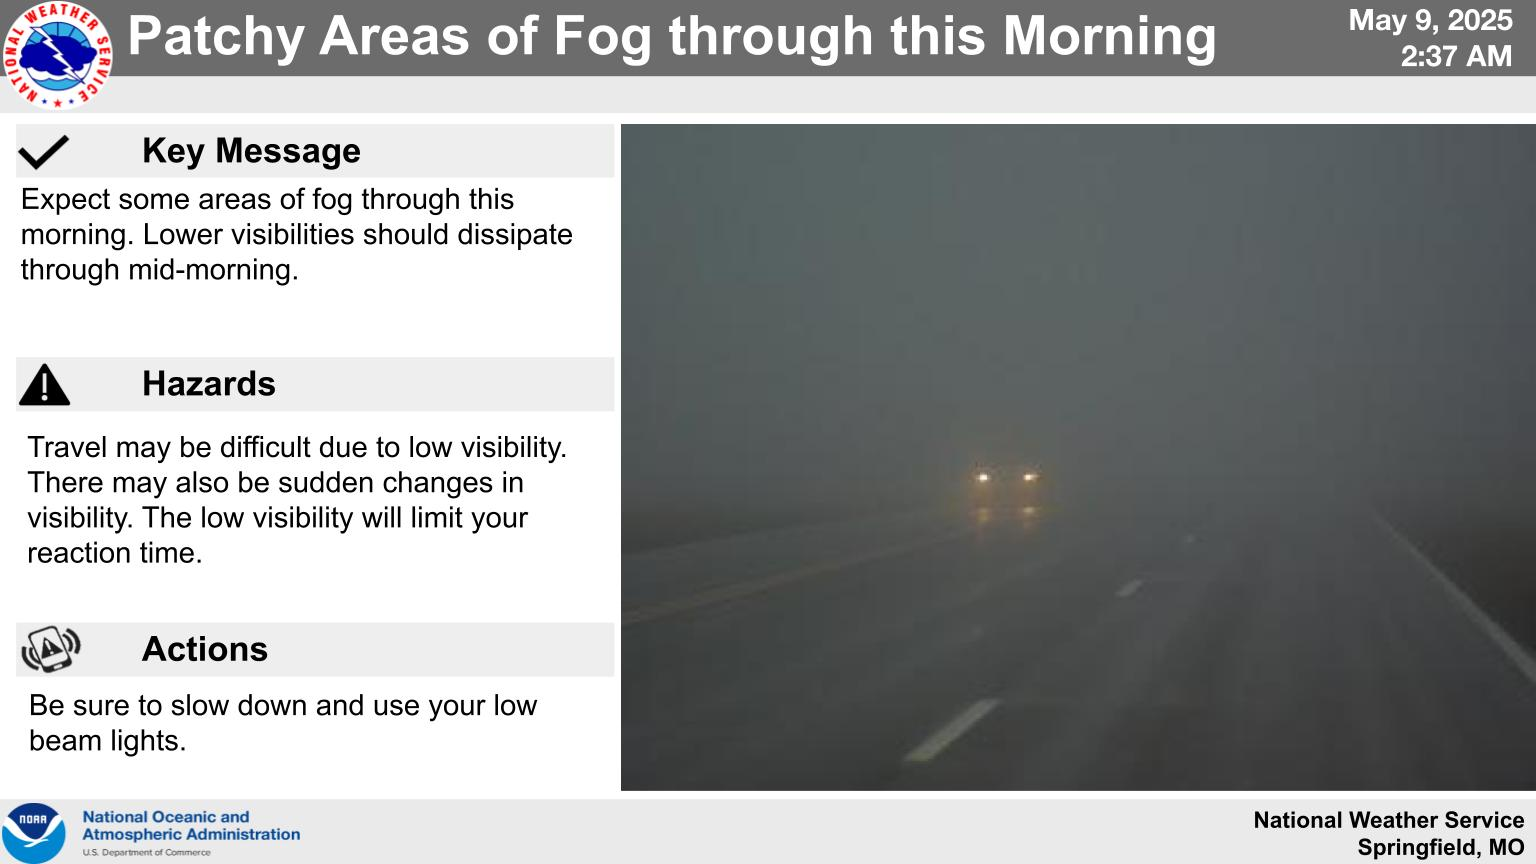
NWS Forecast Office Springfield, MO


Total snow forecast the next 4 days:
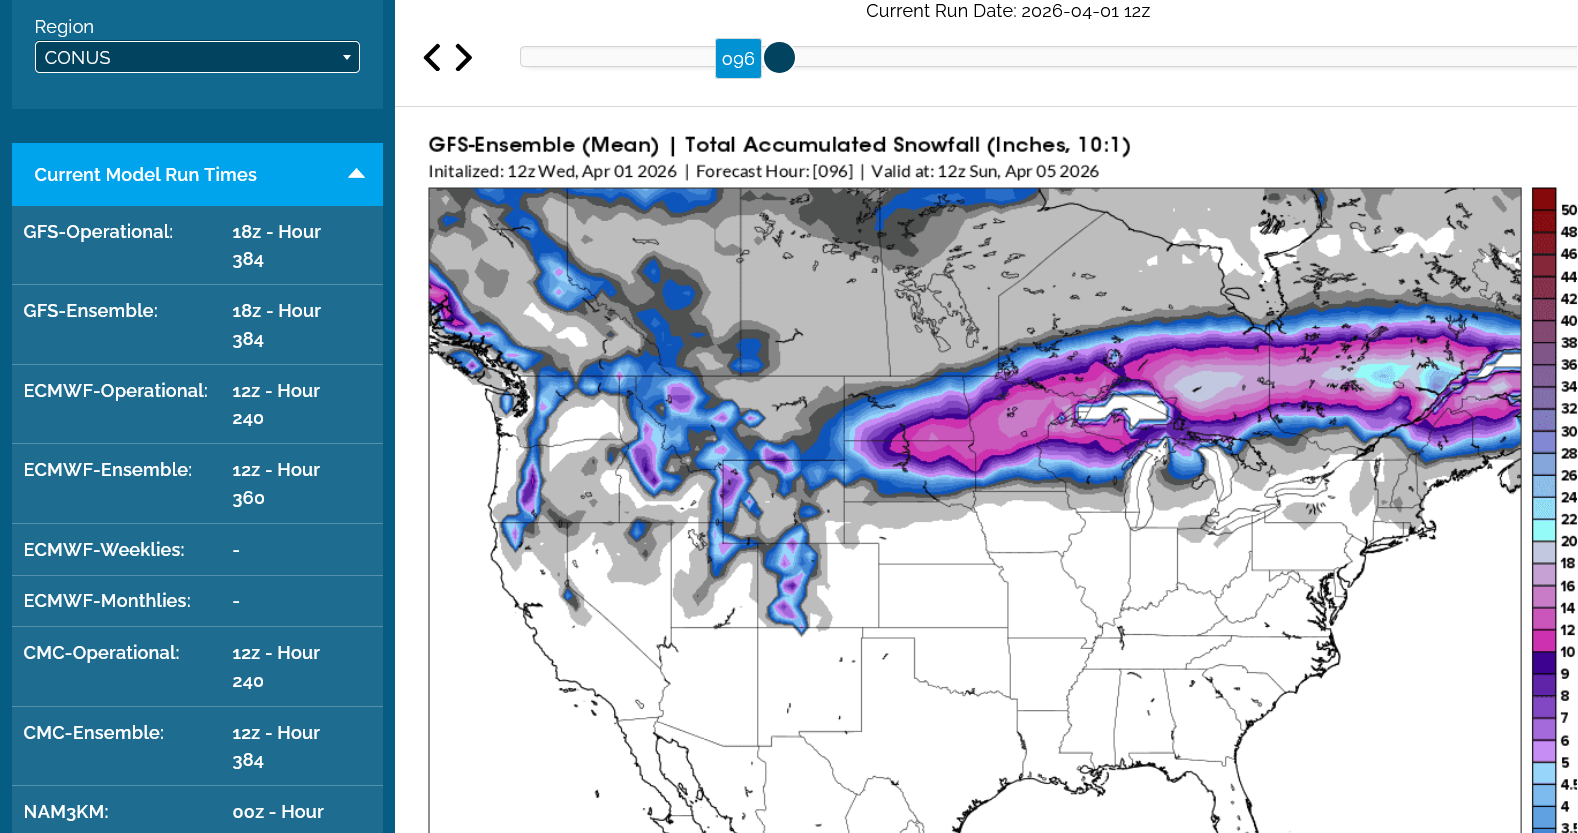

+++++++
NWS Forecast Office Lincoln, IL


Current Hazards at the link below.
For your NWS and county, go to the link below.
Then you can hit any spot on the map, including where you live and it will go to that NWS with all the comprehensive local weather information for that/your county.
This link below provides some great data. After going to the link, hit "Mesoanalysis" then, the center of any box for the area that you want, then go to observation on the far left, then surface observations to get constantly updated surface observations or hit another of the dozens of choices.
+
+++++++++
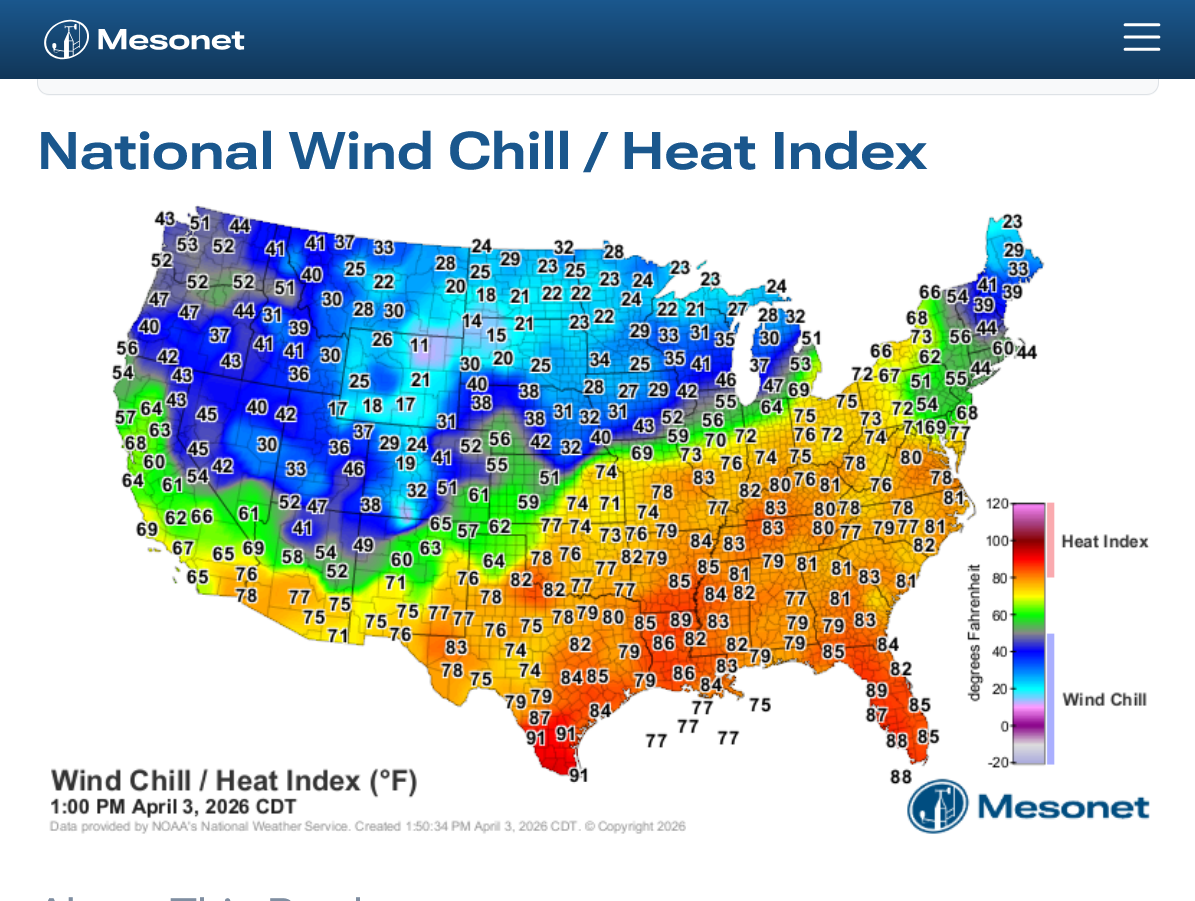
Another 60+ temperature contrast on either side of this system, something we've seen repeatedly in the last month with very cold air in Canada/Alaska and record heat in large swaths of the US.
The top map is the 1pm image, the 2nd one is updated every hour.
https://www.mesonet.org/weather/air-temperature/national-wind-chill-heat-index
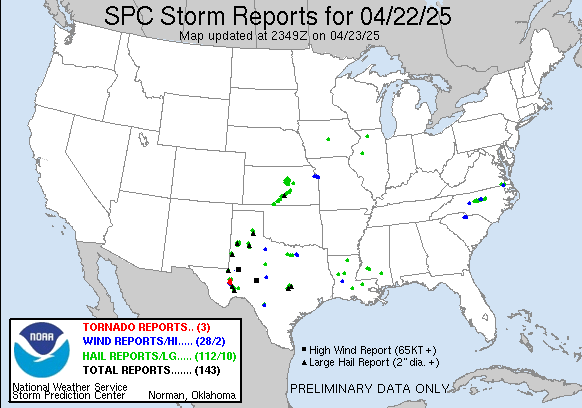
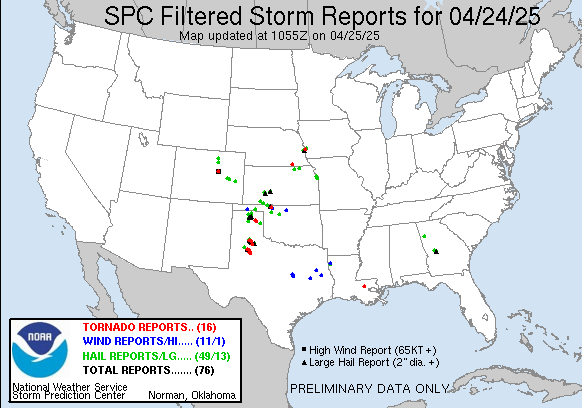
Severe weather this week Tue-Fri. Not that bad!
https://www.spc.noaa.gov/climo/reports/260403_rpts.html