The following is very interesting as regards the controversial topic of potential significant deep ocean heating from sources independent of AGW:
Apr 28, 2026
by David Appell, Phys.org
Scientists found that up until 2016 that the global mean sea level (GMSL) "budget," accounting for all the energy flows that create sea level rise, was "closed," but since then it has developed a hole in it. The budget is no longer closed, at least according to ocean heat data, down to 2,000 meters. Where was the missing cause for the latest sea level rise?
Now a new examination of sea level in the global ocean since 2016 has closed the GMSL budget and brought the sea level books back into order. The new researchappears in the journal Earth's Future. The paper is important for showing that deep ocean heating can no longer be ignored when considering sea level rise and its acceleration.
Deep ocean heat's growing role
In particular, the researchers, with lead author Anny Cazenave, an emeritus scientist at the Laboratory of Space Geophysical and Oceanographic Studies (LEGOS) at Toulouse, France, found that accounting for sea level rise from expansion due to added heat in the deep ocean, below 2,000 meters, allowed the GMSL budget to be "almost closed" since 2016.
"The next step," they write, "will be to determine whether the recent deep ocean change is due tointernal climate variability, forced anthropogenic response or a combination of both."
https://phys.org/news/2026-04-anomaly-global-sea-deep-ocean.html
———————————————
Does this imply that deep ocean seismic activity MAY actually be an independent nontrivial source of ocean warming? Perhaps this may help explain the pockets of extreme ocean warming such as has been the case in the W PAC? Keep in mind that David Appell is not an AGW skeptic and this isn’t at all minimizing the warming effects of AGW, itself, as regards ocean warming nearer to the surface due to GW from AGW.
This is an awesome, very profound topic, Larry!
I have wondered many times about the potential contribution from geothermal activity at the bottom of the ocean floors but there isn't enough empirical data/measurements to use in order to have an informed opinion.
Previous posts that discuss "The Blob"
Re: Re: Re: Re: Re: 6-18-23 the next tropical depression
By metmike - June 18, 2023, 4:40 p.m.
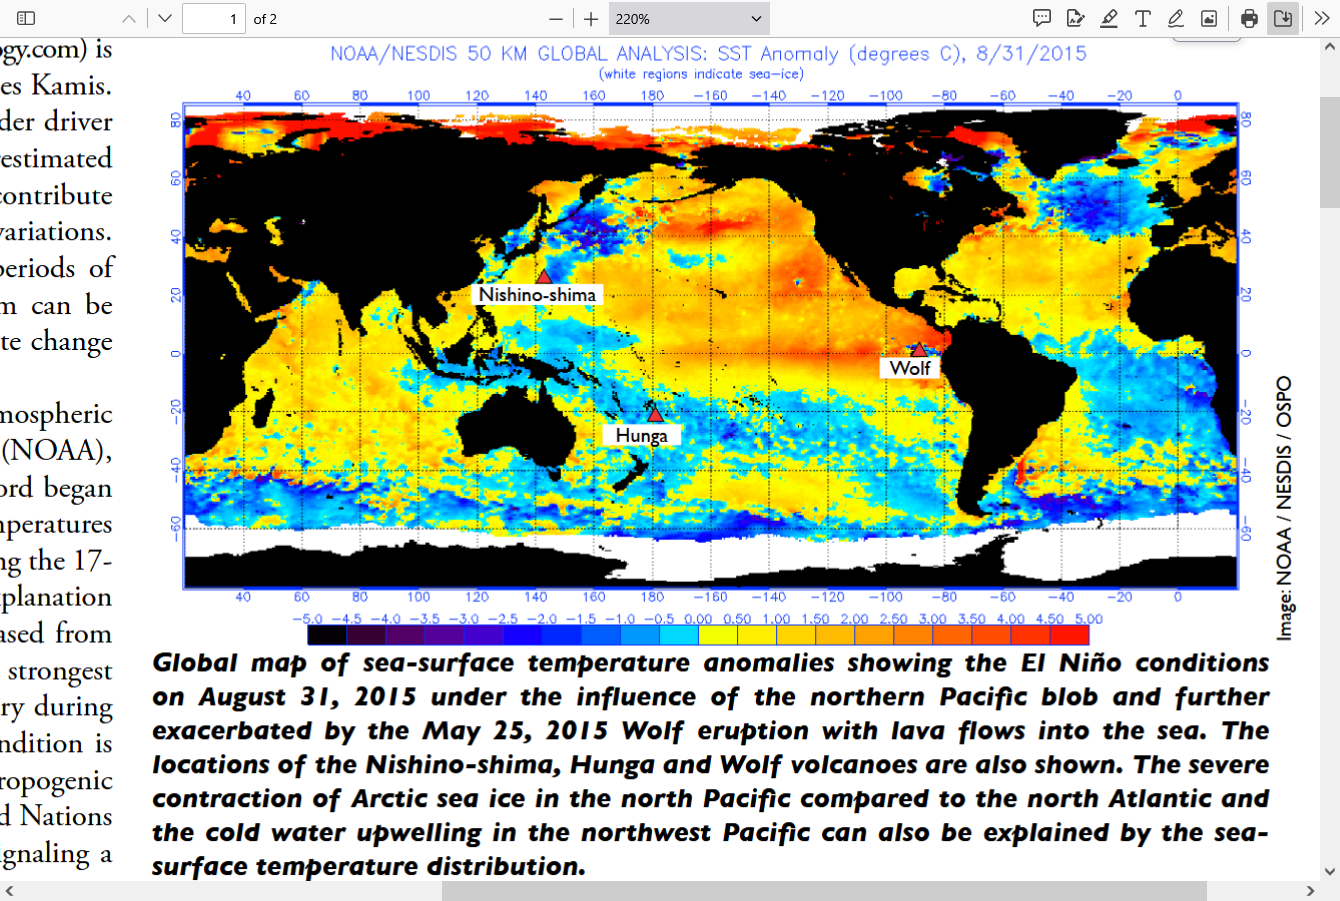
El Niño/ENSO update May 16, 2023
By metmike - May 23, 2023, 1:57 p.m.
Turns out that my search for past posts on this, resulted in me stumbling on these links/awesome videos from that last thread.
With the Super Duper El Nino approaching, there couldn't have been a better find!!!!
Your contribution/gift to us 3 years ago, Larry is coming back to really contribute here in 2026!
Re: Re: Re: El Niño/ENSO update May 16, 2023
By metmike - May 23, 2023, 1:17 p.m.
Thanks much, Larry!
This is really impressive and something I've been neglecting so thanks for your persistence and wonderful, very insightful contributions.
From the site that you provided a link to earlier:
https://www.cpc.ncep.noaa.gov/products/precip/CWlink/MJO/enso.shtml#current
https://www.cpc.ncep.noaa.gov/products/analysis_monitoring/enso_update/sstanim.shtml
 |
 |
https://www.cpc.ncep.noaa.gov/products/analysis_monitoring/enso_update/wkxzteq.shtml
 |
 |
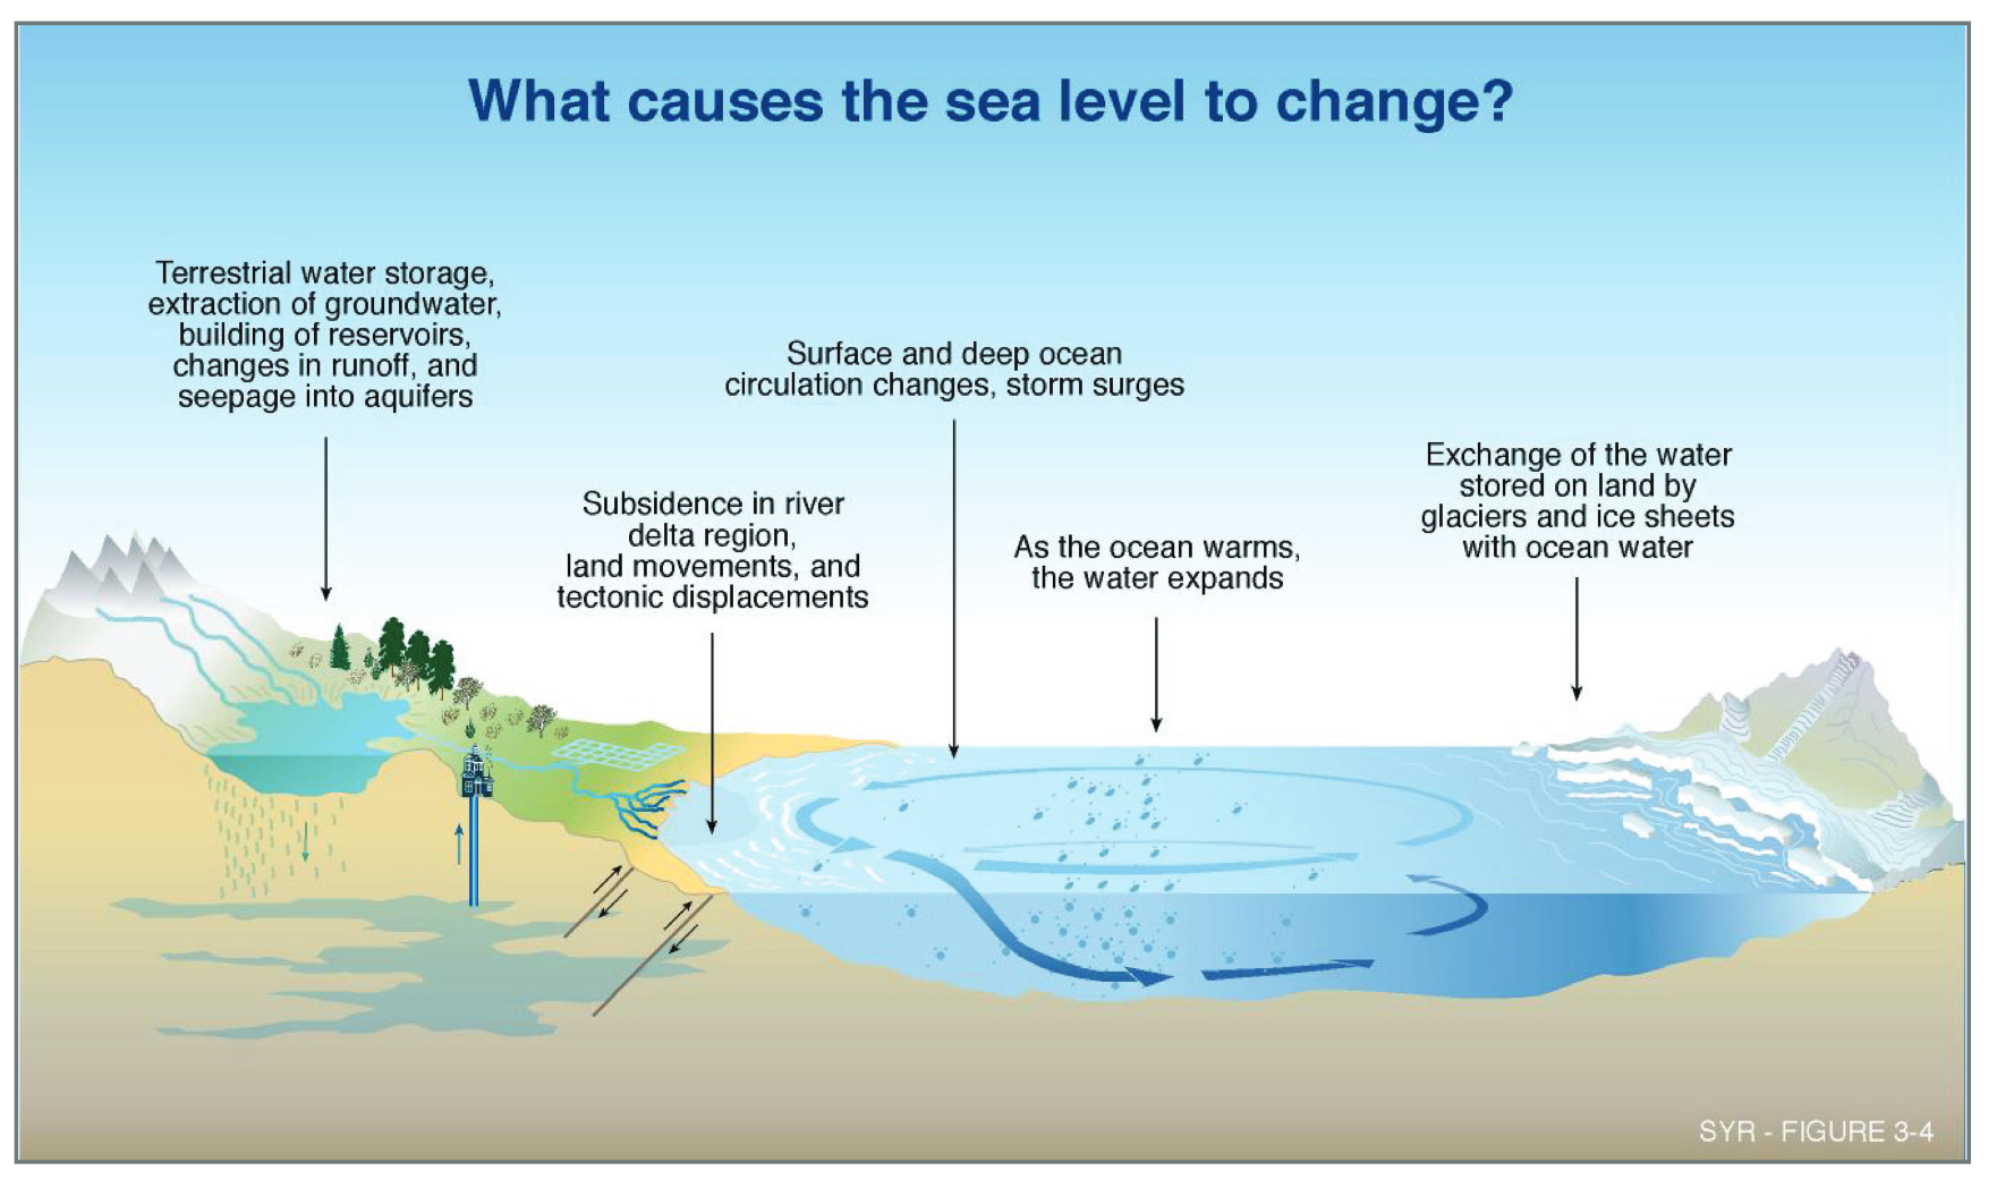
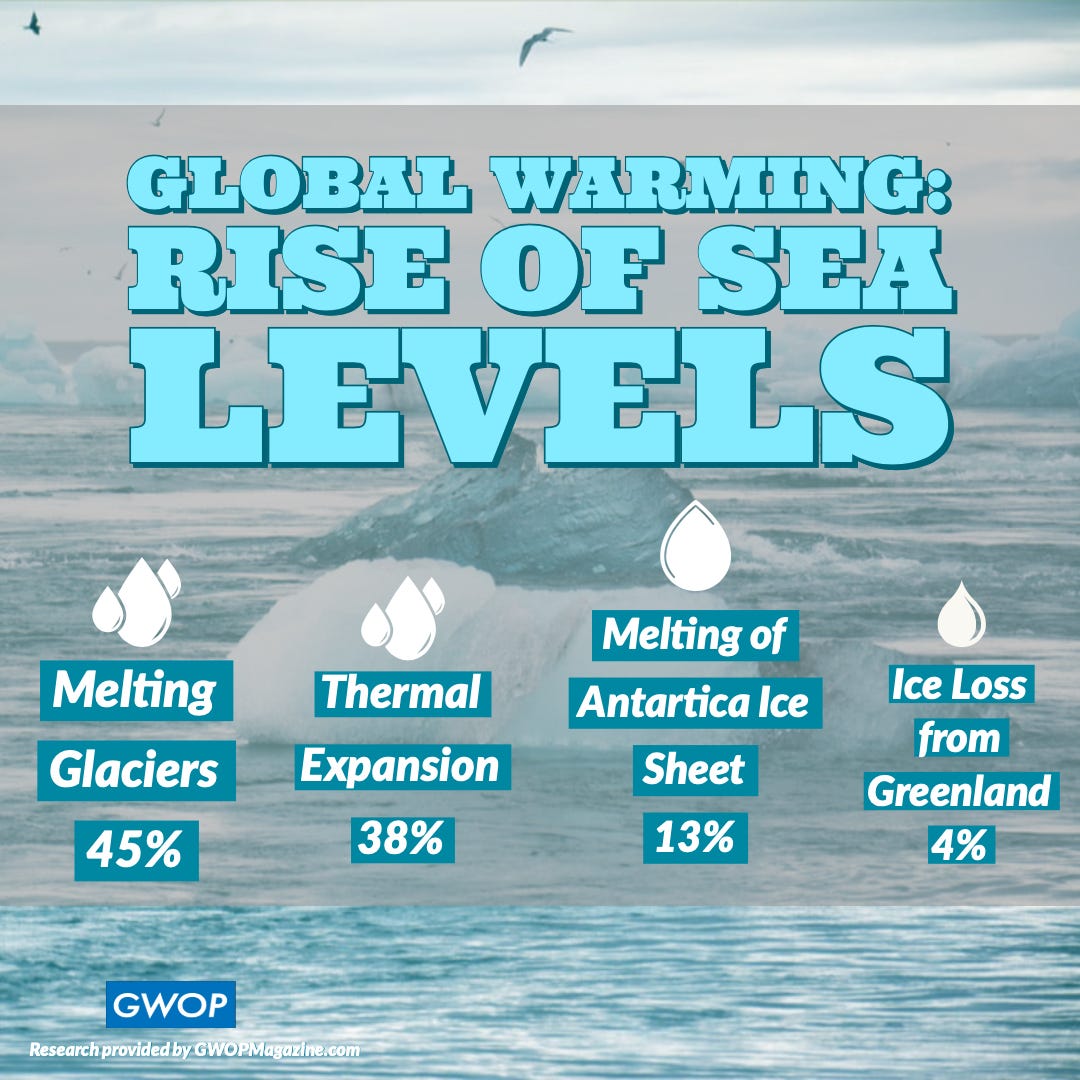
Just to note for everybody (Larry knows)that the article is focused on accounting for the missing explanation for why sea levels increased a bit more than expected using the currently known contributions.
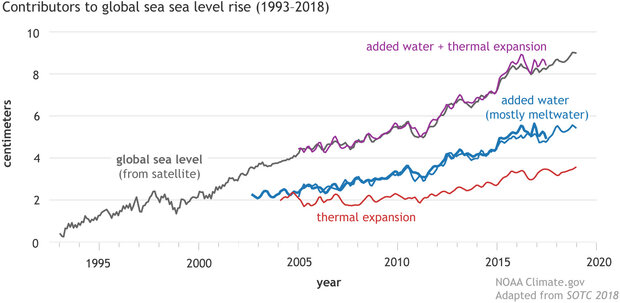
More than 30% of the increase in sea levels is from the oceans warming that causes thermal expansion. We are accurately measuring the top layers and can accurately calculate how much that contribution is. As well as from melting ice on the planet and from runoff that comes from land that includes sources, like rainfall and ground water used by humans that makes its way to the oceans.
I wonder if they could be off on runoff from land since we are massively drawing down aquifers and having record rain events?
Regardless, it’s a fascinating topic. We actually know much more about the moon that’s 238,000 miles away than we do about the bottoms of deep oceans, miles below the surface and much closer to intense heat sources below the bottom of the ocean.
I was under the impression that water had a maximum density at 4C. Turns out that's wrong in deep salt water, which maxes at 0C. Nice to learn something today! Thanks, guys.
Some links at a Reddit page - https://www.reddit.com/r/askscience/comments/1yiuh4/how_cold_is_the_water_at_the_bottom_of_the/
Thanks very much for that fascinating tidbit, patrick.
I didn't know some of that!
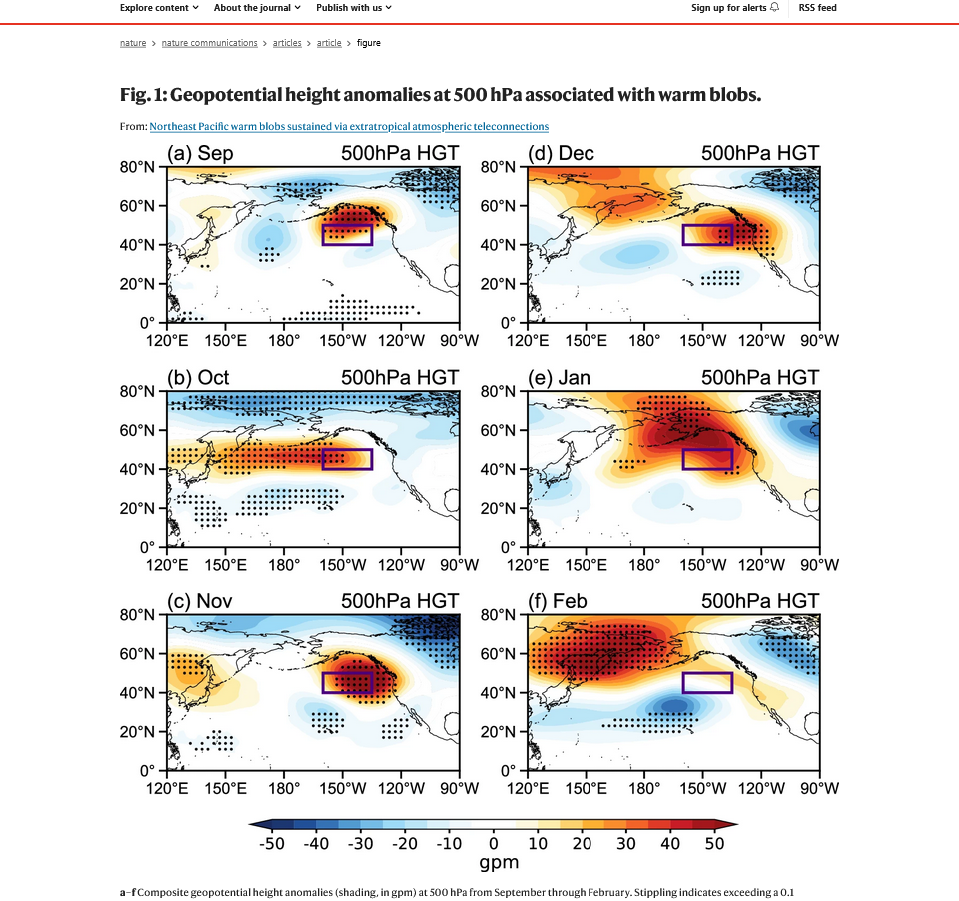
Most of these blobs are explained by circulations in the atmosphere and water!
https://www.nature.com/articles/s41467-024-47032-x
https://www.cnn.com/2025/09/19/climate/pacific-ocean-blob-hot-water-global-warming
++++++++++++++
https://www.science.org/doi/10.1126/sciadv.adx9452

I don't expect people to read all this but am just sharing what I read most of in case there is interest in learning more.
This is a wonderful topic. Thanks again, Larry! The oceans are 2/3rds of the surface area of the planet and contain the VAST majority of heat and water. They mean EVERYTHING when it comes to our weather patterns, short and long term. Most water vapor/precipitable water in the air for rain/snow making came from the oceans!
Geothermal heat: an episodic heat source in ocean
file:///C:/Users/Mike/Downloads/ImpEng2017S.pdf

https://sky-lights.org/2018/10/15/qa-thermal-expansion-and-sea-level-rise-part-1/

Ocean Thermal Stratification: The oceans are warming mostly on the surface, where heat from the Sun and atmosphere is absorbed and diffused through the first 200 meters. This surface layer has an average temperature of 17 °C, so it has a lower density and floats on top the cooler water below. The layer is well-mixed by the action of wind, waves, currents, convection, and the addition of fresh water from rain, rivers, and melting ice. Sometimes called the mixed layer, it is essentially isolated from the water below.
Under that lies the thermocline spanning from 0.2–1.0 km depth on average. Temperature decreases linearly with depth from 17 °C at the top to 4 °C at the bottom. Heat from the warm surface layer diffuses downward slowly, by conduction only. The bottom of the thermocline is defined by the temperature at which water is most dense.
Below that lies the cold deep water. Its temperature starts at 4 °C just under the thermocline and decreases to near 0 °C at the ocean floor. Note that water at temperatures less than 4 °C is normally less dense than water at higher temperatures, and thus would float to the surface. However, water at the ocean floor is subjected to a pressure of 1000 bar (16,000 psi) compressing it to a density 5% greater than normal, so this water remains at the bottom.
+++++++++++++
Since our calculation will focus on the top-most layer of water, we’ll set H = 0.2 km. Measurements reported by the IPCC were made to depths averaging 2 km, so data in this range are reliable.
Volumetric Thermal Expansion: Ocean surface temperatures have been rising about 0.12 degrees Celsius per decade on average over the past 50 years — a total ΔT of +0.6°C. That will be the baseline for our calculation. We’ll convert back to units of mm/yr at the end. First thing we need is the volume of water (Vo) that’s doing the expanding. From the model that would be:
Vo = π R2H = π(1.07×10⁴ km)2(0.2 km) = 7.2 × 10⁷ km3
As that volume of water warms it will expand. The volumetric thermal expansion of water is given by:
ΔV = βV0ΔT
where ΔV is the change in volume, β is the (substance-specific) coefficient of volumetric expansion, V0 is the original volume, and ΔT is the temperature change in °C. But it’s not quite that simple …
Coefficient of Thermal Expansion: For water, β is not constant. It’s not even linear. β = 0.88 × 10⁻⁴/°C at T = 10 °C, but it climbs to β = 2.07 × 10⁻⁴/°C at T = 20 °C. By the time the temperature reaches 60 °C, β will climb to 5.16 × 10⁻⁴/°C. In short, the warmer water gets, the faster it expands. The average ocean temperature above the thermocline is 17 °C, so we’ll interpolate (see thumbnail below) to get β = 1.78 × 10⁻⁴/°C. But these numbers are for pure water.
For seawater of average salinity (3.5%), β is about 25% higher compared to pure water. So we’ll use β = (1.25)(1.78 × 10⁻⁴/°C) = 2.23 × 10⁻⁴/°C. Thermal expansion is mechanically driven by Brownian motion via particle-to-particle collisions. The mutual repulsion of ions dissolved in seawater adds to that effect.
Calculation: We can now find the increase in volume from thermal expansion.
ΔV = βV0ΔT = (2.23 × 10⁻⁴/°C)(7.2 × 107 km3)(0.6 °C) = 9.63 × 10³ km3
That’s almost half the total volume of the Great Lakes! All that “extra” water has to go somewhere, and unfortunately the only possible direction is up. We can calculate the increase in H as:
ΔH = ΔV/πR2 = (9.63 × 10³ km3) / π(1.07 x 10⁴ km)2 = 2.2 × 10⁻⁴ km = 27 mm
That’s the sea level rise over a 50 year period, so the average rate has been 27/50 = 0.54 mm/yr.
This is just over half the value of “1 mm/yr” cited by your source. Fact is, these were all approximate calculations based on averages and partial data sets. Starting from first principles and getting so close to the cited value makes me confident in my model’s predictions.
Uncertainties: My model ignored thermal expansion within the 0.8 km thick thermocline, where the temperature steadily decreases from 17 °C at the top to 4 °C at the bottom. We could use calculus to find this additional volume of expansion inside the thermocline, but I leave that as an exercise for the curious reader. Suffice it to say this will further increase ΔH.
More recent data indicate ocean thermal expansion is now contributing 42% of the total sea level rise, rather than the 33% suggested by your source — or the 18% predicted by my model. The expansion rate is increasing for three reasons: increase of β with increasing T, melting of sea ice that reflects sunlight back into space, and greater heat input from the warming atmosphere.
So yes, TKL, thermal expansion of seawater is a significant part of sea level rise. Especially troubling to me is the melting of sea ice in polar regions. Open water absorbs far more sunlight than highly reflective ice. This warms the water and melts even more ice — it’s a vicious feedback cycle that might already be too advanced to stop.
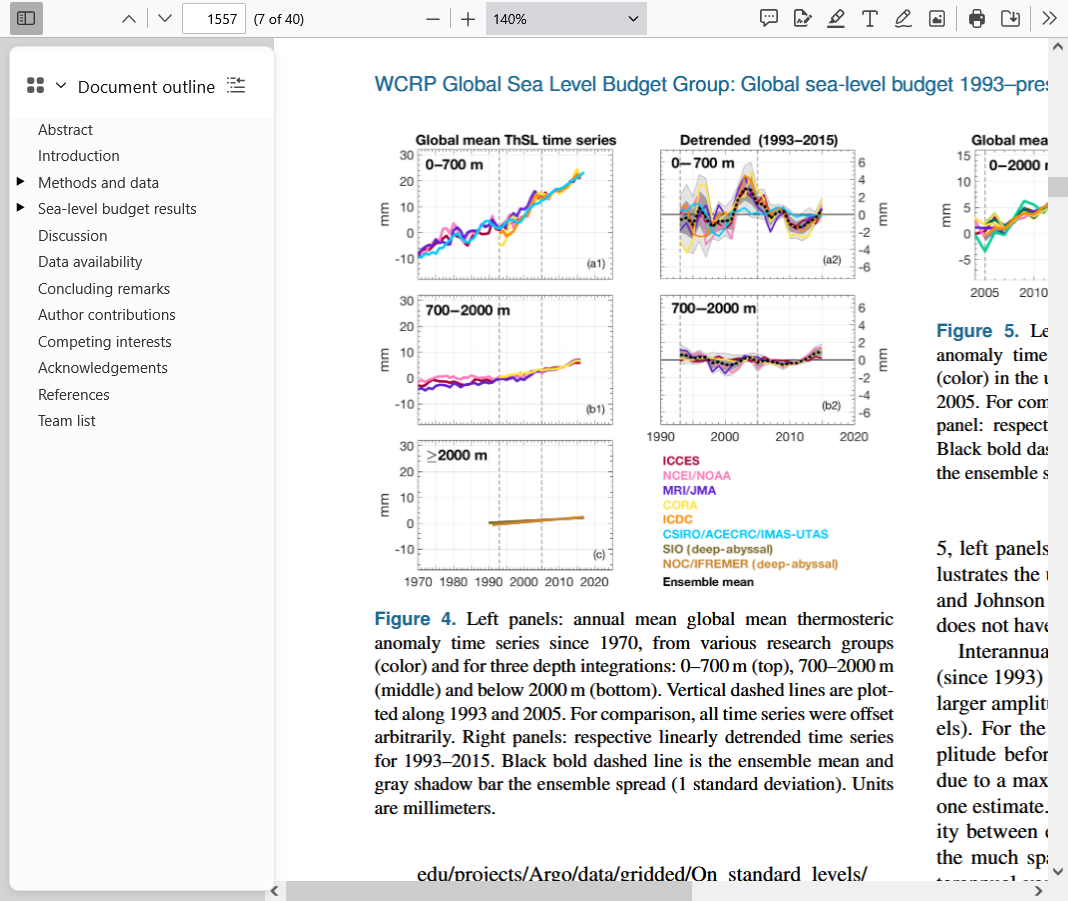
Global sea-level budget 1993–present
file:///C:/Users/Mike/Downloads/noaa_65580_DS1.pdf

It dawned on me from thinking about this more that they are overlooking key element.
How much water is evaporated from the oceans compared to how much is returned to the oceans from rain//snow with the amount stored on land taken away.
Every year, that should result in a LOSS of water from the ocean because some of that amount evaporated out will be stored in lakes, massively stored in soils or locked up in snow.
Severe droughts over large regions would reduce that amount lost compared to saturated vertical moisture soil profiles.
Here are some images to help us think about this more! We call this the WATER CYCLE.
In the previous pages that calculate sea level changes, the water cycle is apparently assumed to be in a steady state but this seems flawed to me.


https://scienceinsights.org/what-role-does-the-ocean-play-in-the-water-cycle/
Evaporation is an essential and mysterious part of the water cycle. Solar energy drives evaporation of water from oceans, lakes, moisture in the soil, and other sources of water. In hydrology, evaporation and transpiration (which involves evaporation within plant stomata) are collectively termed evapotranspiration. Evaporation is ultimately caused when water is exposed to air and the liquid molecules turn into water vapor which rises up and forms clouds. Although this value will vary considerably from location to location, hydrologist and climatologists estimate that an average of about 5 feet or 60 inches of water evaporates from the oceans each year.
+++++++++++++
That amount is HUGE! I can't image that there isn't variation each year, just based on small changes in the amount of cloud cover, which would increase or decease the powerful sunshine which powers most evaporation!