Will this week be Bullish?
Thanks very much, fayq!
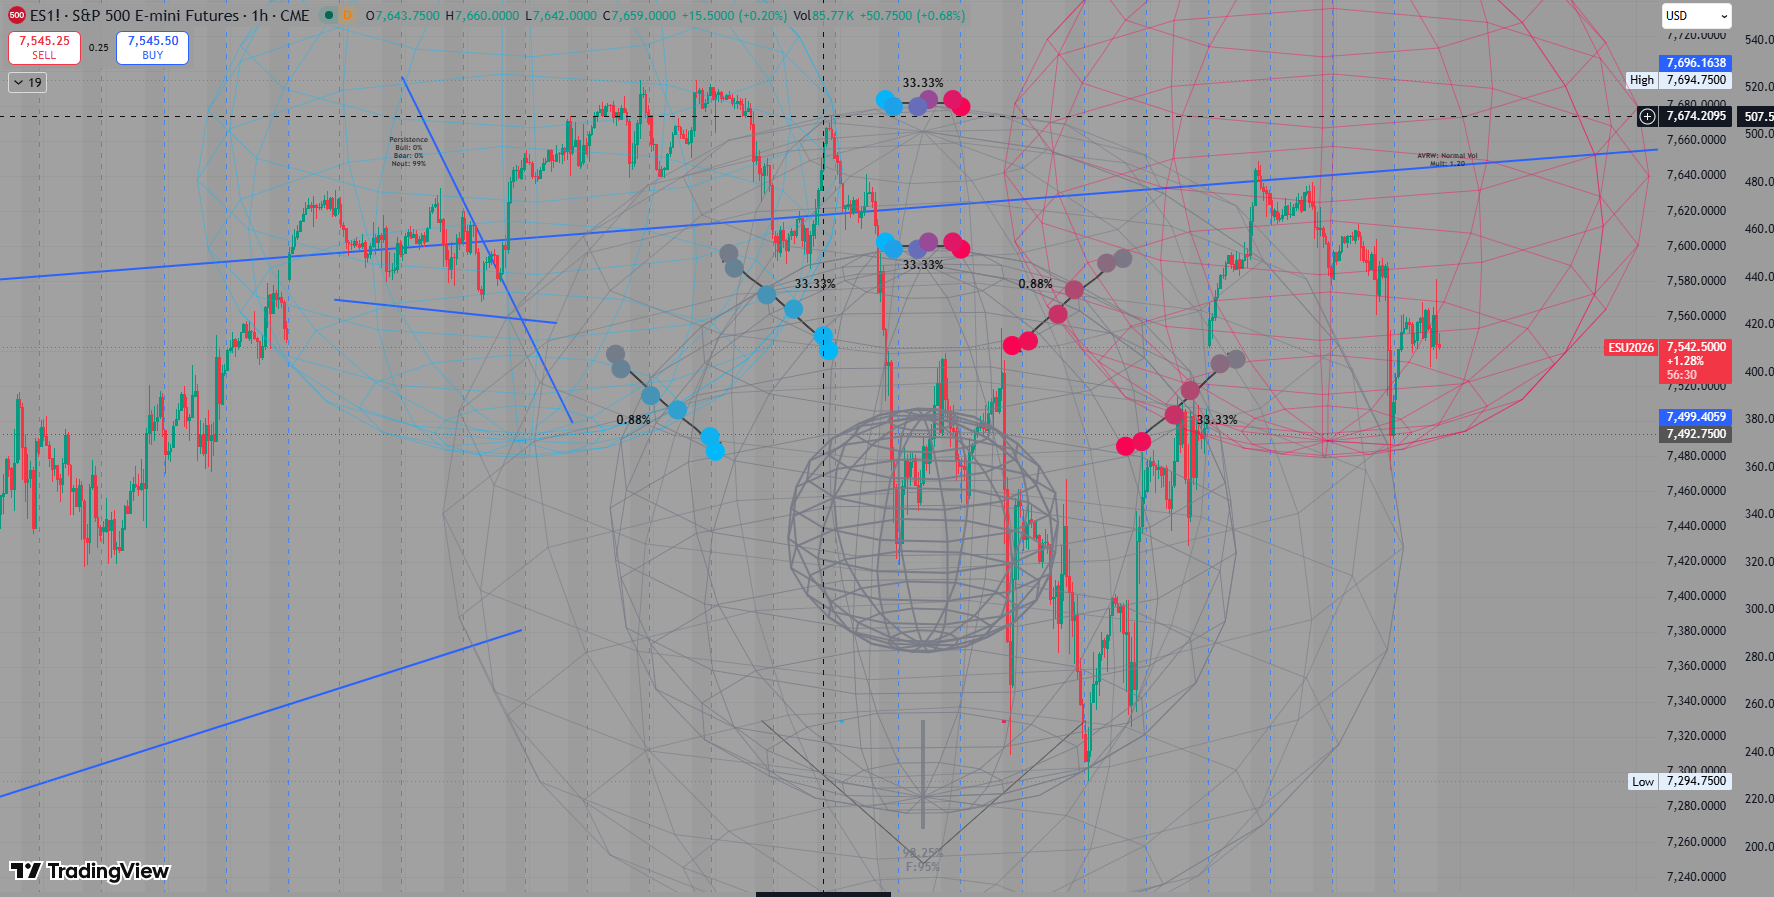
Nice confusing price chart with no explanation from somebody that uses astrology to trade!
I was going to say WT_ (heck)
A little narrative, please
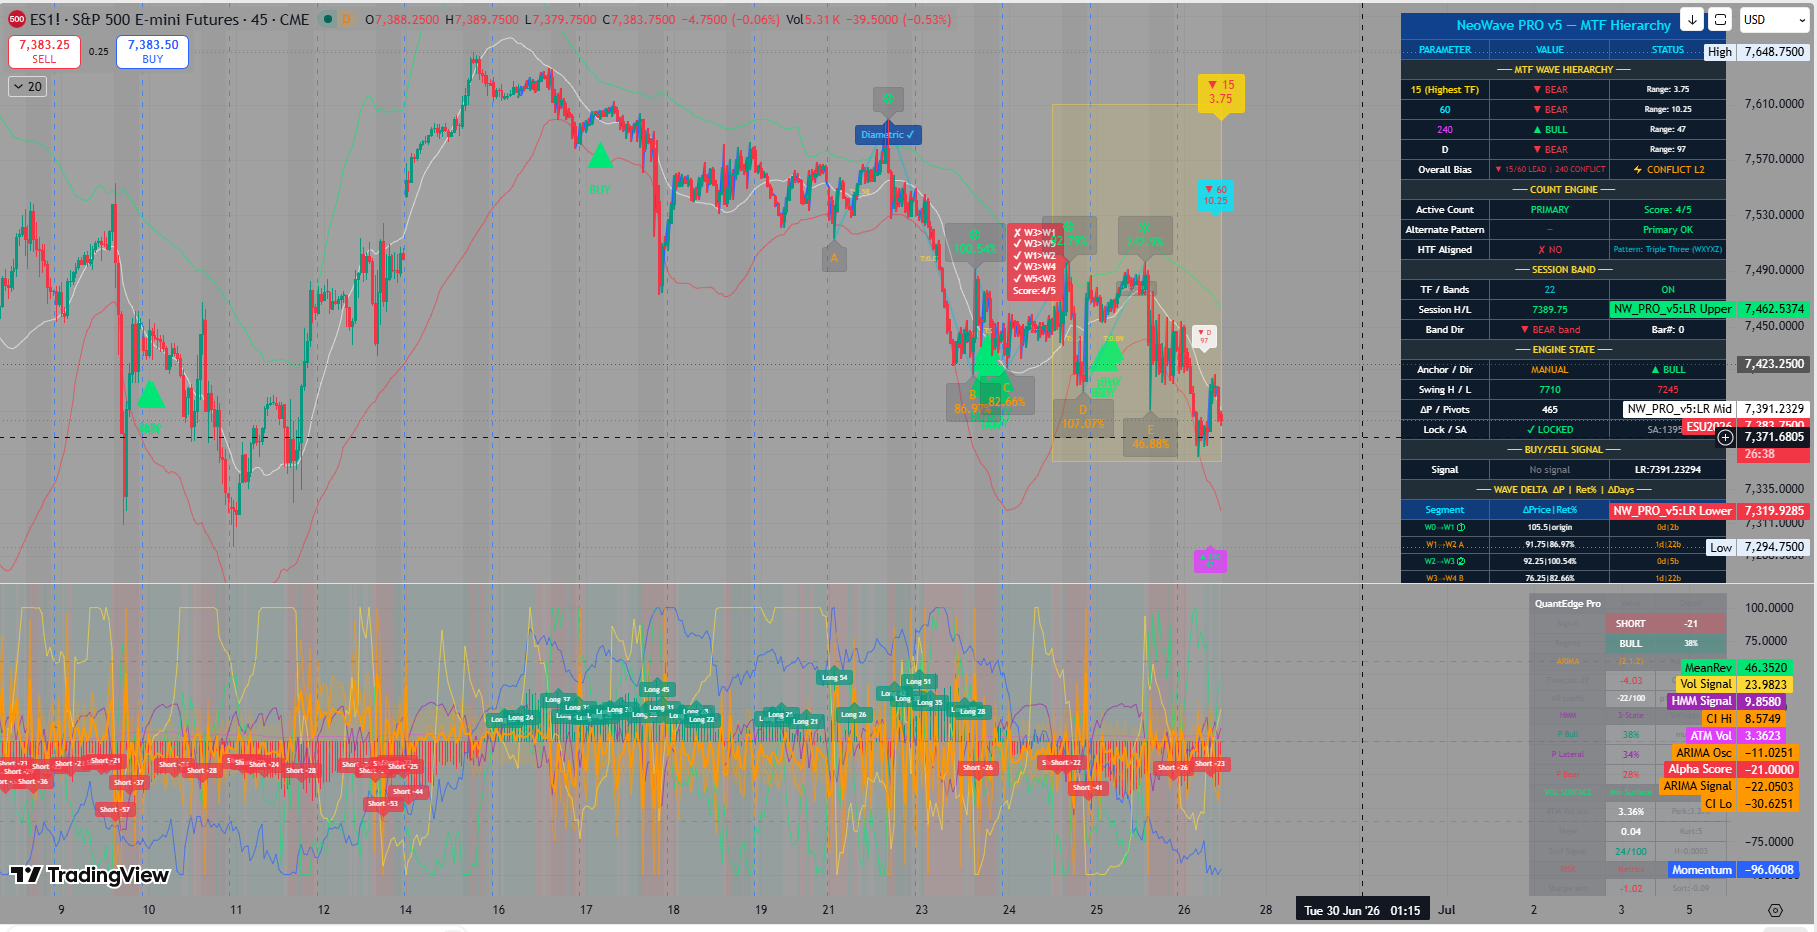
Friends no Astrology just Sphere Shapes and price vibration with the volume distribution Markove Chain price time volume -- and with polynomial regression 3d with three shapes regression red Stops for short and Blue for buying stops and volume distribution with time line and color of sphere show bias look at lower and higher projection and mean revision like once break7442 then lower end is 7368 and will add Vix and Vvix and yields to come up in depth -- my opinion--!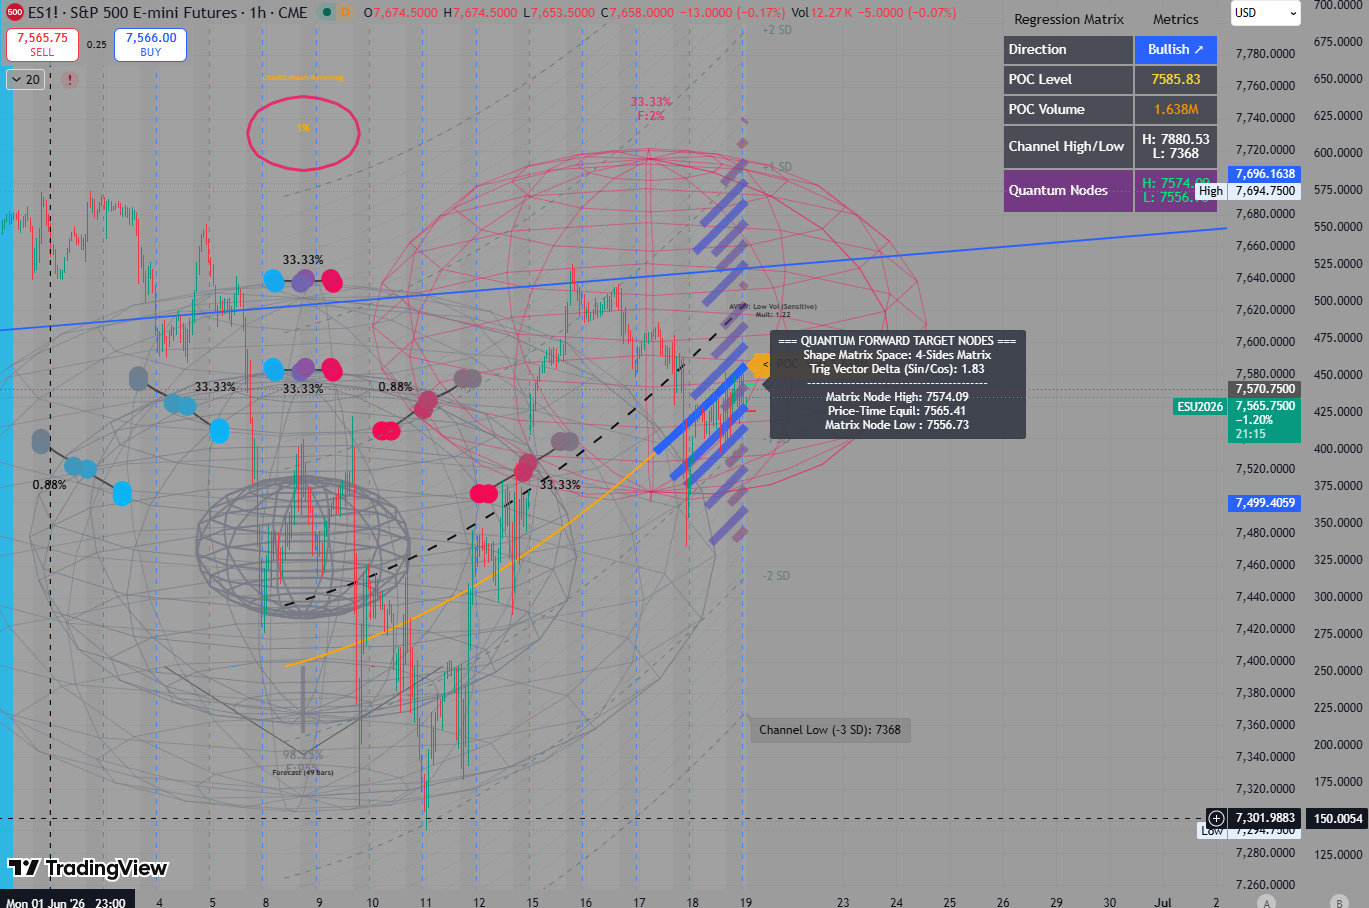
Thanks, fayq!
Something different for sure. Thanks for sharing.
To assist other here, including me:
Artificial intelligence explaination:
This complex analytical framework blends advanced financial engineering and machine learning concepts, merging 3D polynomial regression, Markov chain models, and volume-at-price distributions into a single visual model. [1, 2]
The Framework Explained
Practical Applications & Platforms
While building a native 3D plot with all these exact features requires a custom-built solution (such as a custom Python script or a specialized WebGL application), similar 2D and 3D implementations are actively used in quantitative finance and algorithmic charting:
+++++++++++
What blows my mind is that a guy smart enough to understand and use this, also believes in and uses astrology to trade.
Now for my secret trading system using the weather
Much colder in the Winter =buy natural gas = sell natural gas in the Summer
Much warmer in the Winter = sell natural gas = buy natural gas in the Summer
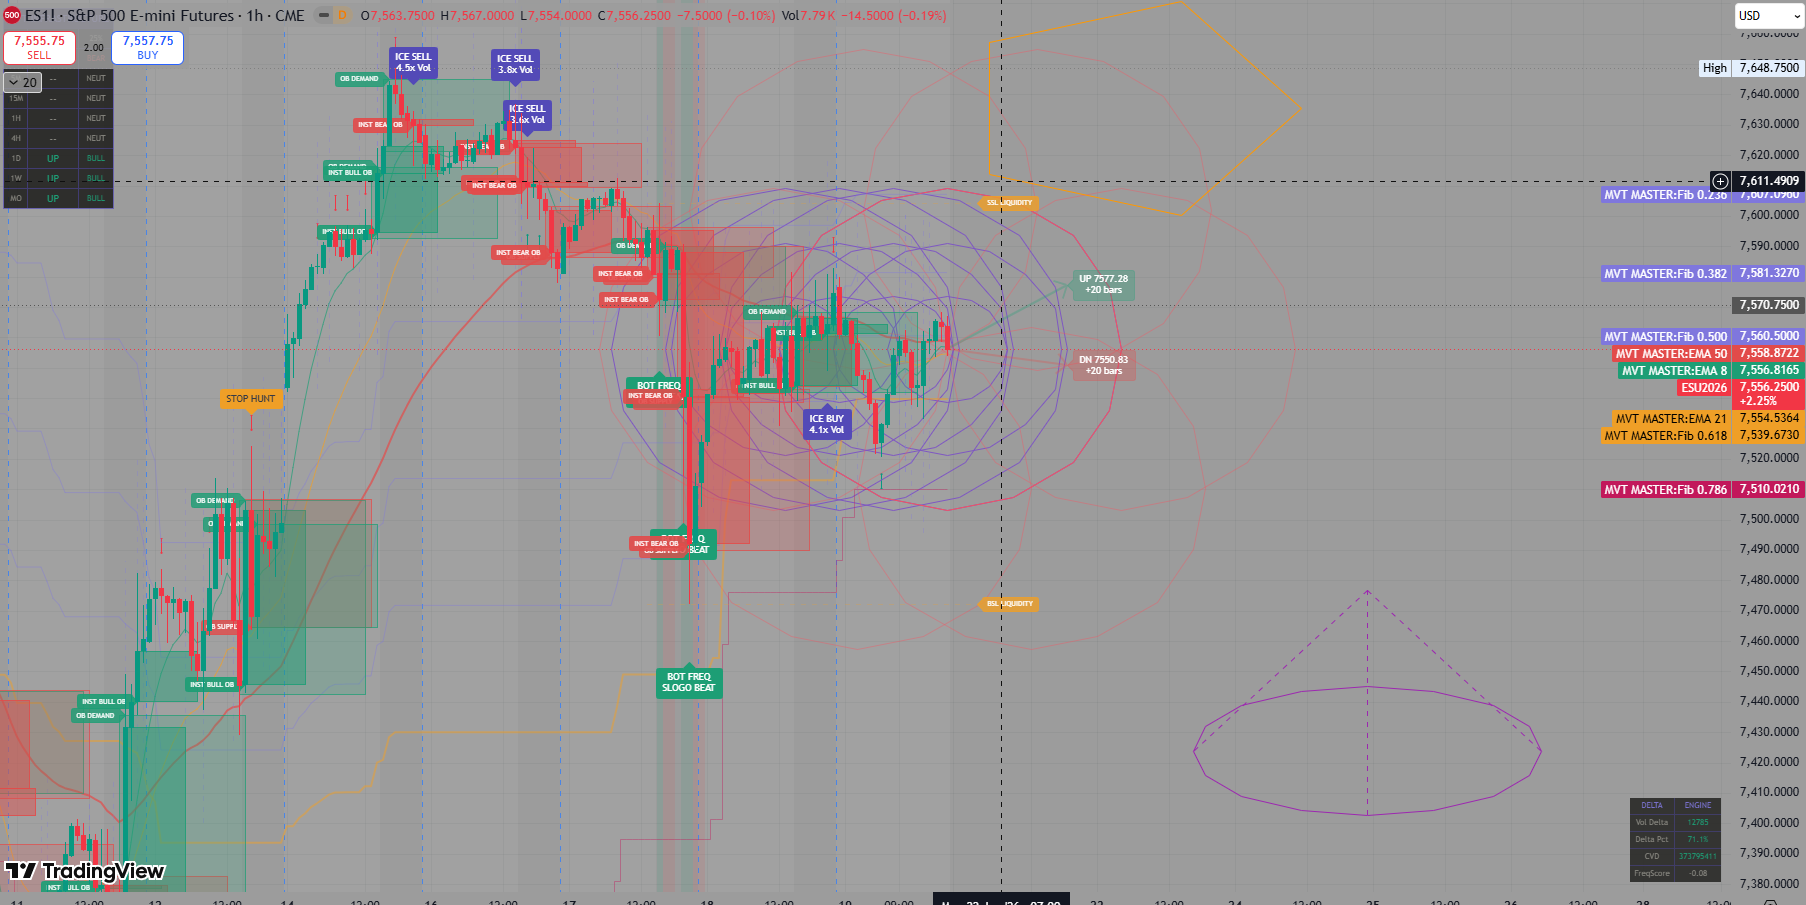
Flower of life--Ratio and ICT/SMC with volume break down and ranges!
Thanks, fayq!
And we should all know that this means??????
I haven't been following the day to day changes in the stock market the last few weeks but see this in the near future for investors with new money to consider:
Is this a good time to invest in the stock market?
Started by metmike - June 18, 2026, 2:56 p.m.
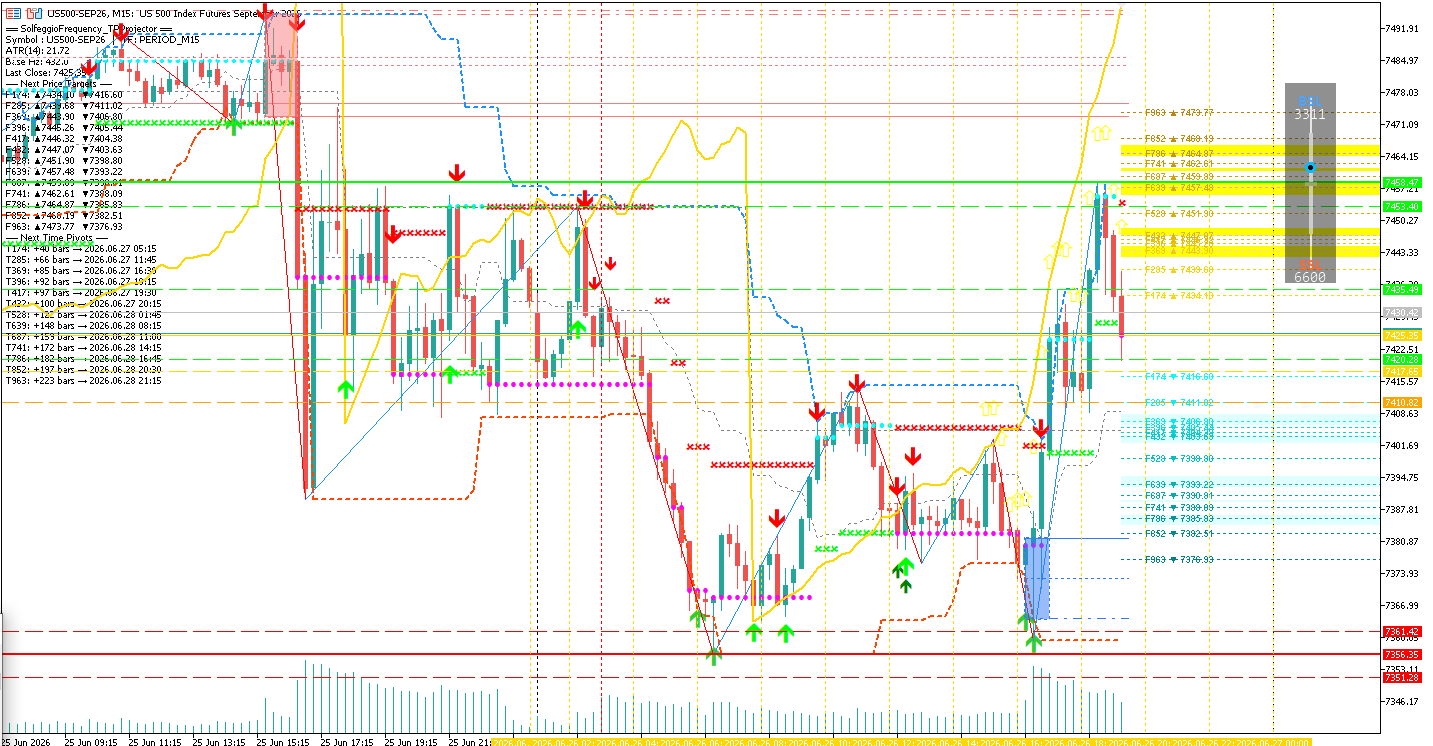
charts interpretation that it can reach new spike High around 7700 if holds 7445 and 7388 then we see correction towards 7000 till mid July 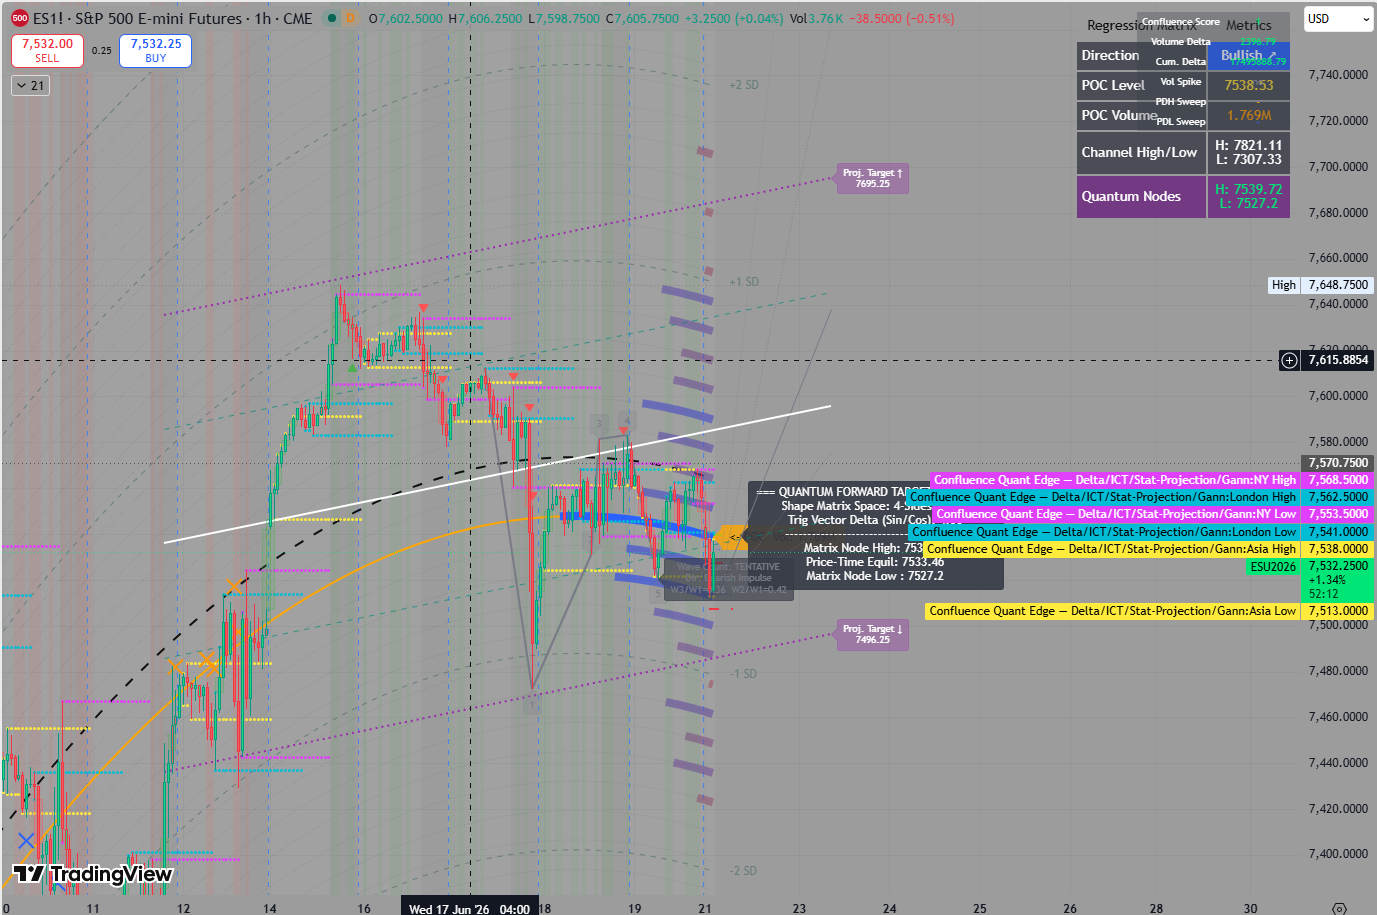
Excellento with the projections appreciated, fayq! Thanks!
Another Brick in the Wall -- All in one AI ASTRO tech fusion!1
Thanks, fayq,
Theres those planets and astrology!
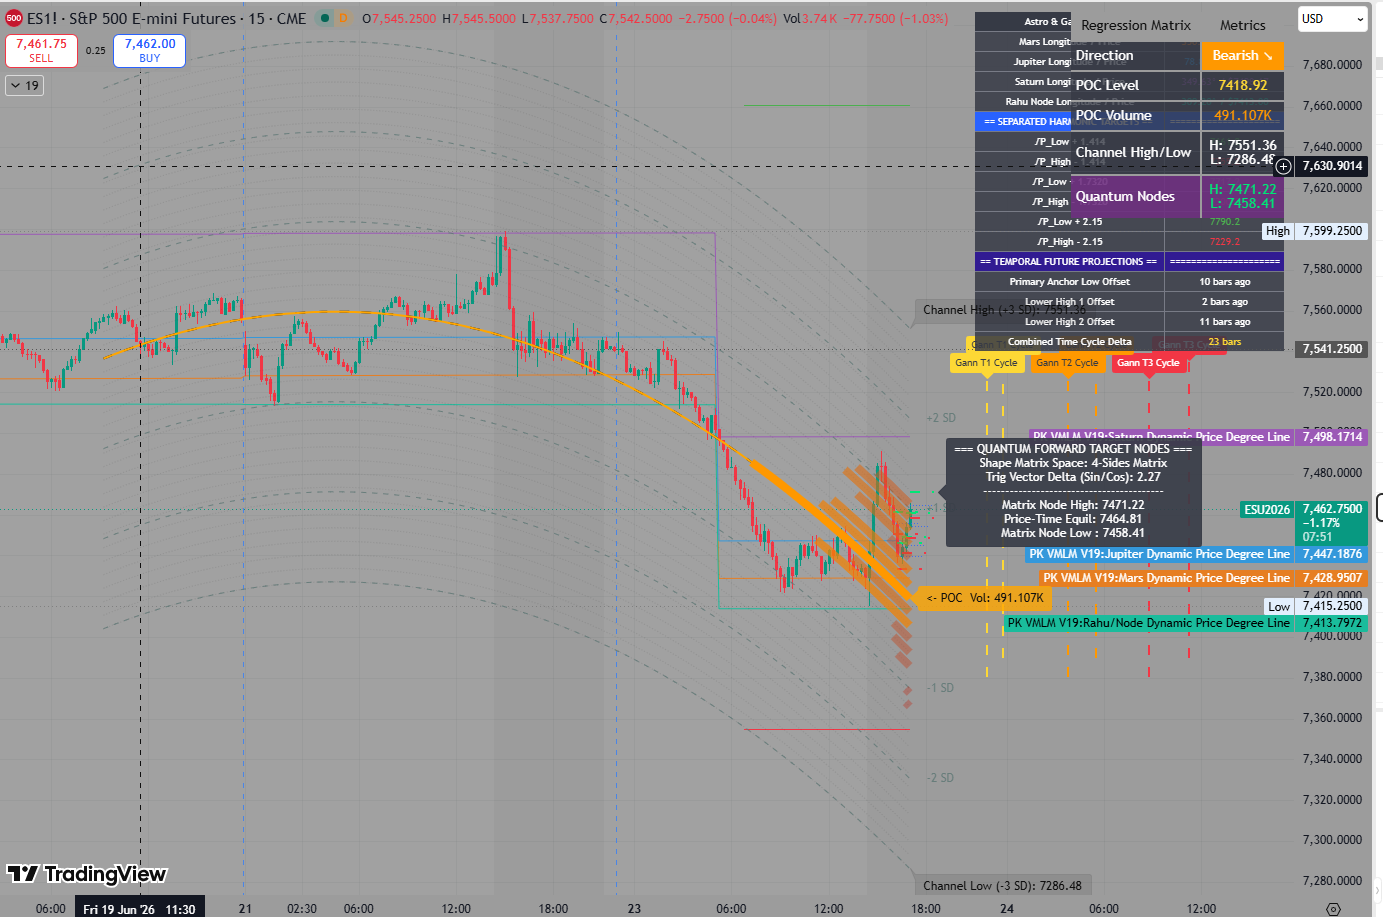
7388 held so far and now see how it react with line in sand here
Thanks very much, fayq!
NEO wave Volume High nodes and Low volume nodes and math just to -- feel the beat of the market 7492 where mkt resistance --in my opinion !!
Mt5 Stay humble!