June 2nd, 2026 by Roy W. Spencer, Ph. D.
The Version 6.1 global average lower tropospheric temperature (LT) anomaly for May, 2026 was +0.53 deg. C departure from the 1991-2020 mean, which is up from the April, 2026 value of +0.39 deg. C..
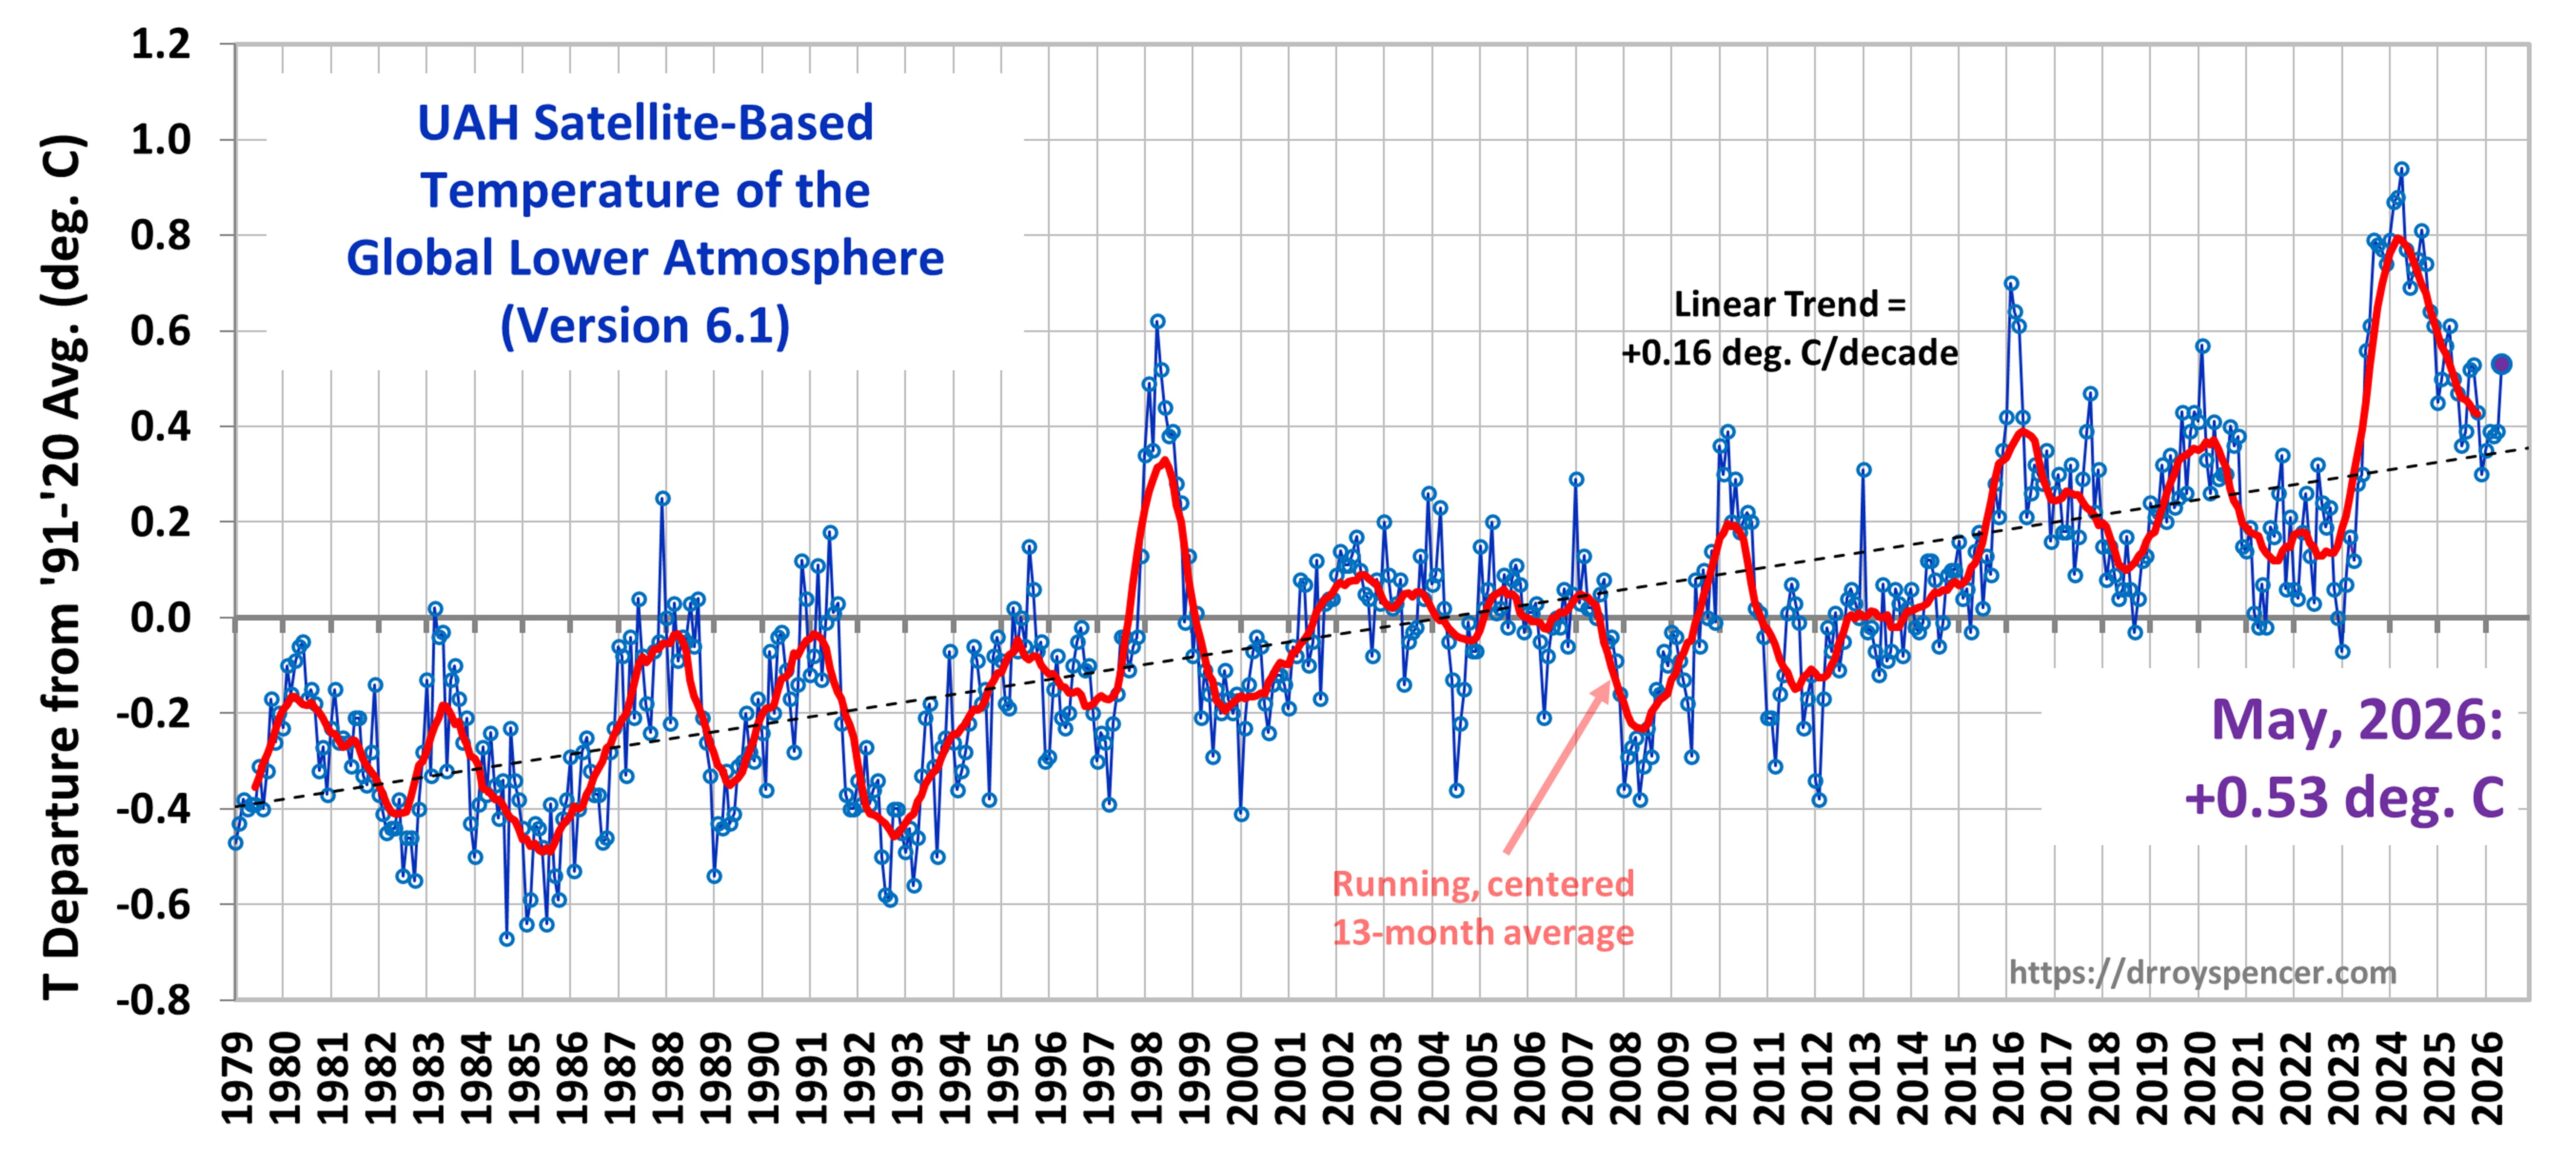
The Version 6.1 global area-averaged linear temperature trend (January 1979 through May 2026) remains at +0.16 deg/ C/decade (+0.22 C/decade over land, +0.13 C/decade over oceans).
+++++++++
The atmosphere has warmed close to 2 deg. F in the past 100 years which allows it to hold around 7% more moisture. This has mostly been caused by the physics of greenhouse gas warming from human caused CO2 emissions from burning fossil fuels.
Even though much of that has been beneficial warming in the highest latitudes during the Winter months(the driest places have more room in their radiation absorption bands that have overlap between H20 and CO2), there has been a HUGE increase in very heavy downpours/rains from the Plains eastward, especially during the warmer months that have unquestionably been more humid(even though the Cornbelt has seen a REDUCTION in extreme temps during our Summers)
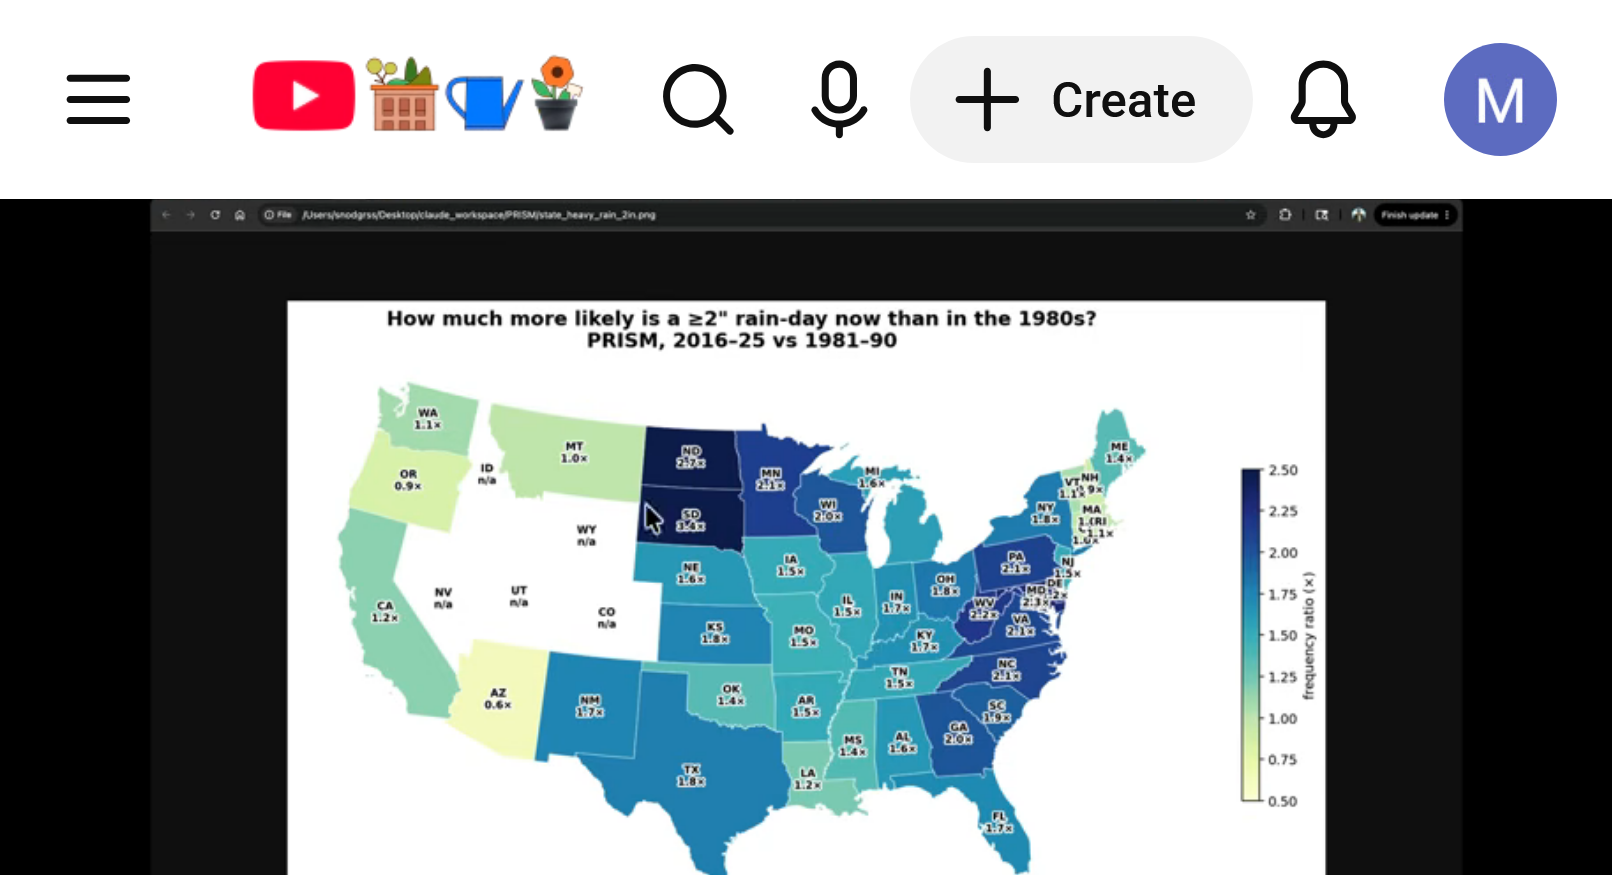
The statement/post on the previous page can be true, while at the same time, this is true below.
What I am seeing more than anything on this topic is people, especially scientists taking 1 side or the other.
Side 1, which is the majority only sees and tells bad things about human caused global warming/climate change. Exaggerating the bad things. Using the most extreme predictions. Completely ignoring the good things which outweigh the negatives by an order of magnitude because of CO2's role in photosynthesis.
Side 2 does the complete opposite. Only telling us about the good things and downplaying the bad things. Many NON scientists being true deniers that refuse to acknowledge the indisputable physics of greenhouse gas warming from increasing CO2 and insanely, don't see emissions from burning fossil fuels causing the increasing CO2. Instead, blaming natural warming from the Little Ice age or previous Ice Age as the main cause. Or blaming the Grand Maximum in the sunspot/solar cycle(which might actually be having SOME impact).
Re: Re: Re: Re: Re: Death by GREENING!
By metmike - Feb. 2, 2025, 7:54 a.m.
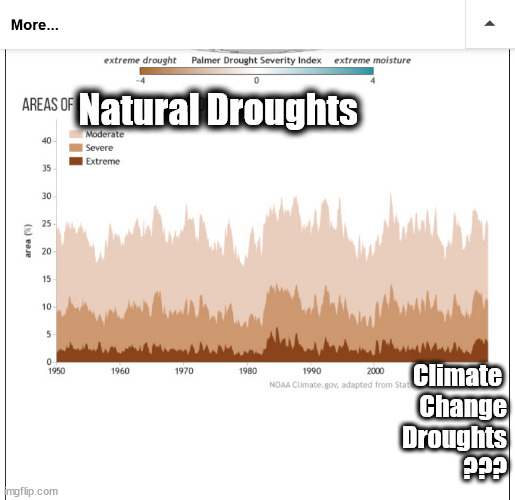
Here's a perfect example of why they get it so wrong using the global drought graph from above. Please tell me where on this graph below, that the climate change droughts are and where the natural droughts are since the year 2000? Impossible because the pattern is THE EXACT SAME! The MSM, in 2025 tells us that EVERY drought is now caused by climate change to the point that they use the terms interchangeably.
https://www.climate.gov/news-features/featured-images/2017-state-climate-global-drought
+++++++++++++++++++++++
Global cooling and LOW CO2 levels are what cause widespread, extremely long lasting droughts with catastrophic global and huge regional famines!
Here in 2025, we are living in a climate optimum with absolute, scientific certainty!!
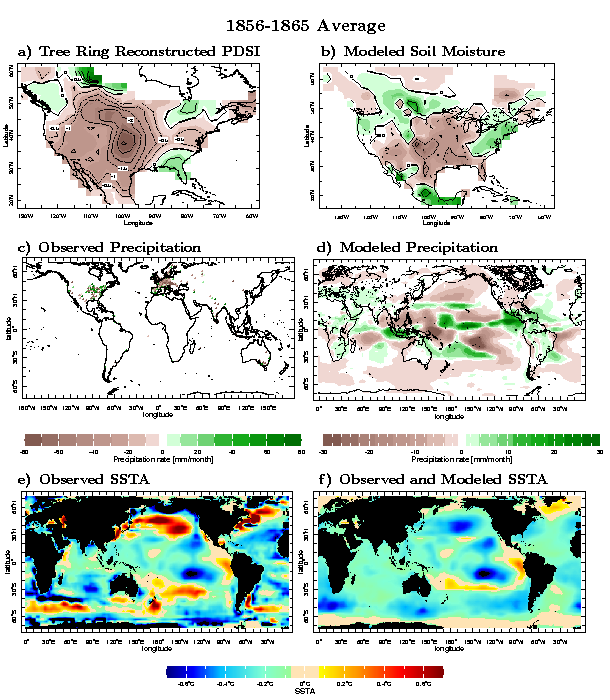
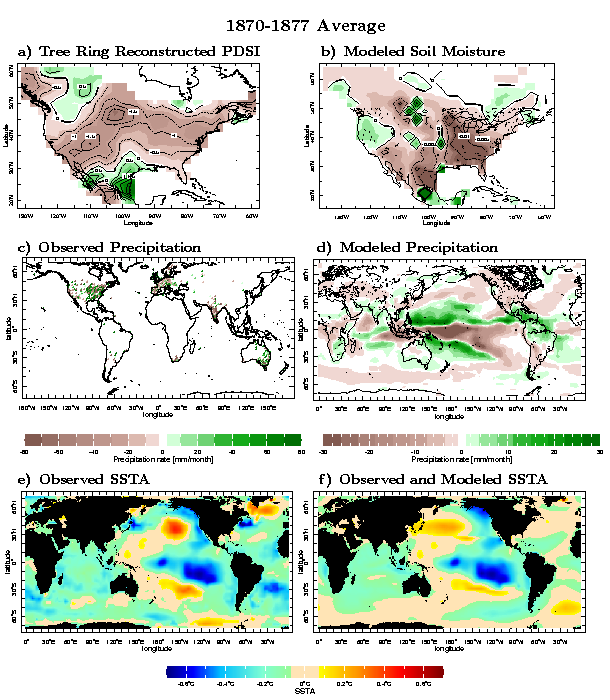
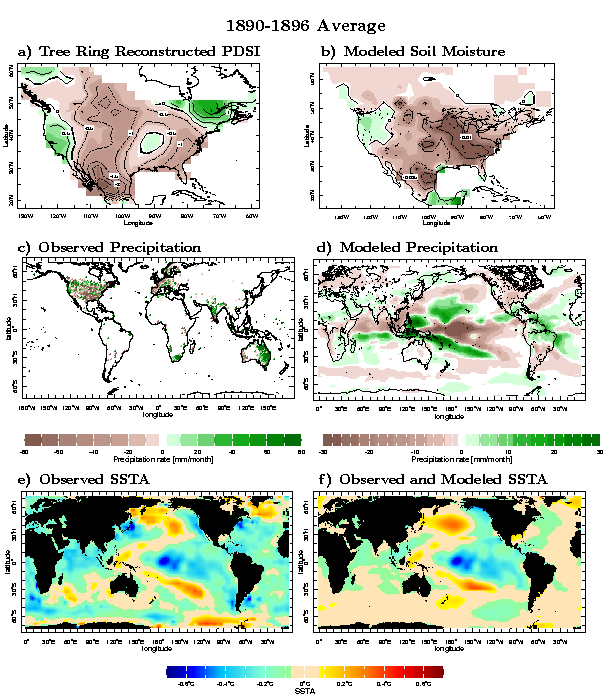
Causes and consequences of nineteenth century droughts in North America
https://ocp.ldeo.columbia.edu/res/div/ocp/drought/nineteenth.shtml
++++++++++++++++++++++++++++++++++++++++++++
You want a REAL climate CRISIS?
This is what it looks like:
Can you imagine if this below happened today? It's less likely because climate change and the current climate OPTIMUM is helping to PROTECT US!
The planet had a REAL climate crisis between 1876 and 1878.
50 million people died. 3% of the global population died from that real climate crisis!
https://news.climate.columbia.edu/2017/12/15/causes-great-famine-drought/

The Great Famine killed an estimated 12 to 29 million people in India. Image
https://ui.adsabs.harvard.edu/abs/2017AGUFMGC51F..04S/abstract
The 1876-1878 Great Famine impacted multiple regions across the globe including parts of Asia, Nordeste Brazil, and northern and southern Africa, with total human fatalities exceeding 50 million people, arguably the worst environmental disaster to befall humanity.
NASA EXPLAINS THE DUST BOWL DROUGHT
https://www.nasa.gov/centers/goddard/news/topstory/2004/0319dustbowl.html
++++++++++++++++++
Climate change in the United States, with 100% certainty is helping to protect us from widespread severe droughts.
Summer Climate Change in the Midwest and Great Plains due to Agricultural Development during the Twentieth Century
https://journals.ametsoc.org/view/journals/clim/32/17/jcli-d-19-0096.1.xml

++++++++++++++++++++++++++++++++++++++++++++++++++++

We are indisputably living in a climate optimum for most life on this planet(that would still prefer a bit more warmth and a lot more CO2) and for growing crops in the United States!
Grand Solar Max and Mins:
https://www.aanda.org/articles/aa/pdf/2007/31/aa7704-07.pdf
By metmike - Feb. 2, 2025, 7:54 a.m.
Another huge contributor to the added moisture in the air during the growing season.
Re: Re: Re: Re: Re: Re: Weather Post of All TIme-WxFollower
By metmike - May 30, 2025, 8:51 a.m.
Re: Re: Re: Re: Re: Re: : Droughts not increasing
By metmike - Oct. 6, 2023, 12:26 a.m.
An Unexplored Source of Climate Change: Land Evapotranspiration Changes Over Time.
By Charles Blaisdell PhD ChE++++++++++++
Global Green Up Slows Warming
https://earthobservatory.nasa.gov/images/146296/global-green-up-slows-warming
In the last 60 years, the United States Corn Belt has doubled the number of tightly packed rows of corn and tripled the corn yields. The result has been like a science experiment in agronomy during the Summer/growing season, This 10 state area has seen regional increases in dew points of 5+ Deg. F on many occasions entirely from the added evapotranspiration of the corn.
This has created a micro climate for around 4 months of the year in this area.
The same impact is happening in other agricultural areas. Also, most places with natural vegetation that’s been greatly greening up with the greater foliage transpiring more.
Summer Climate Change in the Midwest and Great Plains due to Agricultural Development during the Twentieth Century
https://journals.ametsoc.org/view/journals/clim/32/17/jcli-d-19-0096.1.xml
Americans Have Planted So Much Corn That It’s Changing the Weather
https://www.atlasobscura.com/articles/corn-belt-weather
The Corn Belt is making it rain.++++++++++
WEATHER LAB | What is corn sweat?
https://www.weareiowa.com/article/weather/weather-lab/science-of-weather-corn-sweat-evapotranspiration-water-vapor/524-de12a91b-35cd-4b48-9b21-c0ec6e11f794
An acre of corn can add up to 4,000 gallons of water vapor to the atmosphere per day!
‘Corn sweat’ in the Midwest can cause some of the most oppressive humidity in the US
Can you imagine stepping outside to a 90-degree dew point?
https://www.foxweather.com/learn/corn-sweat-midwest-most-oppressive-humidity-united-states
Climate Change Impacts in the Corn Belt
Why is the humidity so high? The answer is pretty corny.
https://addins.wrex.com/blogs/weather/2011/07/why-is-the-humidity-so-high-the-answer-is-pretty-corny
The United States’s Corn Belt is making its own weather Plentiful crops are changing rainfall and temperature trends
https://www.science.org/content/article/america-s-corn-belt-making-its-own-weather
++++++++++++
This impact will continue for the next century at least as a result of increasing beneficial CO2, as we extend the current scientific/biological climate OPTIMUM for most life on this greening planet.
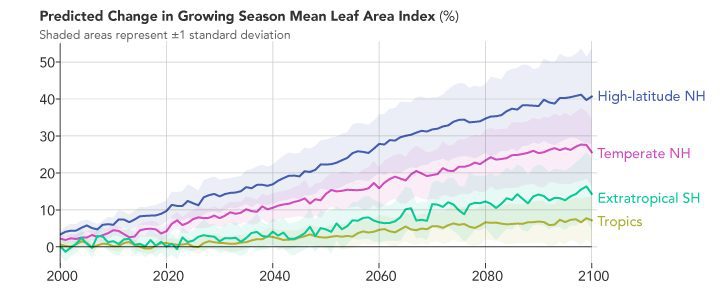
Here’s that article again to go with the attached graph that shows the expected leaf area increasing at every latitude across the planet thru the year 2100!
Global Green Up Slows Warming
https://earthobservatory.nasa.gov/images/146296/global-green-up-slows-warming