
7-28-26 update: This huge rain event has been moved up to late this Thursday, 7-30-28 to around 60 hours later, early Sunday.
++++++++++++
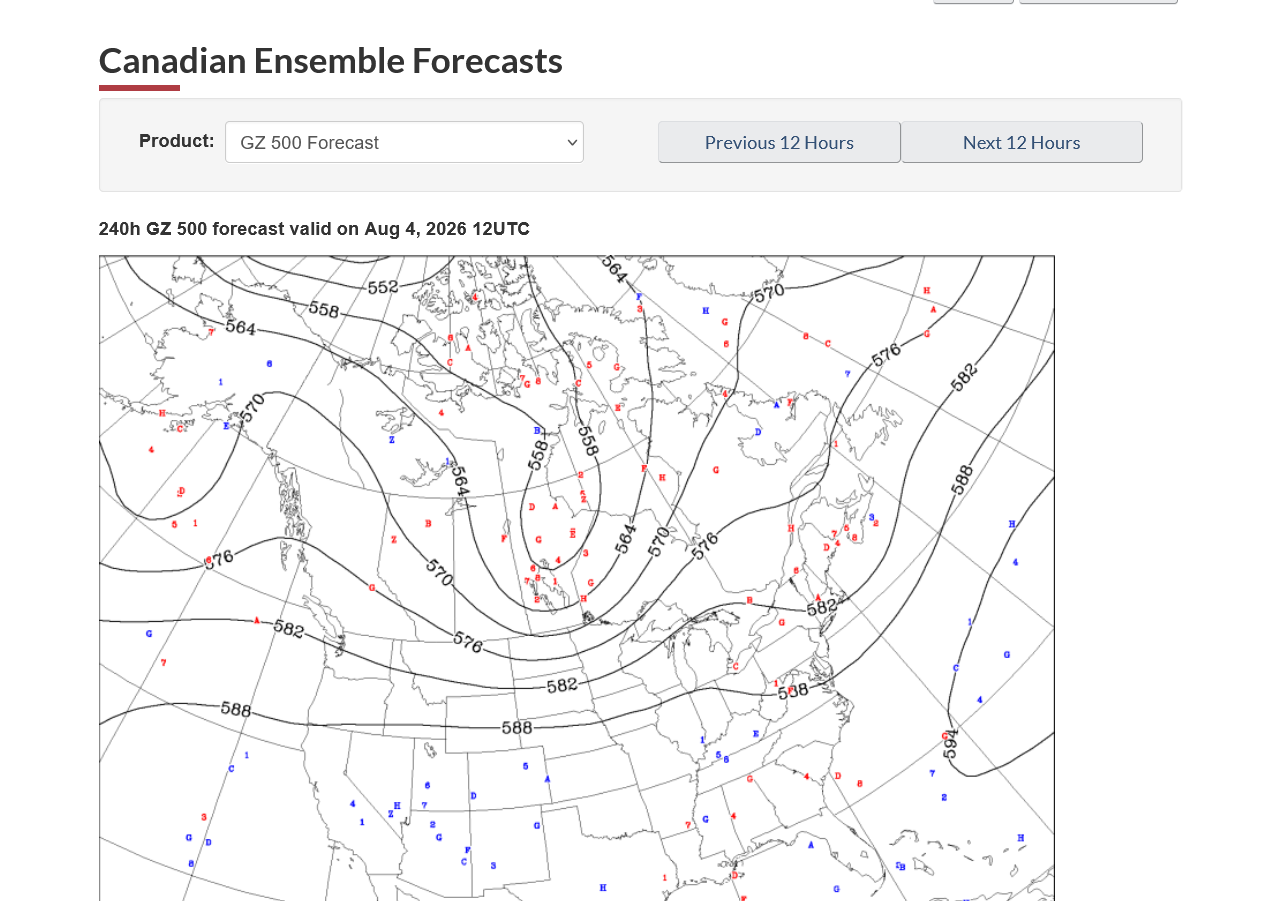
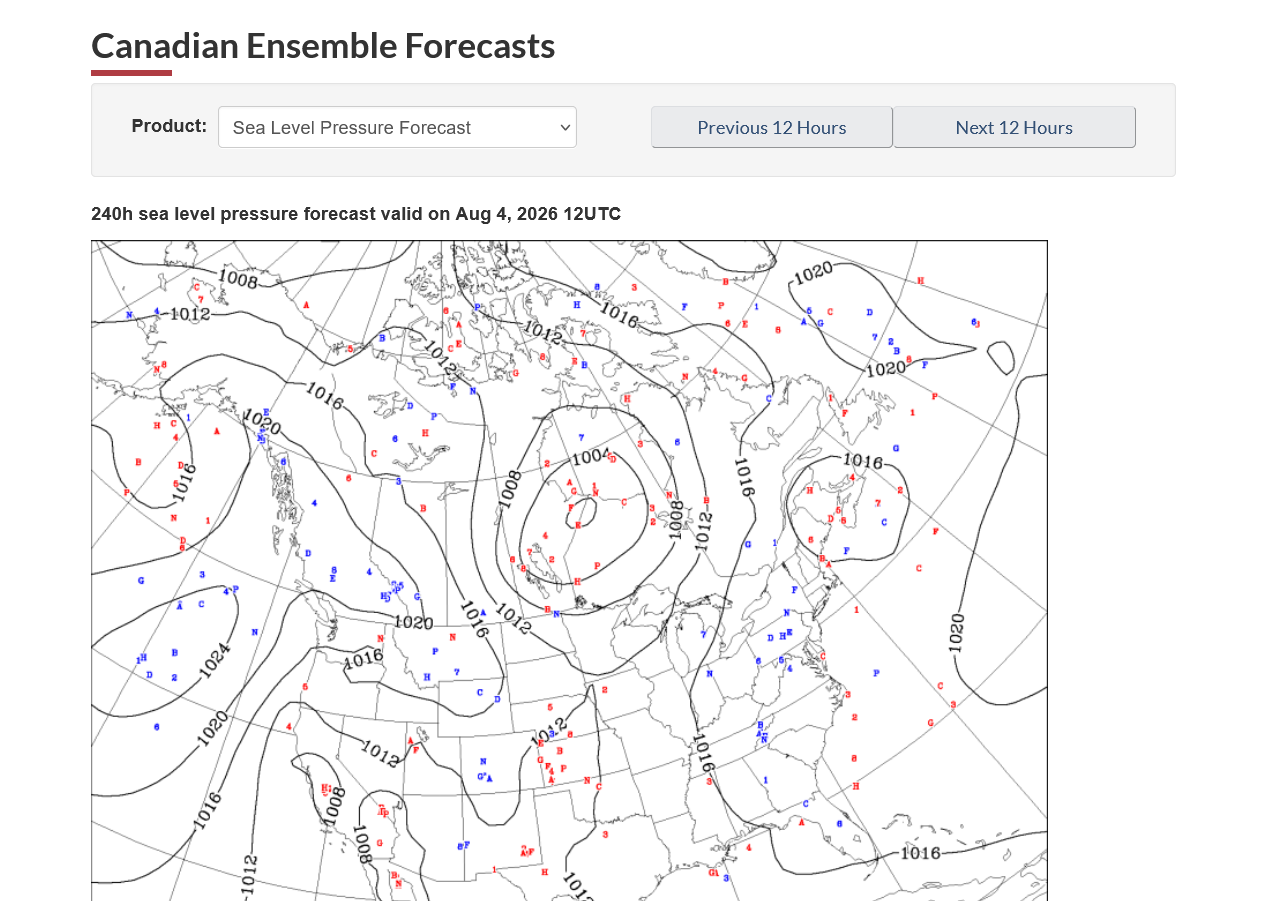
The potential change in week 2 mentioned yesterday/Friday continues to take shape. It would lead to the chance of a widespread rain event returning to the Cornbelt as seen below from the last 12z run of the Canadian Ensemble day 10 weather maps!
The intense shot of heat in the Midsection that is starting today will be another brief event.
Get all the comprehensive weather here:
https://www.marketforum.com/forum/topic/83844/
Current Hazards at the link below.
For your NWS and county, go to the link below.
Then you can hit any spot on the map, including where you live and it will go to that NWS with all the comprehensive local weather information for that/your county.
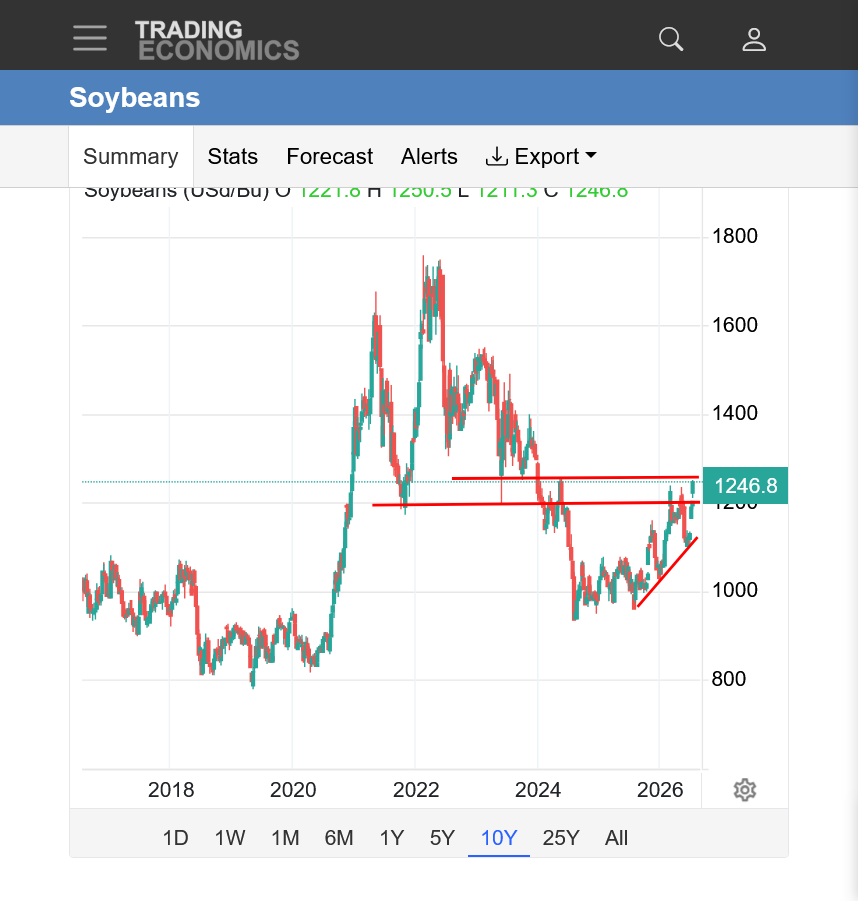
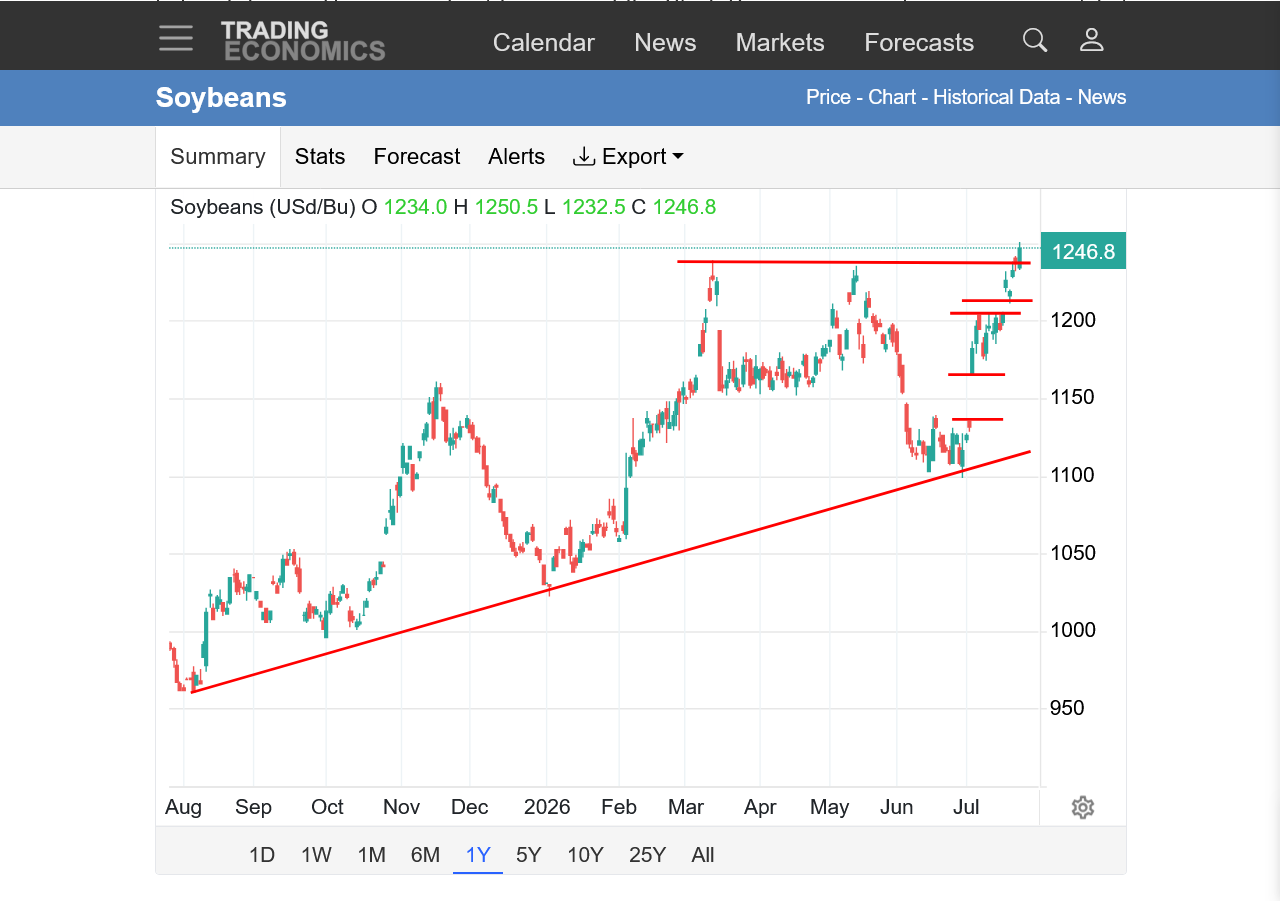
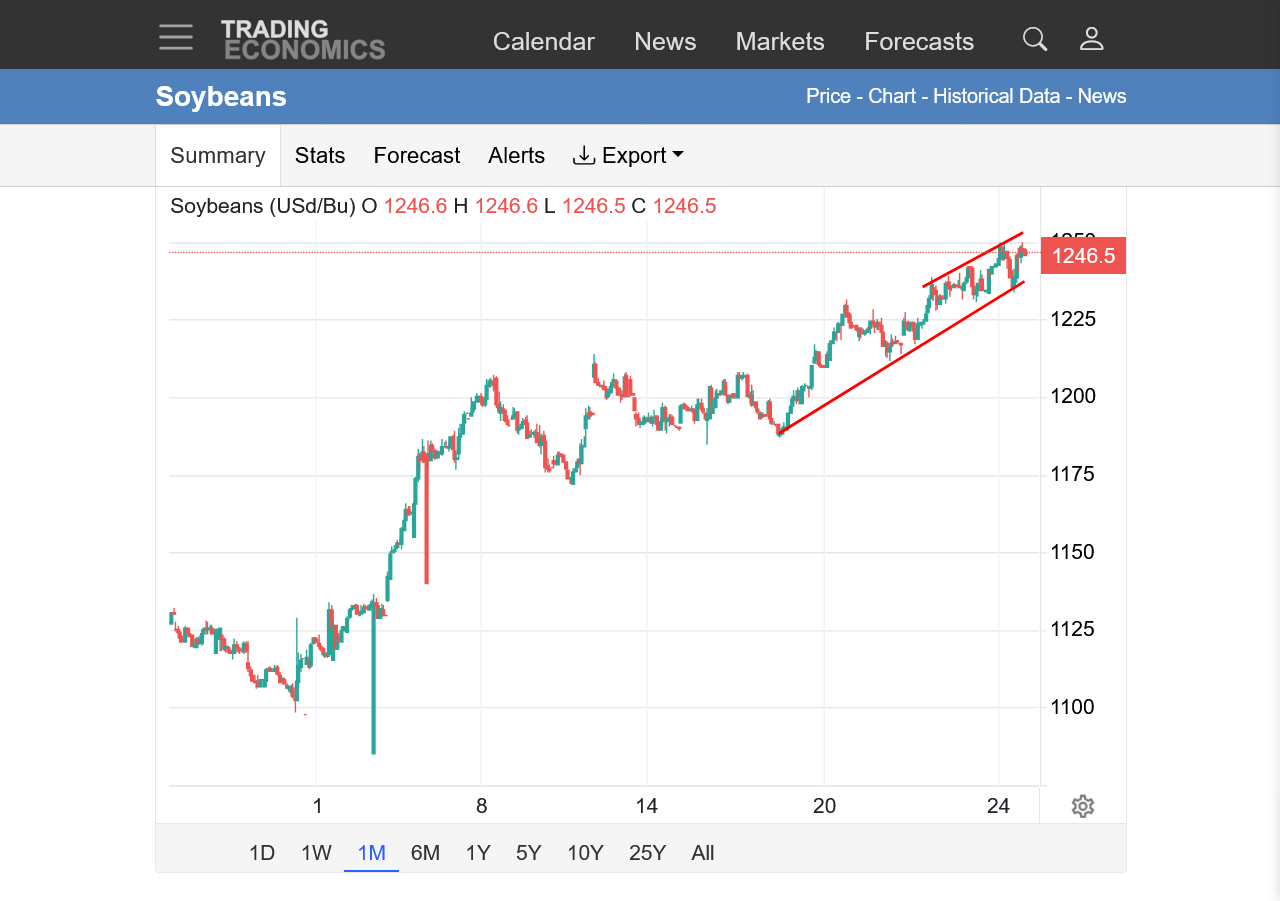
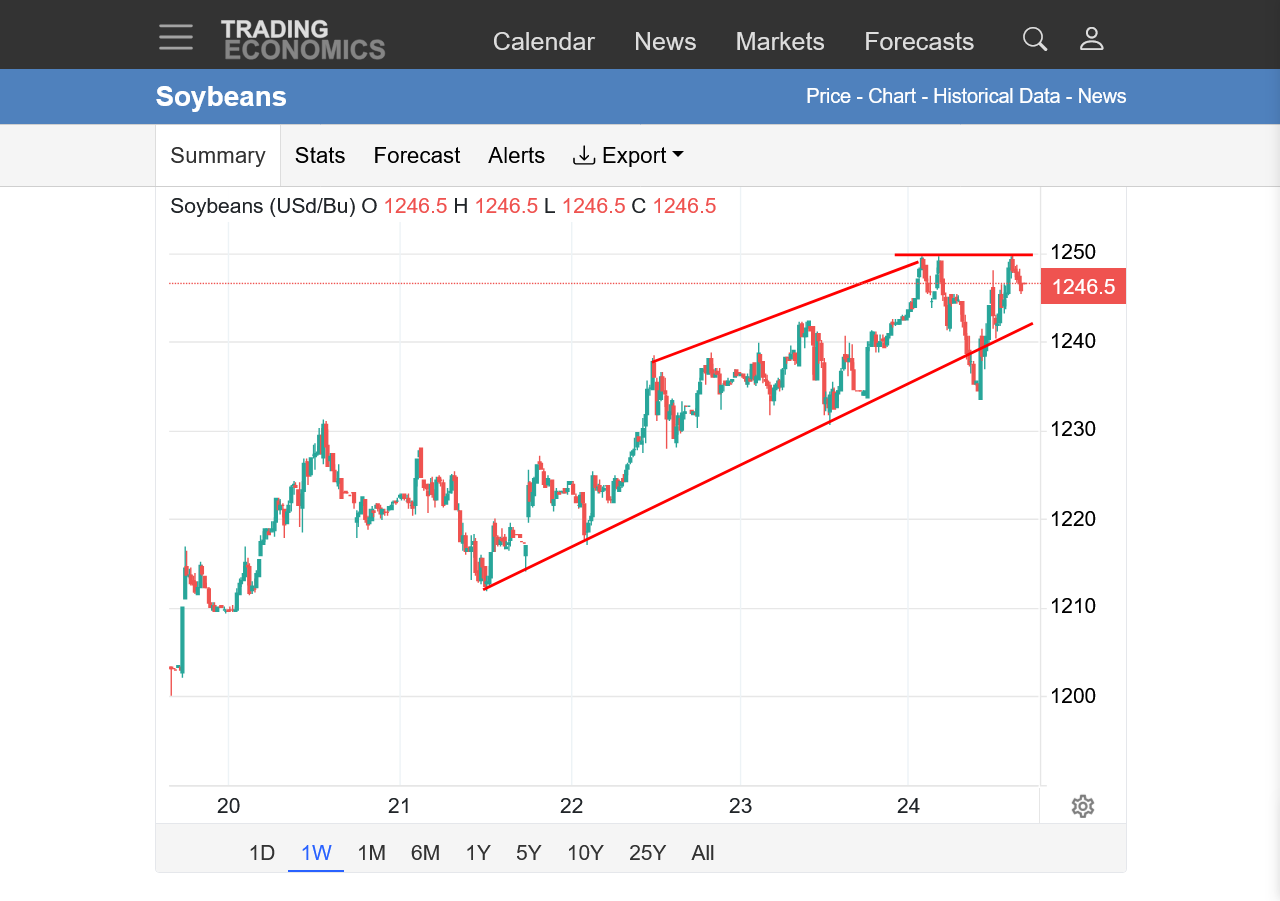
https://tradingeconomics.com/commodity/soybeans
1. 10 years: Long term/major bottom in late Summer 2024(from flash drought). New uptrend late 2025/2026. Gap higher above resistance. Still at some long term potential resistance.
2. 1 year: SOLID uptrend! New highs this week ABOVE the double top earlier this year. The first gap up is NOT really a gap but was just a long bar up. The next gap is the upside break away gap that remains open.
3. 1 month: Steep uptrend!!! Up over $1.30! Weather forecasts turned bullish
4. 1 week: Steep uptrend losing steam/momentum on Friday potential bearish(less bullish) change to the weather forecast.
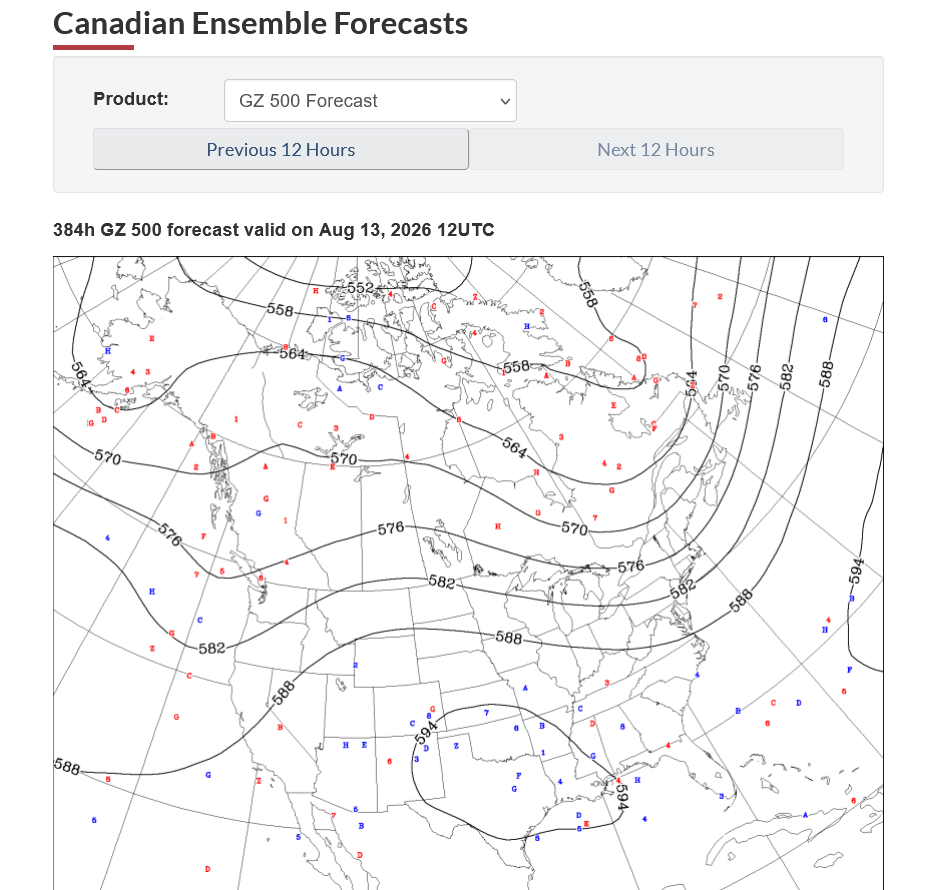
Here's the Canadian Ensemble model again. This time on day 10 and the last 12z model. Go to the link to see each member in the average. The average below reflects the majority that indicate a powerful upper level system crashing into the N. Plains/Upper Midwest with a strong cold front at the surface triggering storms. Probably some severe weather associated with the system too.
That's IF this solution pans out. The Canadian model is the most bullish with the strength below.
https://weather.gc.ca/ensemble/charts_e.html?Hour=384&Day=0&RunTime=12&Type=gz
https://weather.gc.ca/ensemble/charts_e.html?Hour=240&Day=0&RunTime=12&Type=pnm
++++++++++++
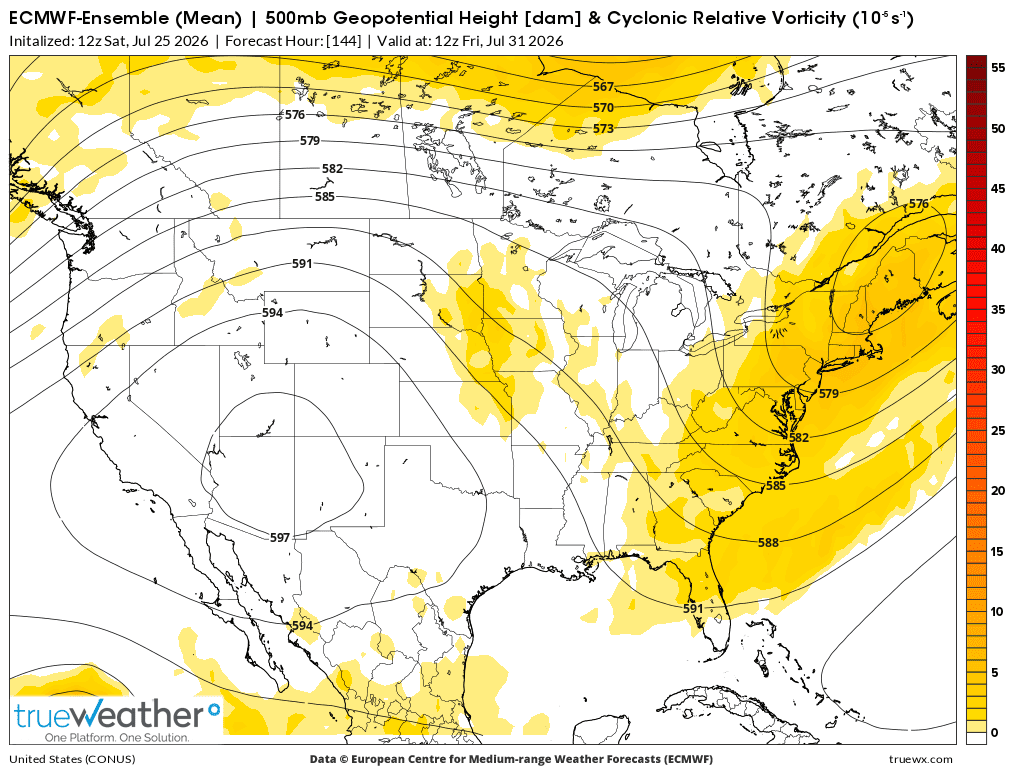
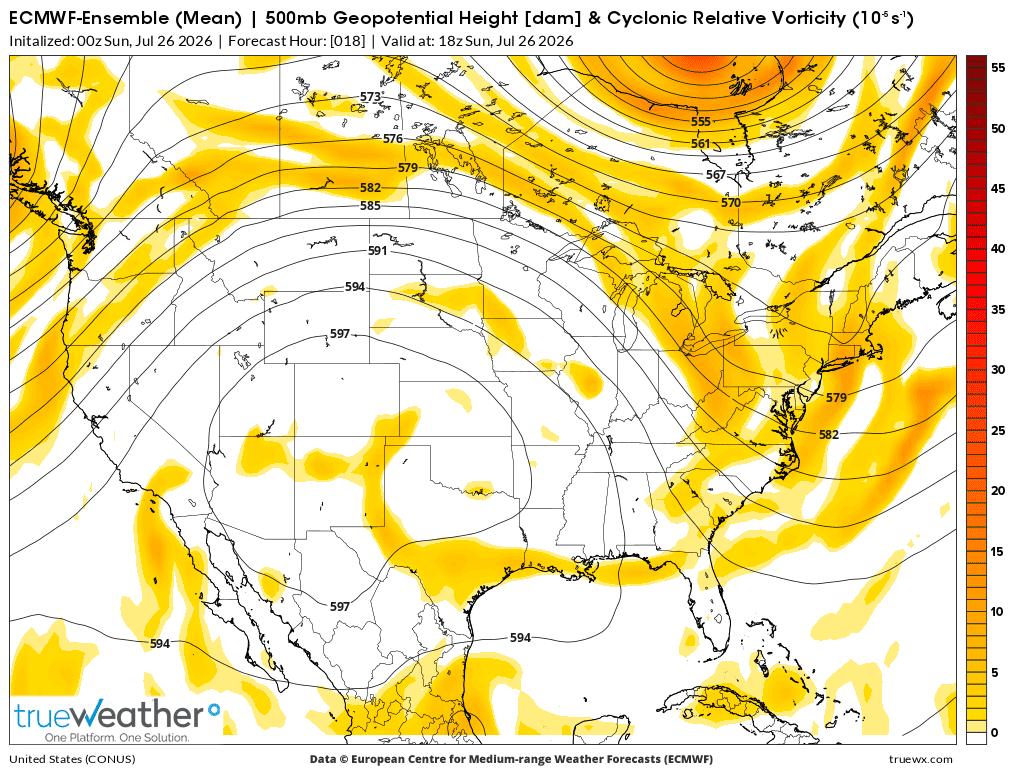
In addition, the European model below has an upper level perturbation coming over the top/periphery of the heat ridge that will rapidly retreat from the Midwest mid- week.
This could trigger a big cluster of t-storms tracking southeast in the northwest flow. COULD! Yellow areas below represent vorticity/spin in the atmosphere. As vorticity increases within these streamlines(of constant heights) that define the flow at 500 mb(19,000 feet) it lifts the air, leading to rains if other conditions are favorable(low level jet stream and moisture pooling/convergence for instance).
Rains with a set up like this can be very productive over several states 1 time, then the next time with the same set up nothing happens.
Scroll down from this link to see the forecast for individual days rains as well as risk for severe weather and excessive rain.
Rain in this week 1 forecast on Sunday afternoon is clearly up from Friday’s forecast.
https://www.marketforum.com/forum/topic/83844/#83848
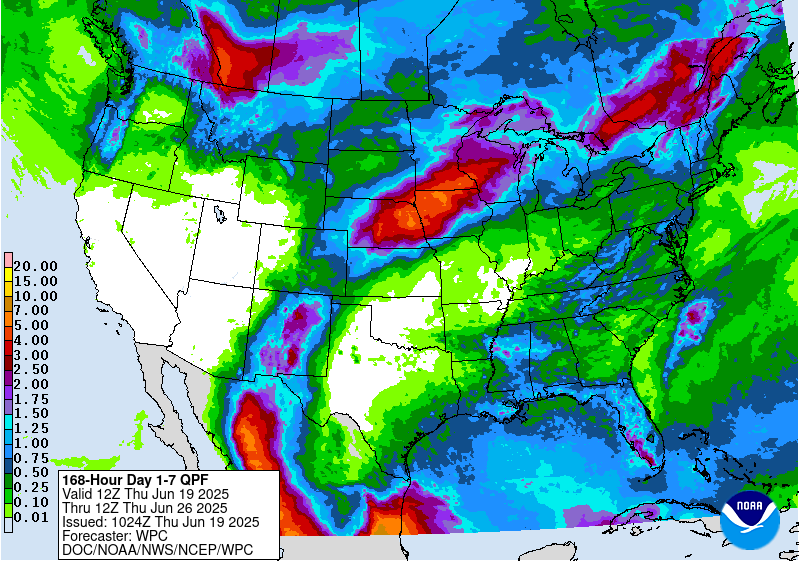
7 Day Total precipitation below:
http://www.wpc.ncep.noaa.govcdx /qpf/p168i.gif?1530796126
+++++++++++++++
Below is the 500 mb map with vorticity from the last 0z European Ensemble model for Sunday afternoon.
I'm hoping a lobe of vorticity, coming around the periphery of the heat ridge and tracking in the nw to se flow late this afternoon/evening will trigger clusters of thunderstorms that get to Evansville, IN even though the strongest activity will likely be farther north, where other dynamics are more favorable.
++++++++++++++++++++++++++++
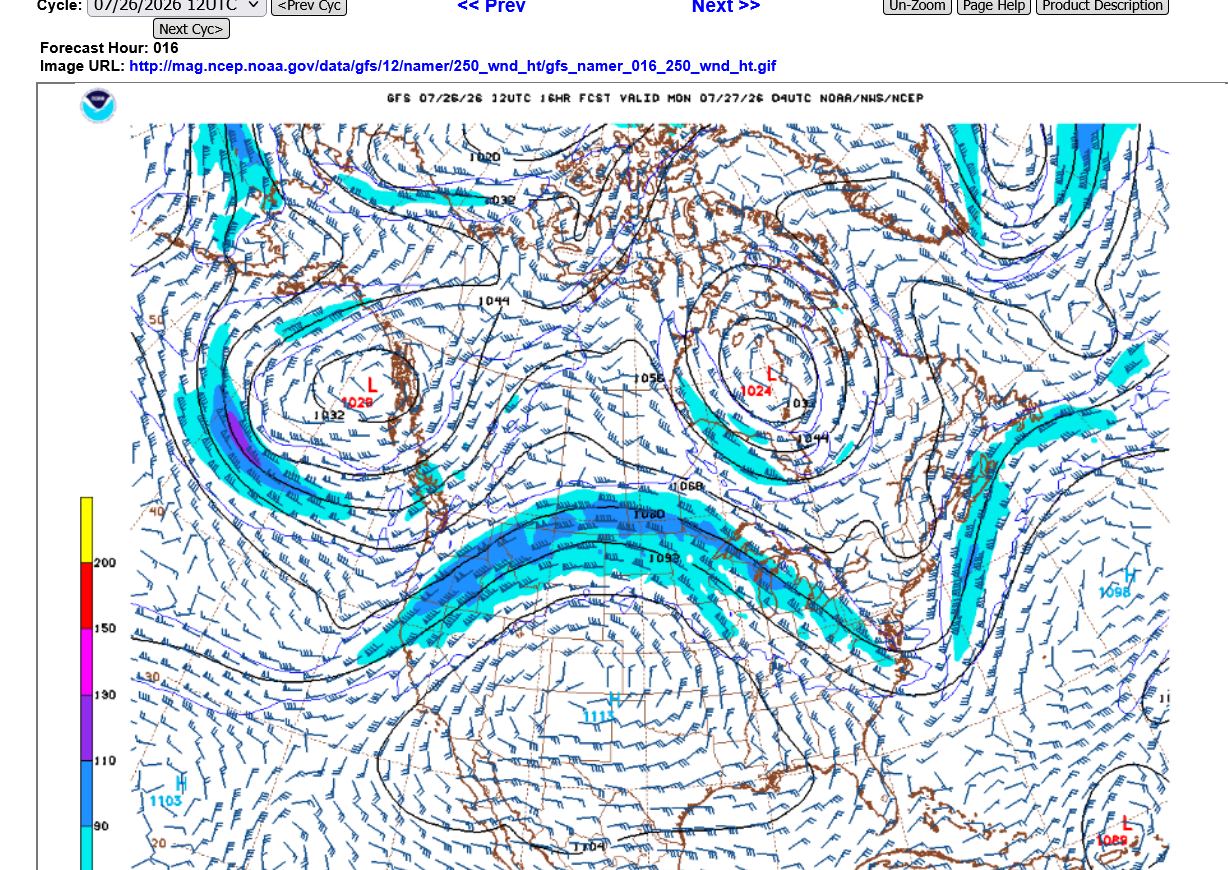
Below is the 250 mb level/steering currents up at 36,000 feet in the heat of Summer(warmer air expands the atmosphere upwards by x thousands of feet because it's less dense).
Note the wind barbs. They have a strong north to south component to the east of the heat ridge. So we should expect the storms that develop to track southeast, even curving more southward if they make it this far south because of our location with respect to the circulation around the heat ridge.
Wind barbs in the state of MO, for instance are almost all due south!
That was a pretty crazy open!
SX opened down modestly at 1246, spiked quickly down to 1239, then spiked just as quickly to 1250(recovering most of the losses and +11c from the spike low) then has been under constant selling pressure, gradually dropping to the current 1242.5, down 11c from the close on Friday but still above the lows on Friday.
Friday had a fairly wide range with a high of 1256.5 and low of 1238 and we almost covered that entire range in the first minute of trading tonight....... down, then up.
I suspect that the weather changes mentioned here each of the past 3 days suggest the short term highs are in.
But the weather can change quickly and usually BEFORE the charts in a weather market.
For instance, the weather was changing on Friday and now we're getting the response.
However, this may not be a huge, widespread pattern change to bearish weather that makes the new direction clear.
It's more of a LESS bullish pattern rather than bearish. And beans have been a strong, sustained bull this entire year, never violating their uptrend and still trading above the late Spring double top.
++++++++++
Almost 15,000 contracts traded aready in just the SX in the first 40 minutes.
This is the continuous front month graphed below.
It shows a potential triple top.
HOWEVER, the November 2026, which is the one to trade right now(new crop growing in the ground and responding most to the weather) is a whopping 40c higher than it's contract highs back in the Spring.
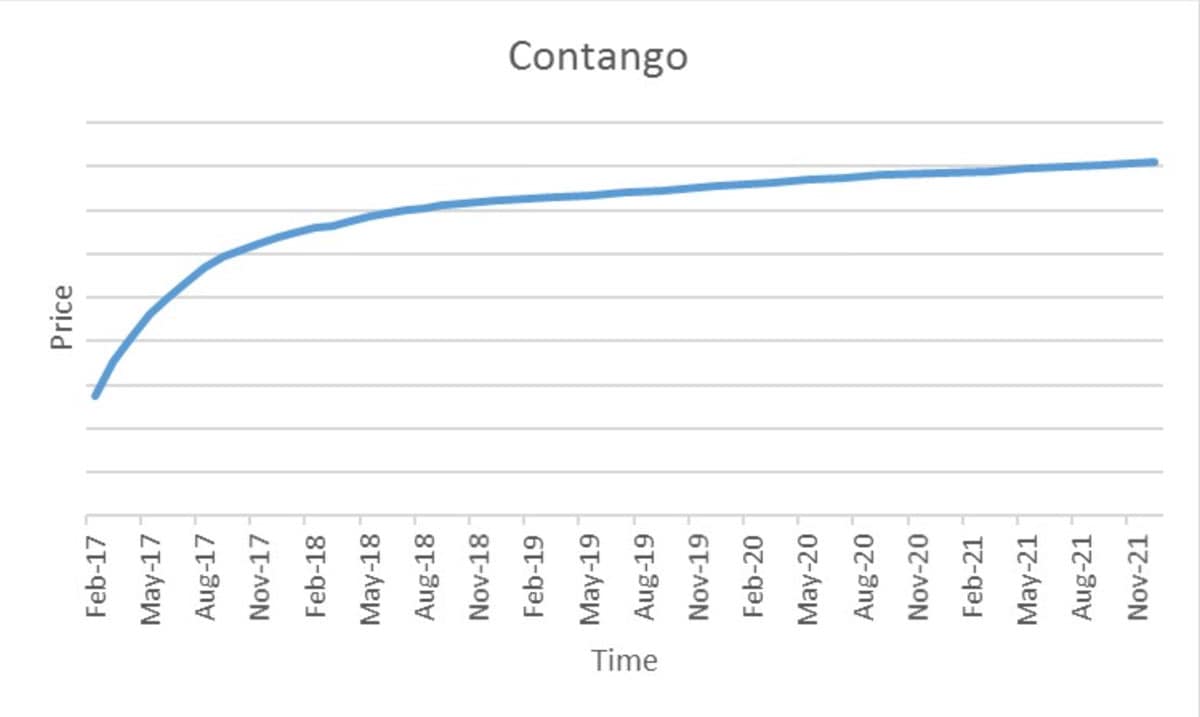
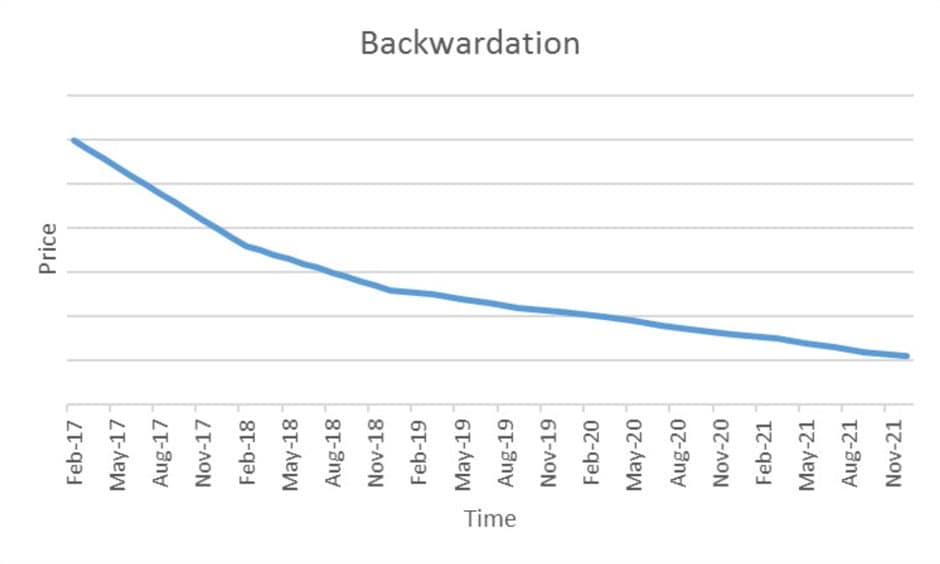
Soybeans, thru much of this year were trading in backwardation, with the front month priced HIGHER than the deferred months. This happens in strong bull markets where near term demand is so strong that buyers can't wait for better prices or later time periods because THEY NEED THE BEANS NOW!
The front month has still had lots of demand and kept prices from dropping at a time of year, when seasonally they fall but the new crop price has been SOARING higher as the market anticipates higher prices down the road, especially with the weather forecast turning hot/dry thru August.
This has wiped out the backwardation with November beans trading well above August and September beans.
Again, the SX is trading at 1240 which is now HIGHER than the front month, August at 1235.
However, the September beans(old crop) are at 1227 BELOW the August which is still backwardation.
A bit unusual.
https://tradingeconomics.com/commodity/soybeans
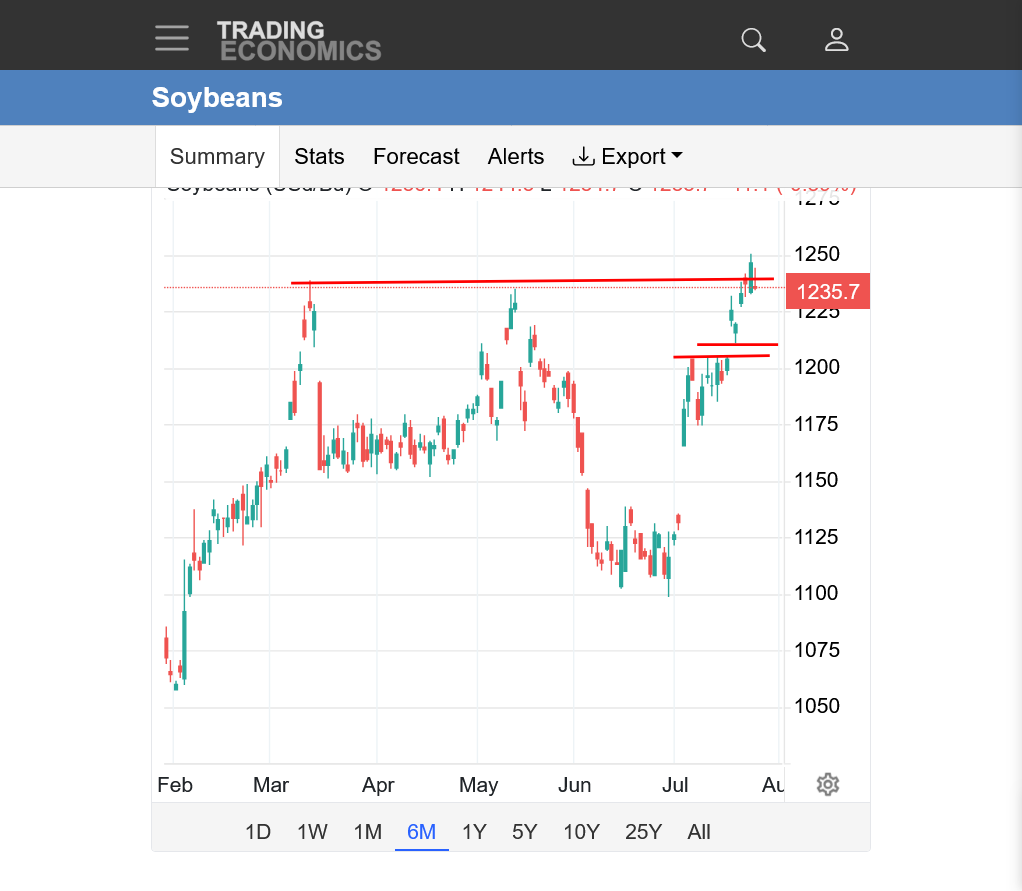
The August soybeans below show a potential triple top here.
Note the gap higher from a week ago. Unfilled and an upside break away gap because of the hot/dry weather forecast that actually started in early July.
If the weather continues to turn more bearish and filled that gap, it would potentially be a buying exhaustion gap and crap.
There is still a long way to go in the growing season and August weather is the most important for beans(pod fill).
Grains--post breakout of July 6
By metmike - July 13, 2026, 1:35 p.m.
Wonderful comments, cutworm!
The soybean market is currently in a SLIGHT backwardation condition!
The front month August is leading the bull charge and is priced slightly HIGHER than the back/deferred months, including November. That does not happen that often and it's a solid bullish indicator on demand/supply of the OLD crop.
I Overview

++++++++++
+++++++++++++
This is why the soybean market, including new crop is near the highs of the year and corn is 50c lower than the highs made in May.
That much more BULLISH technical/chart formation for beans does not necessarily make soybeans a better short here on the same weather. A person using charts and technical patterns should know this already.
+++++++++++++
This is not a prediction of where the price is going, just a key point about the current fundamental that caused the current bullish technical upward trend on the soybean charts, while the corn gave up the bull 2 months ago and has had a bearish chart formation during the exact same time frame.
Beans have continued to drift lower and lower. SX now on the lows of the session at 1236, -17c!
2am, make that 22c lower!
Beans are down 31c now!
9:17 am: SX are down 40c now!
In case it wasn't obvious, rains were INCREASED in the forecast again overnight!
In the month graphed below, beans are just filling the upside breakaway gap that started last week.
However, the November beans have had a low of 1211 so far and the bottom of the SX gap is 1207(from last week), so not quite filled.
The late Spring high in SX was 1214. We are at 1212, so below that.
If SX is going to hold, this is the area but it looks bad.
https://tradingeconomics.com/commodity/soybeans
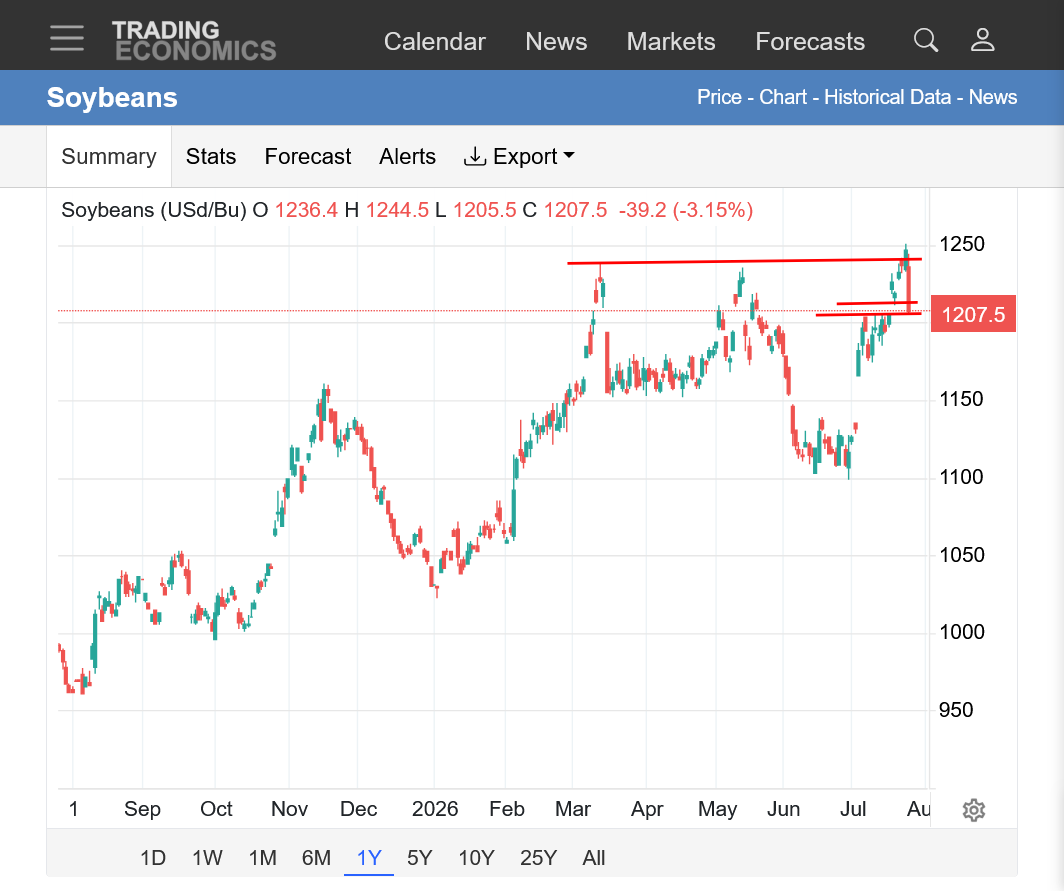
From the source above(and example of why you shouldn't use information from sources that are paid to say something to explain moves but don't actually trade)
Read this thread and the previous one if you want the REAL reason...........WEATHER in a WEATHER market!
Significant selloff in grains, but...
38% retrace in: SX 1207 CZ 466 SMZ 323 BOZ 7025 OZ 333
50% 1191 458 318 6920 All more/less calculations
PREFER these retracements come Tuesday trading day.
Chi wheat 'had' its 38% Friday. So far, inside day.
Looking to get long, with stop, then MetMike say the forecast has changed back to hot/dry or just dry.
Two cents.
Thanks, tjc!
We've filled the front month gap up on the beans with the SX barely holding on.
Gaps that are filled quickly(within a day or 2) are more powerful signs of an exhaustion in the direction of the gap.
This gap is a week old but is still very significant. It could be an area of support, especially for the stronger new crop, SX but only if we take rain out of the forecast.
We've been adding rain the past 4 days so that trend suggests we will add more but it's the weather that can change back and forth.
A principle that I teach in chess is:
The most important move in the game is always what your opponent did last!
That's what usually tells you the most about their latest thinking in an evolving strategy.
Same thing in trading and weather.
1. What did all the weather models show last? It replaces what they showed before, so give the fresh information the most weighting, especially if the previous runs are what you wanted to believe.
2. How did the market react last to new information?
Corn ratings dropped 4%, with an increase of 3% in the P/VP.
Beans dropped 3% in the G/E with an increase of 1% in the P/VP.
Not sure what the market expected, since we had a HUGE rally that dialed in the weather that caused this drop in ratings but this means the size of the crop as of right now is SMALLER than it was earlier this month.
Again, most of that could be dialed in and the market will just focus on the latest weather forecasts.
https://release.nass.usda.gov/reports/prog3026.pdf
We already knew last years crop ratings(which dropped from dry weather in the later parts of the growing season in 2025) but the corn is rated 10% lower and the beans are rated 7% lower than last year during this same week.
Another item. Once a crop starts to deteriorate(it sorts of shuts down to protect itself) and the best you can hope for is rains to stop the deterioration.
Usually, in late July with rains seasonally NOT meeting moisture demands there is often a slight deterioration from this point forward and producers are hoping for enough rains to maintain potential.
However, crop ratings are NOT always great indicators of crop size!
Tons of rain with heat fill for corn will cause great looking, green plants as the kernels fill but small kernels at harvest from accelerated maturity that doesn't give the plant enough time to pump up the kernels with the nutrition/energy we grow corn for.
Another exception is with beans. You can kick the crap out of them with drought/heat and they almost go dormant, then huge rains come that trigger massive flowering in the beans and great fill weather.
It's gone the exact opposite way the past 2 Augusts. Decent crop potential for beans but then HORRIBLE pod filling weather in August/early Sept with flash drought in some places and small pods at harvest..........even with crop ratings holding up because the elevated CO2 is great for vegetative health and the way the plant looks from the road.
VERY well done on explanation of crop ratings. Might cause slight bounce.
WHAT IS THE WEATHER forecast? More or less rain than last evening/this morning?
Thanks, tjc!
No major changes in the weather. I'm pretty bearish for the ECB and even the CCB but the WCB is still bullish.
The farther west you go, the hotter it will be. The farther west you go, the drier it will be.
Lower temps and more rain the farther east you go to the point of ABOVE average rain and near average heat in the ECB.
+++++++++++++++
4am: This is especially the case for week 2 that I was looking at when making the response above.
I need to adjust that after the overnight 0z runs to align better with reality.
Last week, the 6-10 day and 8-14 day guidance was very dry for much of the Cornbelt. I had mentioned on Friday a change in that outlook(before the NWS picked up on it on Sunday). THIS week, that same period has now been moved up to the next 7 days.
Look at the overnight/updated initial 7 day forecast below and see how much WETTER it is than what was expected LAST week.
Even the WCB has decent rain chances. That shifts eastward early in week 2 for the ECB and the WCB dries out in week 2.
This is what crushed the beans to the tune of -40c on Monday and we added a tad more rain to the week 1 forecast overnight.
7 Day Total precipitation below:
http://www.wpc.ncep.noaa.govcdx /qpf/p168i.gif?1530796126
+++++++++++++++
Overnight, SX dropped to 1206 and completely filled the bullish upside break away gap from last Sunday Night/Monday's session(8 days ago).
We are also just below the previous life of contract high of 1209.5.
The easy money was made being short on this huge weather change on Sunday Night(selling as early Thursday Night/Friday for somebody that wanted to take a chance being too early with the noted bearish changes) as described since Friday.
With prices already dropping so much, I have no way to know if we have dropped the right amount to dial in all the new rain or whether we need to drop more or if we have overdone the drop and this previous gap area is the new support.
On occasion, I can call huge market turns on huge weather changes before the market reacts because the weather changes FIRST, the early weather birds put on their position, then they catch all the worms when the rest of the traders react.
Some people think the charts predicted it before the weather changed.
No, that's not what usually happens in a sensitive weather market. The charts were reacting to the early birds knowing the weather BEFORE THEY DID!
The smart money using the latest weather in a sensitive weather market (early birds) BEFORE the technical traders knew about it is what caused the reaction.
Technical traders can recognize this and follow for profits, if they respond quickly as long as the weather doesn't reverse to the opposite right after they put their position on.
The heat coming up thru August will take away yield from corn, even in areas with ample rain because of heat fill.
Here's our best thread for explaining and illustrating this principle:
HeatFill for Corn
Started by metmike - July 14, 2023, 2:47 p.m.
https://www.marketforum.com/forum/topic/97257/
++++++++
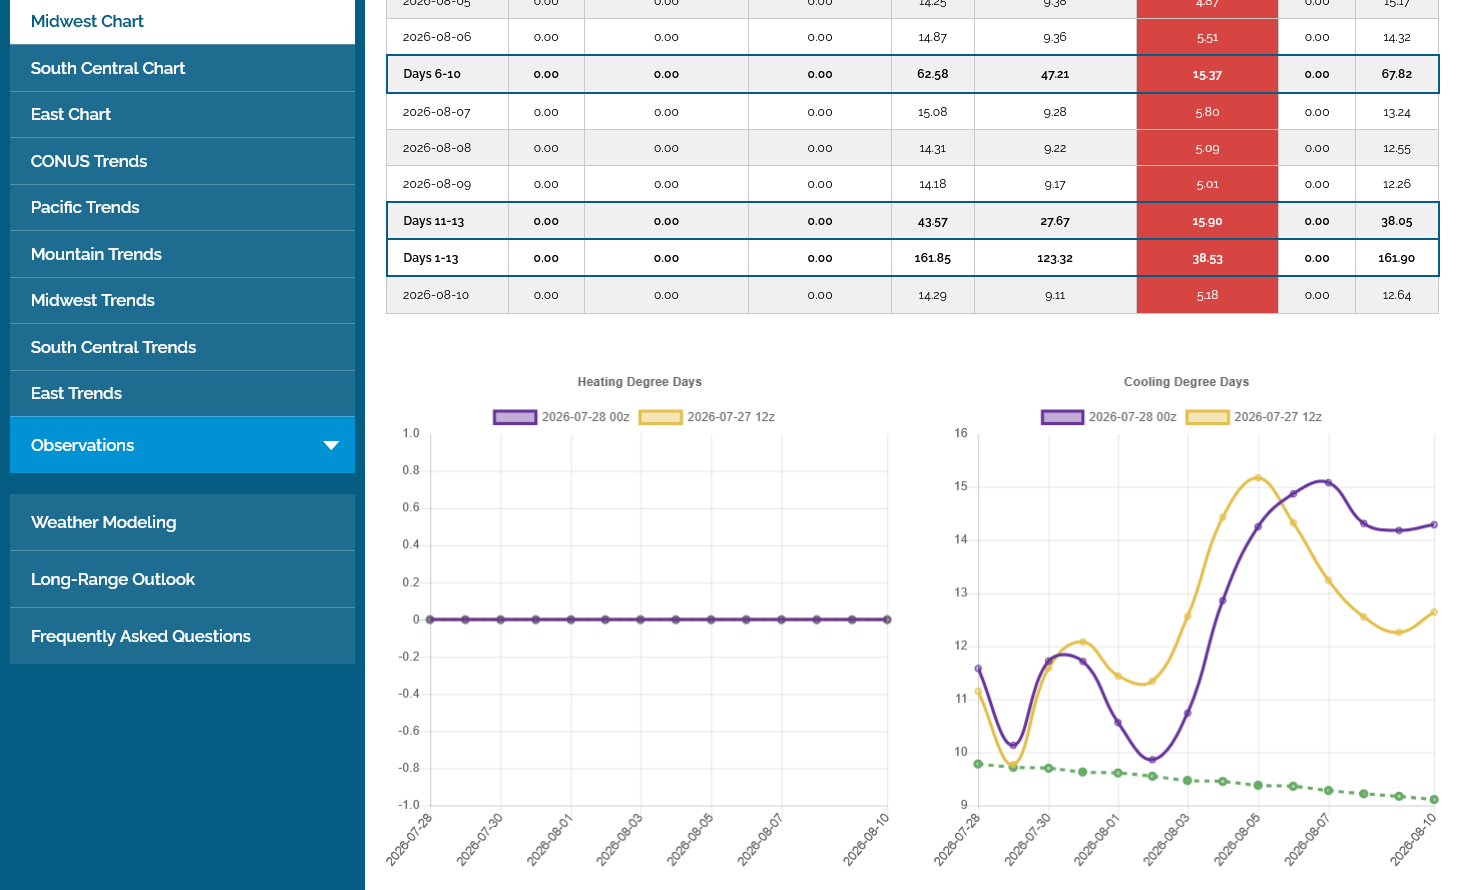
These are the CDDs for just the Midwest the next 2 weeks from the European Ensemble model, last run in purple on the right. Cooling to near average this week. Then the heat turns up again at the end of week 1, with rains possible shutting down in the WCB after that.
The models have recently been TOO HOT with their week 2 forecasts.
Retracements mentioned above have been achieved for sx, smz. Below for oz, boz. Cz only retraced 25%
Grains carving out a bottom?
Thanks, tjc.
The funds came in buying from the opening bell of the day session and haven't looked back. This happens all the time that they will do the opposite of the overnight market and even the opposite of what they did the previous day.
It's almost like they're on the same football team and go into a 45 minutes huddle before the open to decide what play to run at 8:30 am.
The rest of us try to jump on board and go with the flow. Sometimes they will barely break out of 1 side of the overnight range and it looks like that's going to be the direction..........then they reverse and break just outside of the other side of the range and reverse. All sorts of variations. Grain traders reading this know what I'm talking about.
Anyways, there was never a doubt what play they called during the 45 minute half time to open up the 2nd half of trading(day session).
BUY CORN AND BEANS!
This leaves the rest of us speculating what they were thinking.
For me, it just answers the questions earlier about the upcoming rains being dialed in or not or OVER dialed in with an OVER reaction Monday. Or not dialed in completely.
1. When markets move, let's say in a strong bull market, like beans recently they might average something like +4c/day(arbitrary number). But that AVERAGE rarely features individual days of exactly +4c. There will be massive gyrations, especially in a weather market. Most days will be higher, some by double digits. Some days will be lower and Monday was lower by 40c, mostly because we had come so far in 1 direction because of extreme weather FEEDING THE BULL. So the market was especially vulnerable to a correction from too many traders leaning the wrong way because of hot/dry last week, when the forecast turned much wetter with less heat.
So today's reaction by the funds tells me that yesterday was OVERDONE. The actual weather changes were not worth exactly -40c to the value of beans which is how we traded but the weather changes were greatly amplified by a market extremely vulnerable to BEARISH NEWS and that got helped by lower crude prices.
Many of the fresh longs and short term traders from last week's upside break away gap higher signal, after sitting on hefty profits and thinking they had it made were suddenly watching the equity in their accounts plunge and they did a ton of selling at the market on late Sunday Night/early Monday. It definitely feeds on itself. If a market is going up and a long wants out, they can pick their price. If a market is going down and a long wants out, they have to chase it lower. If its dropping fast, they need to sell at the market and hit the bids, which quickly chews up those bids and we drop to the next level of bids which is setting off even more sell signals on computer screens which causes even more longs to put in orders to sell at the market........and it feeds on itself, especially if it got way overdone to the upside because the most recent longs will cry uncle first when they go underwater.
I think that what we did technically, for SX was just fill the gap higher from last Sunday Night and because it was such an old gap, technically it served as support now on the charts. (a gap and cap within a day or 2 is more of an exhaustion/reversal signal).
Each situation is different based on the dynamics/fundamentals. If the weather forecasts were to keep getting more bearish well into August, we will trade below the gap and all the chart people will say "see, filling the gap told us this would happen from a buying exhaustion gap and crap". If it turns hotter and drier and we keep going higher, all the chart people will say "see, the market came down to fill the gap, like markets often do at a later point and the gap served as support for the move higher"
In other words, THE WEATHER changes first(in a weather market) and the traders following the weather react with buying/selling and their reaction etches out points and lines on price charts from that reaction that can trace out powerful signatures/formations that line up with the changing weather forecasts.
But never at the exact value/change in price that the change in the weather is worth.
Let's say that the added rain to this weeks forecast means X millions more in production to the Cornbelt for corn and beans at the end of harvest. A bigger crop means more supply which means a lower price but not by something that can be accurately calculated a week before the rains fall.
And then there were the crop ratings yesterday. Those matter alot to the market in guessing new crop production. Yesterday's drop just confirmed to the market(whether it knew that or not last week with the rally) that THIS CROP GOT SMALLER IN JULY 2026.
If big rains are coming soon, the market will assume the deterioration will stop and trade that. Apparently overnight traders were focused on that still and the leftover mentality from Monday's massive drop. Overnight traders that were long last week and just got clobbered on Monday were not as likely to jump back in with week 1 rains going up overnight.
But as I mentioned, funds will often have a completely different mentality and for them, it's like the REAL trading day starts at 8:30 am. Or at least for the market as a whole(not just funds) its like there is a complete reset and we start over at 8:30 am, freguently with completely differen results than before 7:45 am. Instead of being 45 minutes later without much change in the news, the market acts like its a different day and has all sorts of NEW news.............but it doesn't. It's just a matter of the psyche of the market traders, what THEY want to trade as being important at 8:30 am compared to before and the overnight that closed only 45 minutes earlier.
Anyway, I don't see us going up too far with this much rain coming in the forecast.
Unfortunately, a lot of the key 12z model guidance won't be out until the market closes but the Canadian model and week 1 on the GEFS will be out. Even if it changes a lot, no way would I put on a position with less than an hour to go without the European model guidance out that could go the other way after the close.
So for me, I prefer to put on all my positions in the overnight session.........but that's me because it's open continuously for 12 hours and 45 minutes with every model updated at least 1 time(the GEFS is updated 2 times completely and almost a 3rd time).
+++++++
1216pm: Speaking of the early model, the Canadian 12z is out and I would not trade off of just this because there is too much rain in the week 1 forecast that might mess it up but the last map at 384 hours for August 12th is potentially pretty bullish. Note the individual solutions/members if you go to the link. There are still some bearish solutions.
IF that is where the weather is headed in August, than these prices are cheap but this is 1 model run from 1 model that the market doesn't follow like it does the GEFS or especially the European Ensemble and we close in less than an hour.
If the EE model adds a bunch of rain in week 1 after we close, the overnight session will be under pressure.
It's like the 1 bird in hand is worth more than 2 in the bush. At this time of year, with a rain makes grain mentality weather market.......bigger rains in week 1 are worth more than a heat ridge in week 2.
https://weather.gc.ca/ensemble/charts_e.html?Hour=384&Day=0&RunTime=12&Type=gz
Looking at everything, the HUGE deal right now is the HUGE rain event coming late Thursday thru early Sunday. Widespread and tracking from west to east across the entire Cornbelt. First shown on the Canadian Ensemble model late last week and NOT forecasted with any other guidance last week.
Now, the European Ensemble model is the wettest with its last 12z solution just out.
This is extremely bearish but NOT a pattern change that brings other systems like it.
Next week, the models lean towards a return to hot/dry with the hottest/driest in the WCB.
Crop report Just my farm 40 miles NW Cincinnati
6-22 1.1 in rain soil wet
Soil drying high heat humidity
7-2 corn starting to tassel heat looks ok yet
7-10 ground losing moisture fast
7-11 7/10 ths home farm, west farm 1/10 west farm has sandier soil and does not hold as much water
7-18 8/10ths home farm, 0 west farm
West farm corn curling hot spots burnt up. Beans west suffering. Beans home so-so
7-27 2/10ths not enough crop yields going down
This has been a year of the haves and have nots
Edit: The racons, deer, and birds are having a field day in my corn
Ouch, cutworm!
I was hoping you might catch a good rain yesterday evening
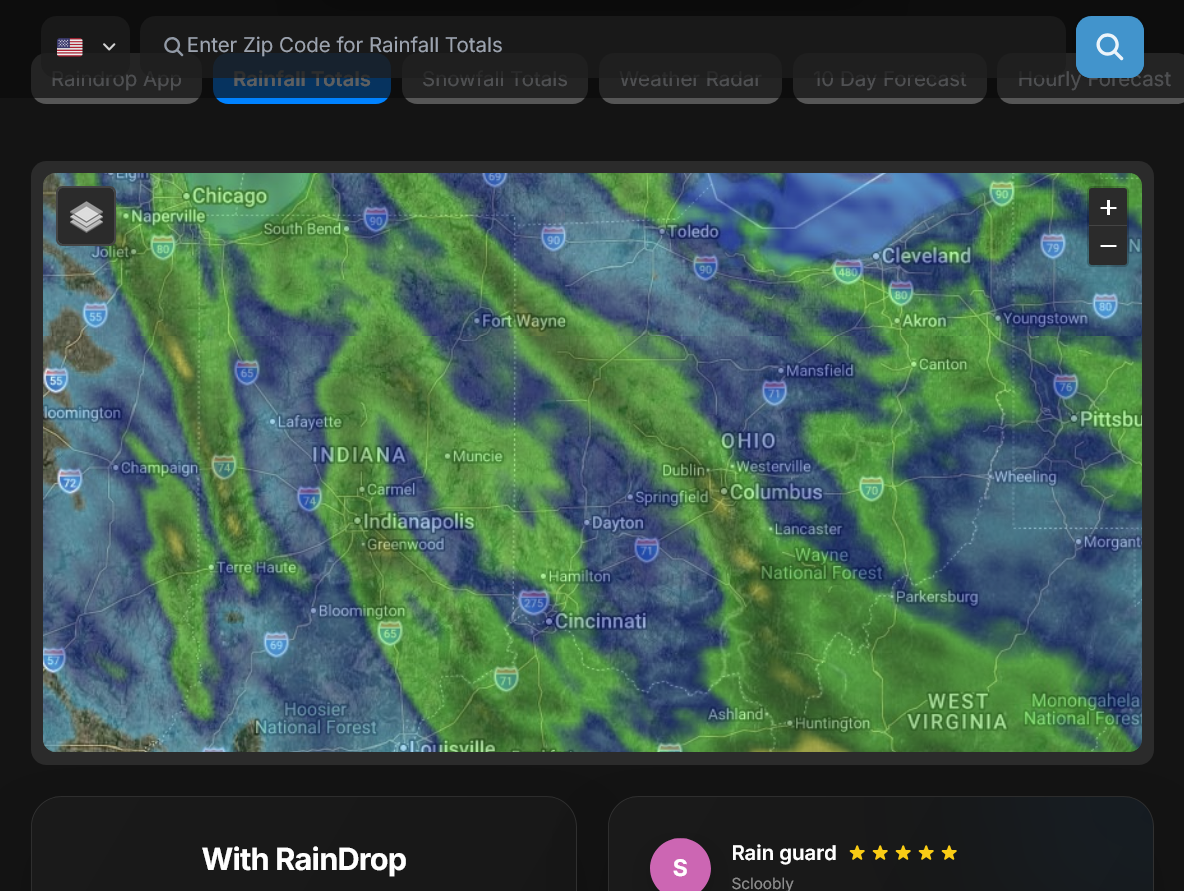
Readers can go to this link to get rains anywhere. Put in your zip code or just zoom in and out to see how much rain fell the past 24 hours anywhere:
https://www.raindrop.farm/rainfall-totals/zipcode
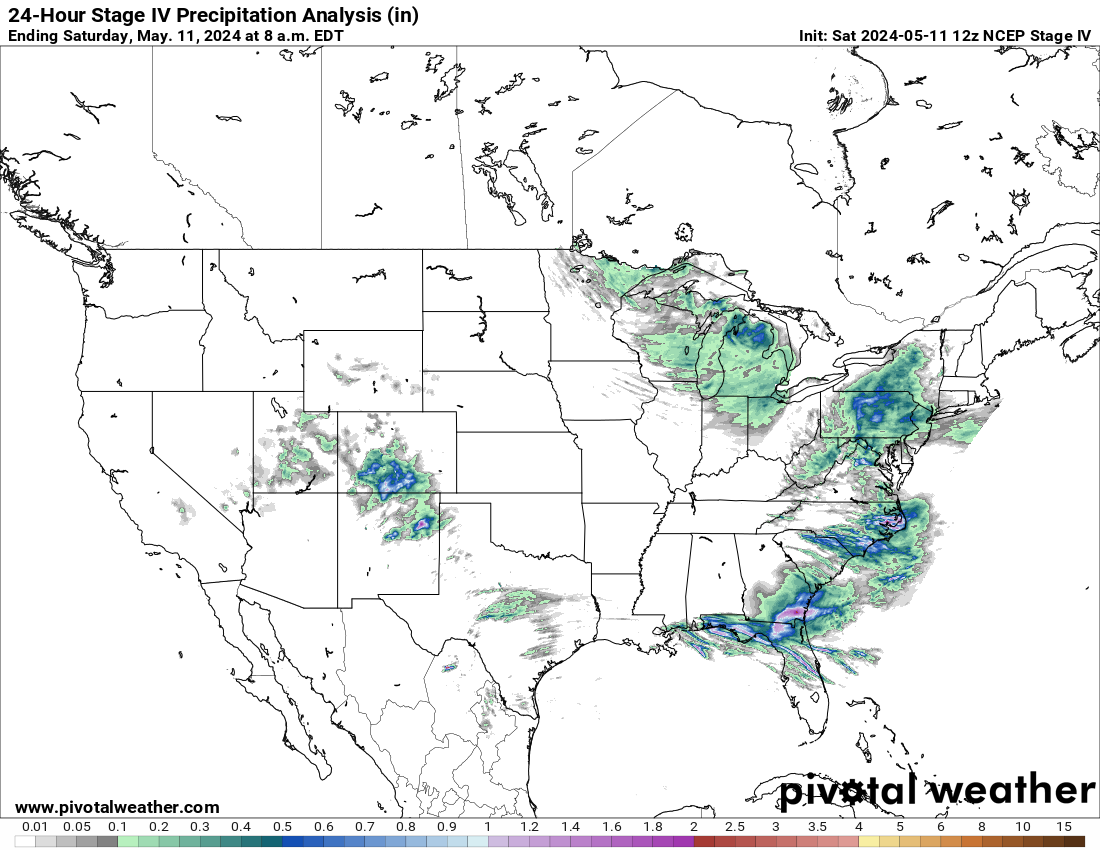
Another great link for 24, 72 and 168 hours on a nation-wide basis:
https://www.pivotalweather.com/maps.php?ds=stageiv&p=stageiv_qpe_168h_p&r=conus
These maps below will update automatically at this thread.
https://www.pivotalweather.com/maps.php?ds=stageiv&p=stageiv_qpe_168h_p&r=conus
Last 24 hours
Last 72 hours
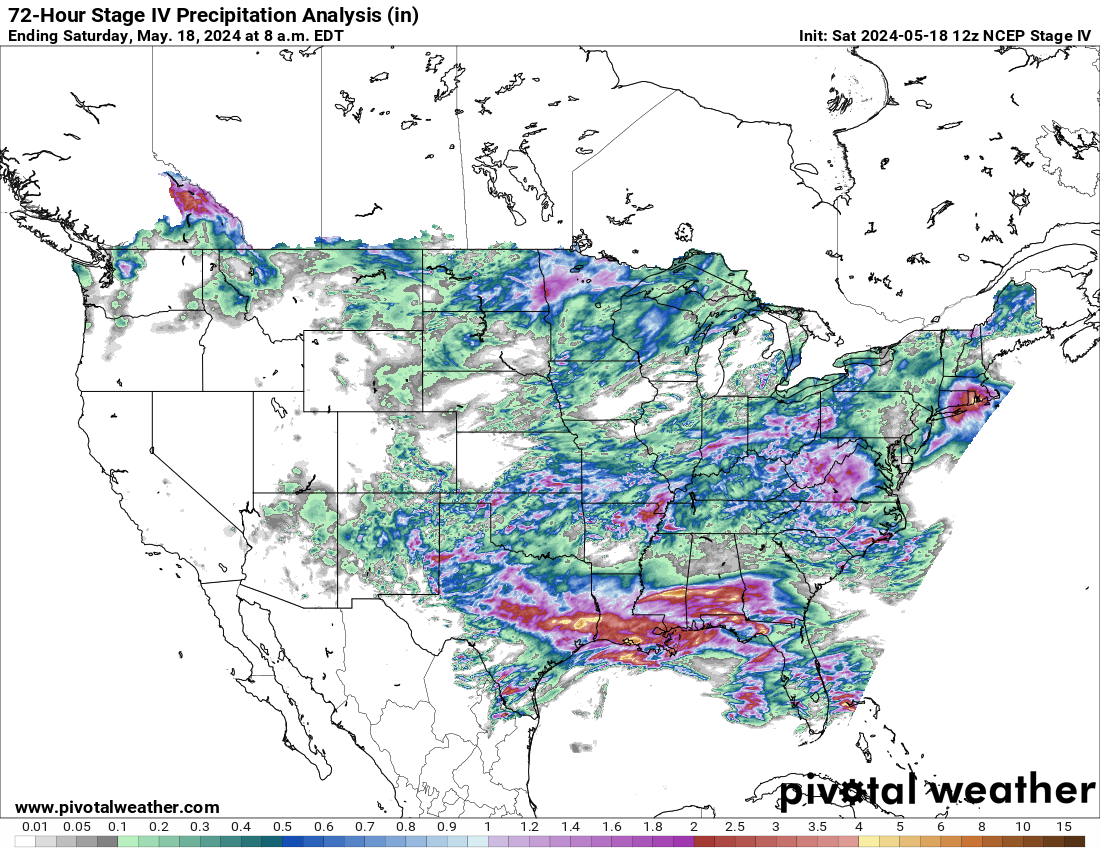
Last 7 days:
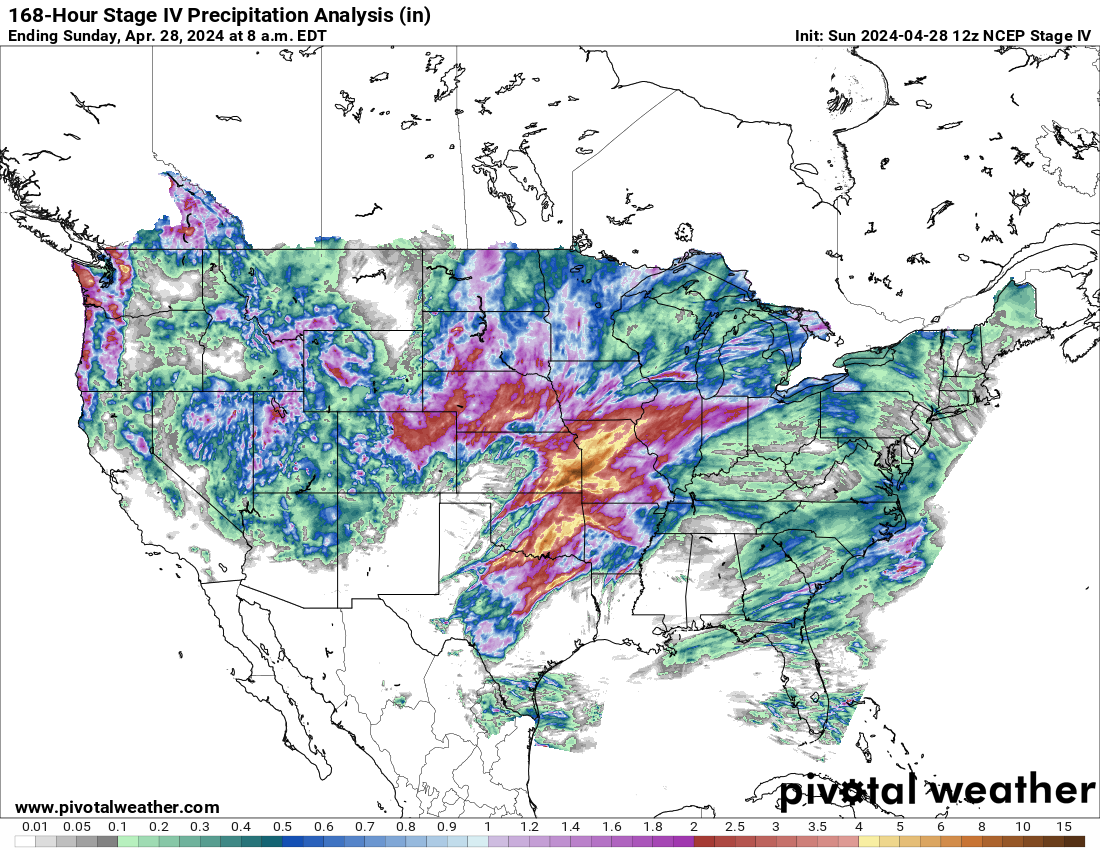
++++++++++++
5:30 pm:
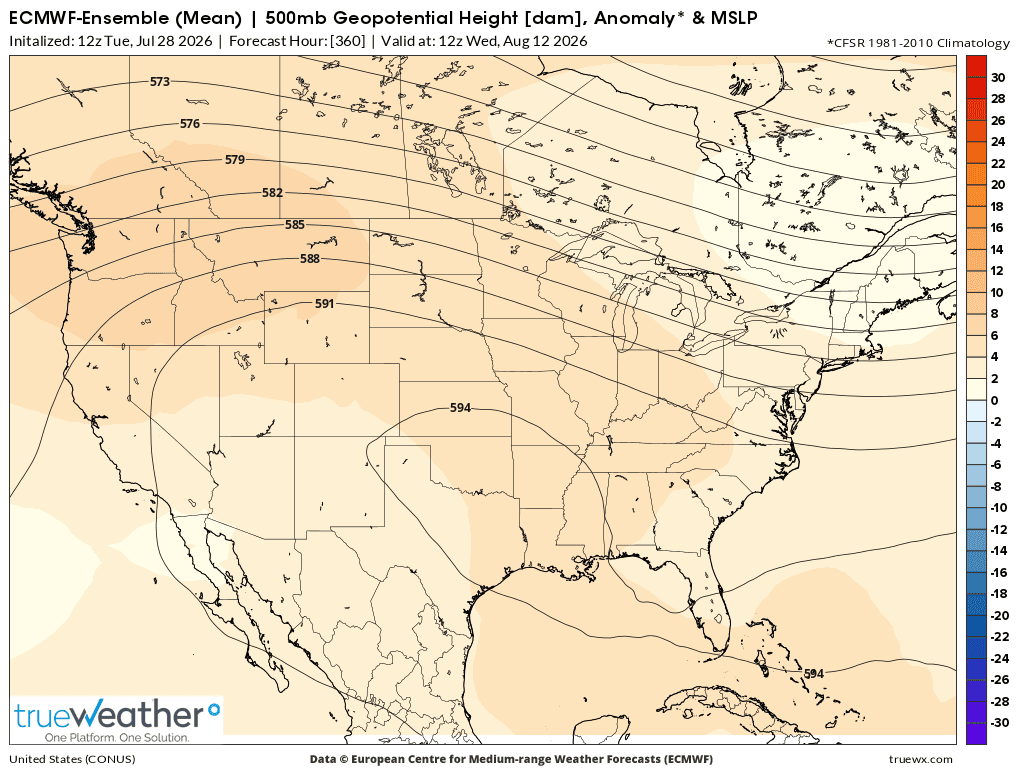
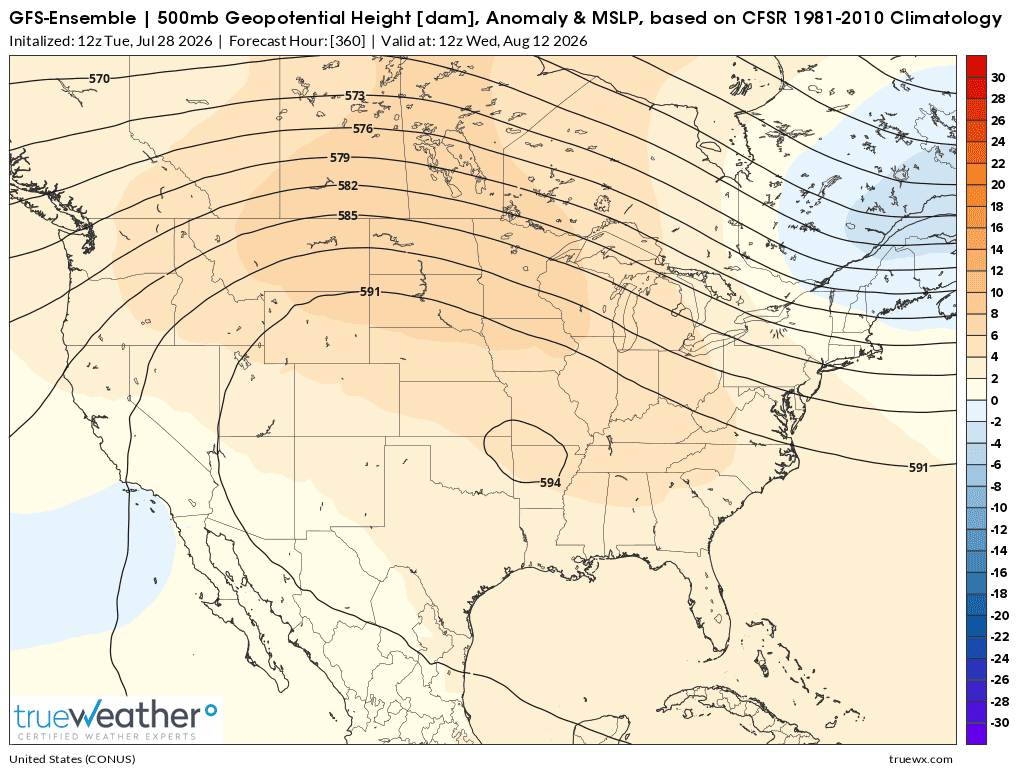
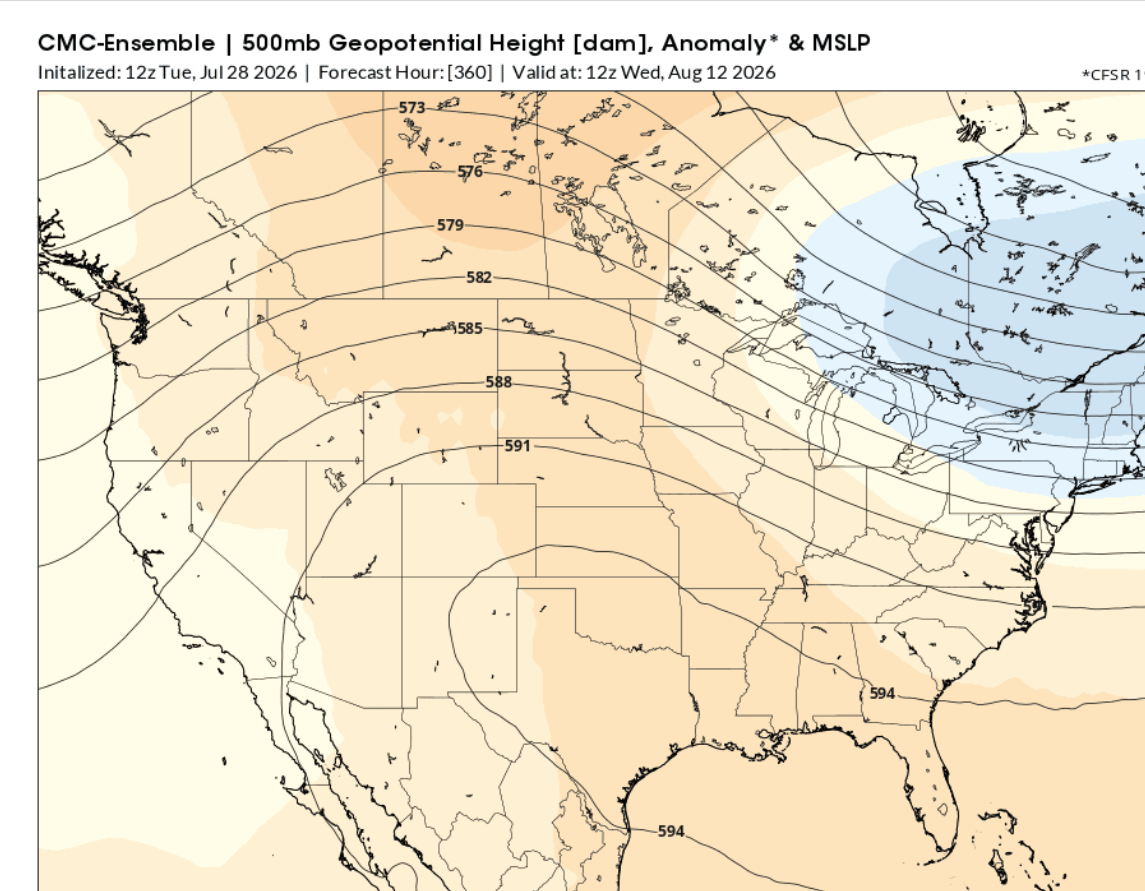
This was the last 500 mb map for 2 weeks(day 15) from the 3 main models. Heat ridge in the center and bullish for crop prices. Weak troughing East Coast, NOT bullish for natural gas prices.
1. European Ensemble
2. GEFS(American model)
3. Canadian Ensemble
+++++++++++
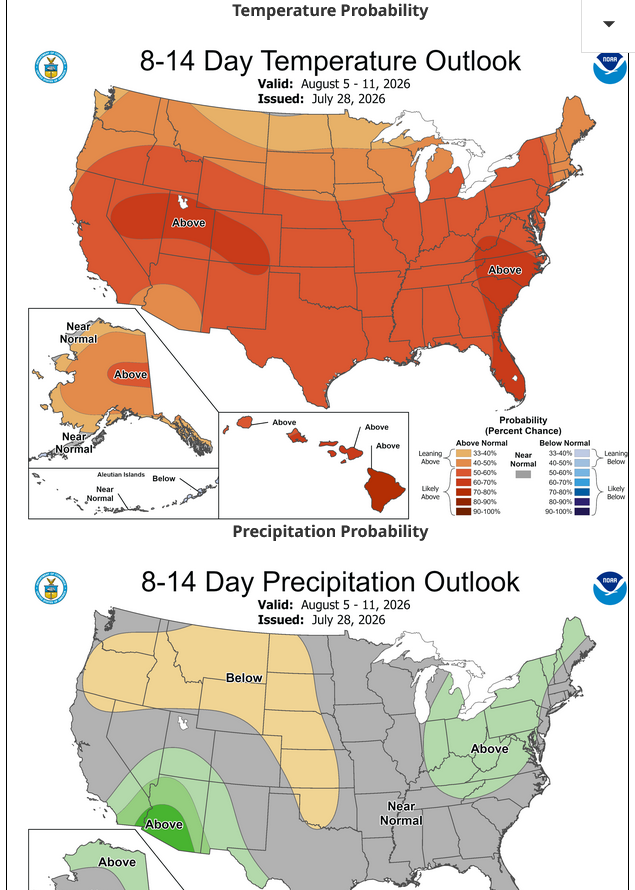
This was the NWS week 2 forecast. The only thing that I might question is the amount of heat in the East with a trough in that location, though some solutions want to build the heat ridge farther east. If that happens, it could increase rains in the WCB.
One thing for sure is that there will be some major heat in several locations, probably including the Midwest.
1. Heat in August causes "heat fill" for corn, no matter how much rain and LOWERS yields. It's an indisputable law of agronomy.
2. Heat increases evaporation rates and accelerates soil moisture loss and increases the amount of rain that plants need compared to lower temperatures.
3. The ECB and cutworm look to have the best chance for rains in week 2.
4. The weather is constantly changing. This Summer is featuring some unusual features that are fighting for control. This is not turning out to be a typical El Nino Summer with good growing weather because other factors are having a big impact too even though the El Nino is coupled to the atmosphere. Each year is different and the discussion might be much different in a few days.
7:25pm: The beans barely filled the gap higher from last week's start and that level held today. We are also trading just above the May highs. So the bulls still have control at the moment, ever after the -40c correction on Monday.
I am NOT interesting in being long ahead of the best rain event since June ahead of us. Today could have just been a partial retrace of the overdone Monday collapse.
I have no idea other than the week 1 weather has turned BEARISH and the week 2 weather turns back to bullish.
I'm not suggesting anything for others but would be personally interested in either side:
1. Long if rains come out of week 1 and week 2 looks more bullish or
2. Short if week 2 also gets more bearish with robust week 1 rains on the way or falling.
3. There's alot of non weather stuff that can spike us up/down, even in a weather market. News on Chinese buying, the Iran War, Europe's weather decimated crops, Russia/Ukraine and so on.
Not much change. Too much rain coming up, with a widespread event across much of the Cornbelt, starting soon and lasting into Sunday.
This should be the biggest rain event for the C and S crop in well over a month.
https://www.marketforum.com/forum/topic/83844/#83848
7 Day Total precipitation below:
http://www.wpc.ncep.noaa.govcdx /qpf/p168i.gif?1530796126
TY for your guidance. SX getting new lows
Thanks, tjc!
I hadn't even looked at the price since the day session open. WOW!
Unlike yesterday, when the big funds came in buying from the get go, they came in selling today!
New lows for the move this week and violating support and bullish interpretation giving the bears control now.
In searching for a reason for to explain the magnitude of todays losses, I looked at the overnight 0z European Ensemble model and see a clear increase in week 2 rains.
The NWS week 2 guidance this afternoon could come out wetter than it has been in quite a while.
Very often, when we see the models picking up on something new, it takes them numerous days to see it better and better before it grows into a significant pattern change.
The models have definitely been too hot in the Midwest/Plains with the forecast this Summer.
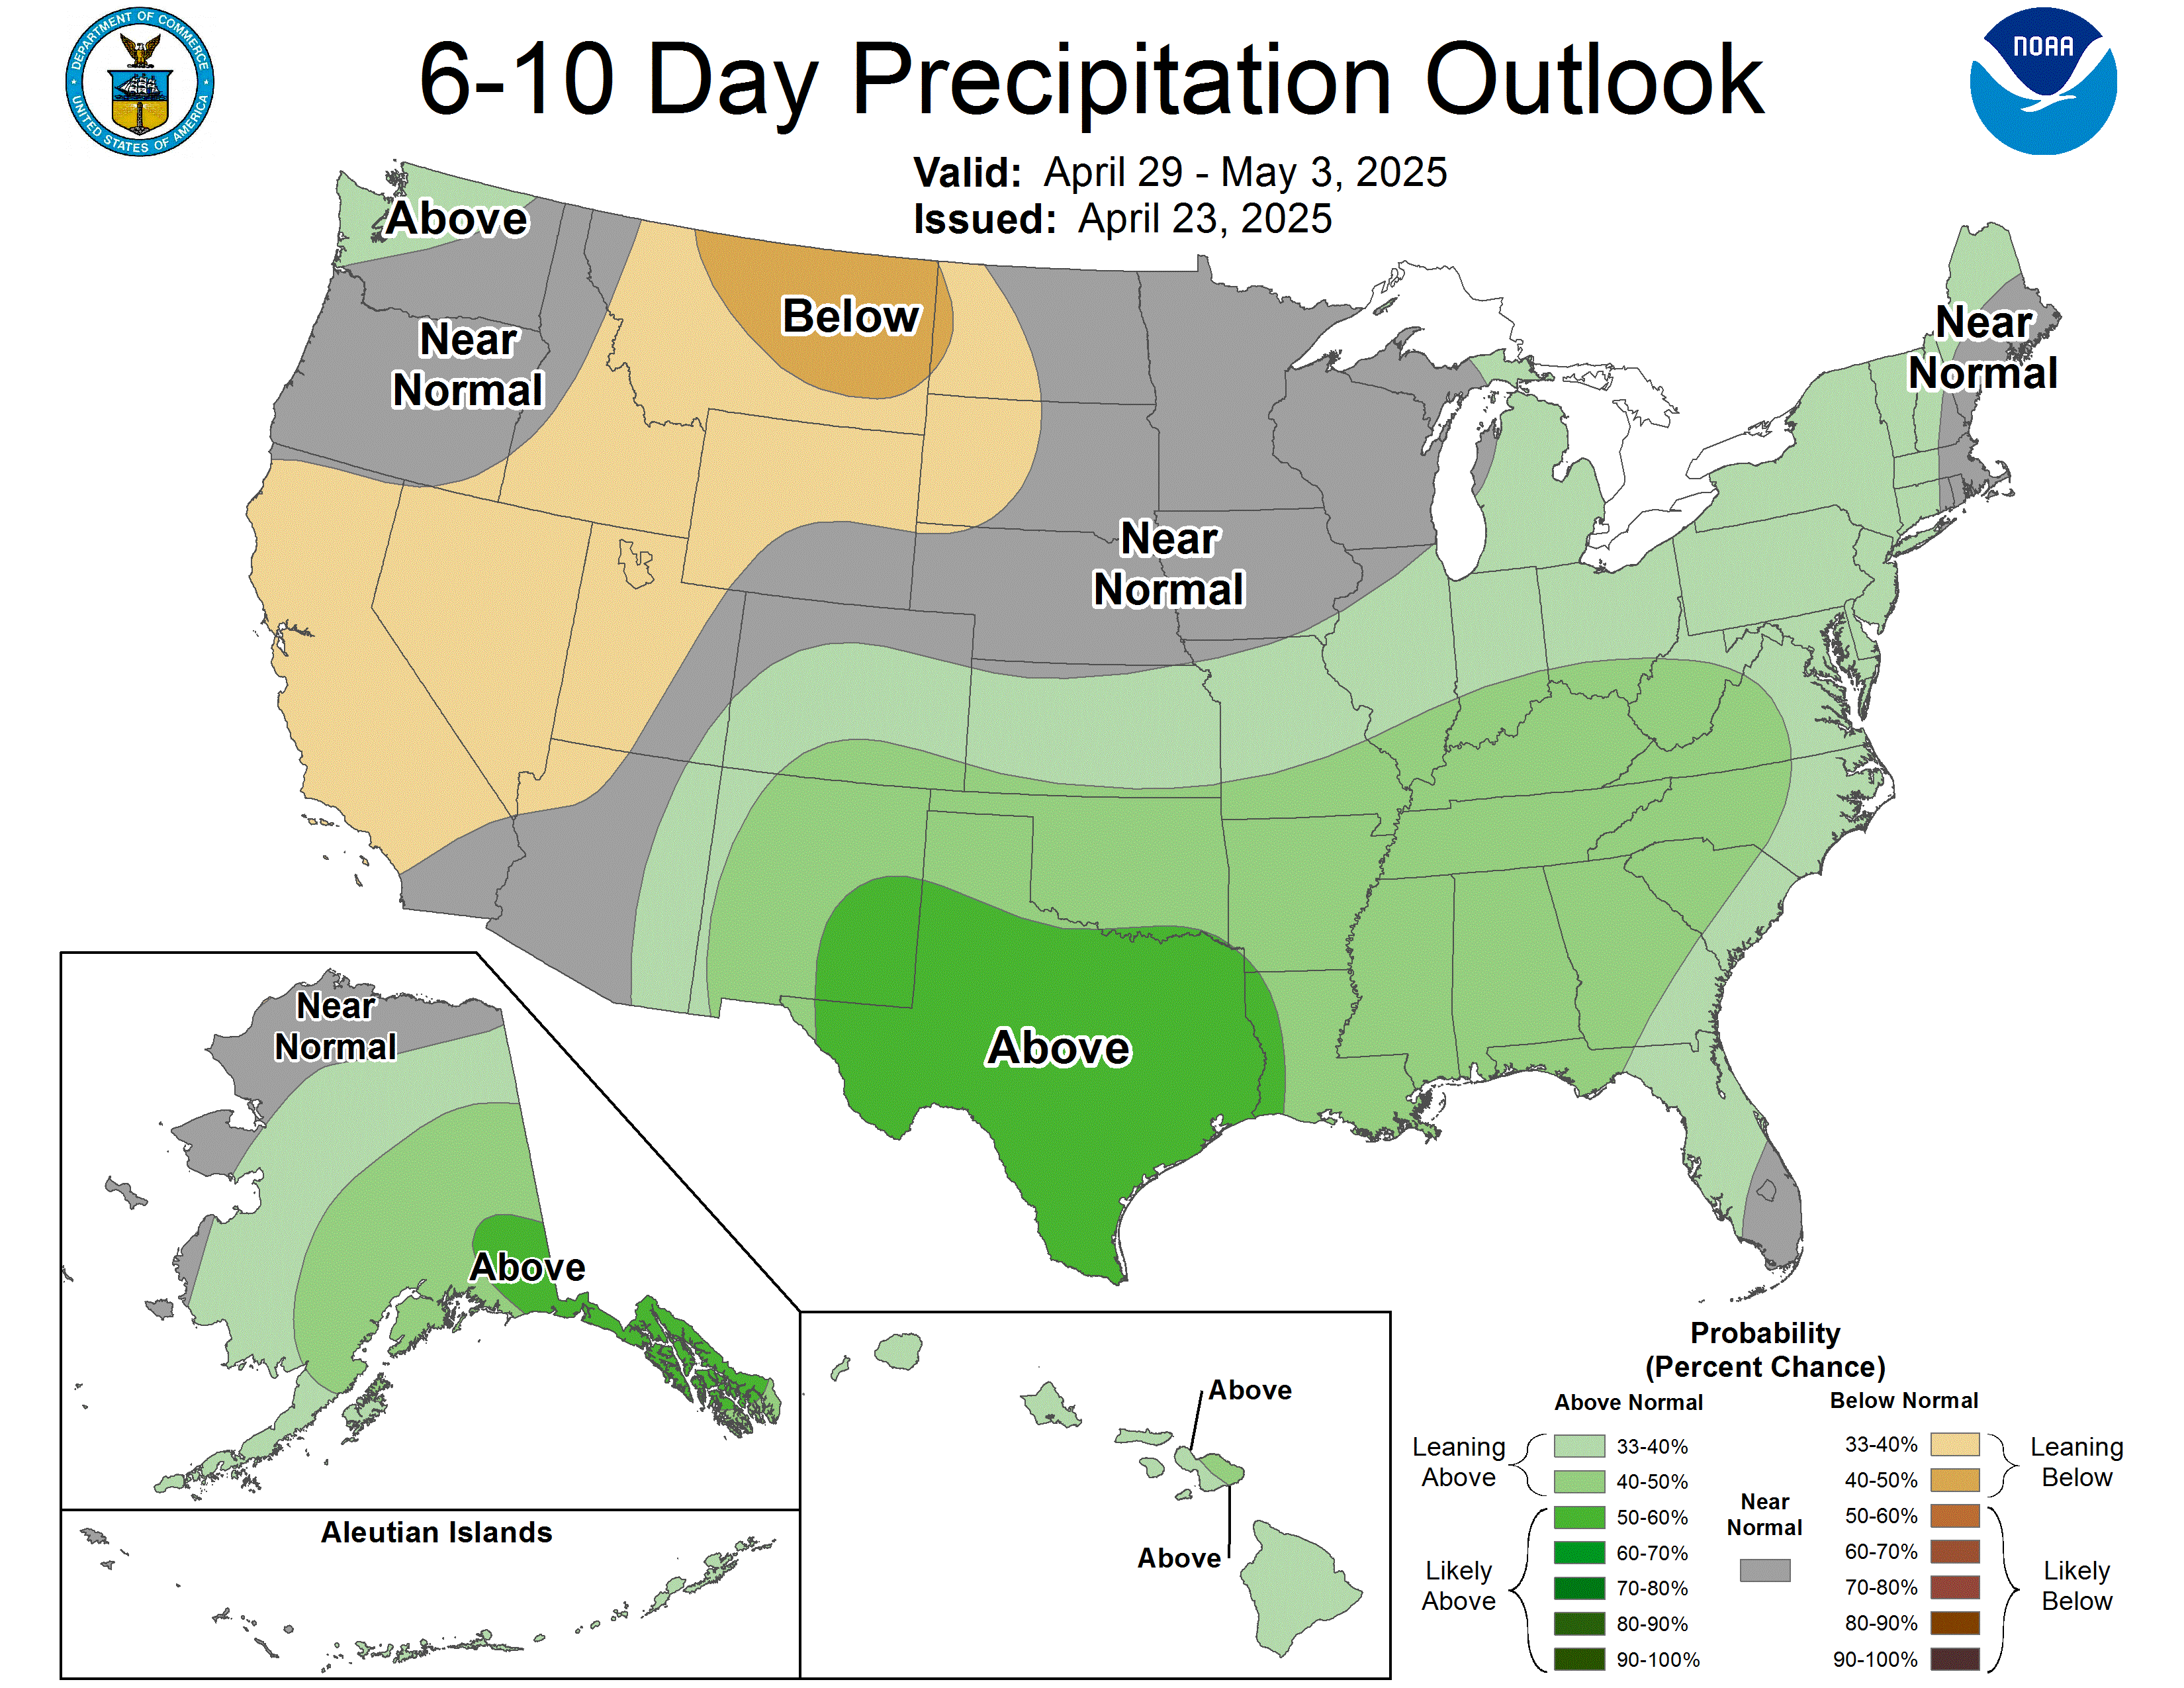
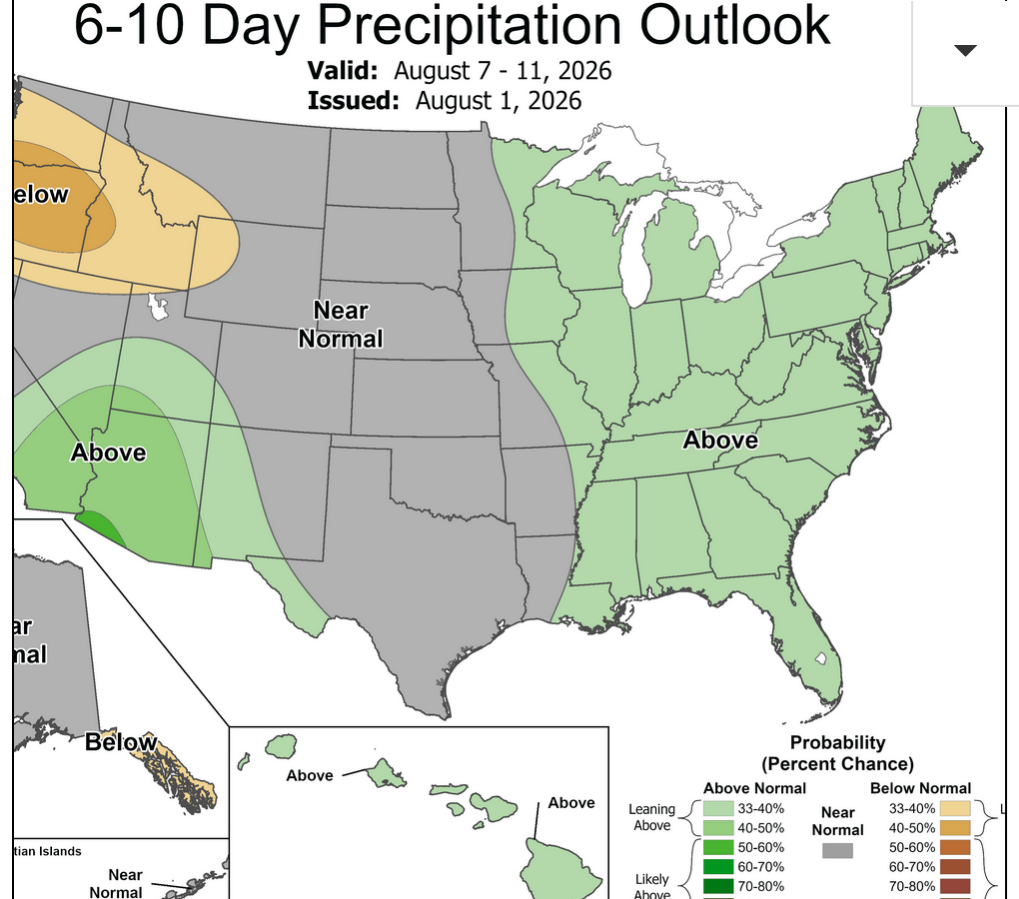
3pm: The 6-10 day WAS wetter than yesterday and the wettest 6-10 day since back in June maybe.
It will be automatically updated below, so if you're reading this on Thursday and beyond, you'll see the latest map and not the one being commented on Wednesday.
Here on Wednesday, it has green from eastern MN/IA/IL to all of IN and south/east and no brown in the Cornbelt.
https://www.cpc.ncep.noaa.gov/products/predictions/610day/
The upcoming HUGE rain event has been fully dialed in. How much falls will matter too short term. MORE than expected could push us to new spike lows. LESS than expected will have us going higher again.
Week 2 is still a bit wet on the GEFS but the European model goes back to mostly dry.
7 Day Total precipitation below:
http://www.wpc.ncep.noaa.govcdx /qpf/p168i.gif?1530796126
Weather forecasts must have gotten 'dryer' based upon 730-745am ct rally. Mike/Larry?
Now at 845, grains resuming down trend
Hi tjc,
The market has been trading this actual rain event all week. It's been bearish BEFORE the rain falls and often DURING the rainfall, especially if it's a big rain.
Once the rain falls, like we're seeing, it takes away from the rain in the forecast and automatically subtracts it from rain in the forecast, even though we might have the same forecast for all the days after the rain.
In this case, the drier forecast for next week has not changed but every hour that goes by last night and today, means we have an hours worth of bigs rain taken out......... less and less rain left in this event.
It's a less bearish/more bullish forecast automatically from rains on the weather maps being turned into rains in the measuring gauges.
Overnight, SX went from 1188 to 1196 from this but then the rains picked up to more than expected and we quickly spiked down to 1186 and new lows, then had the bounce that you mentioned to 1191, which is mid range exactly.
Look for extreme volatility here with potential upside even though big rains headed into IL have been known to drop beans by XXc.
Same forecast as yesterday except a days worth of BEARISH rain has fallen.
I forgot to include a radar image last night
8:35am: Despite SX having some strength here, CZ is making new lows.
I looked closely at the days in the forecast today compared to the same days yesterday left in that forecast with the additional day today and its slightly LESS bullish.
So any bullishness we get today will come from taking out rain that has already fallen.
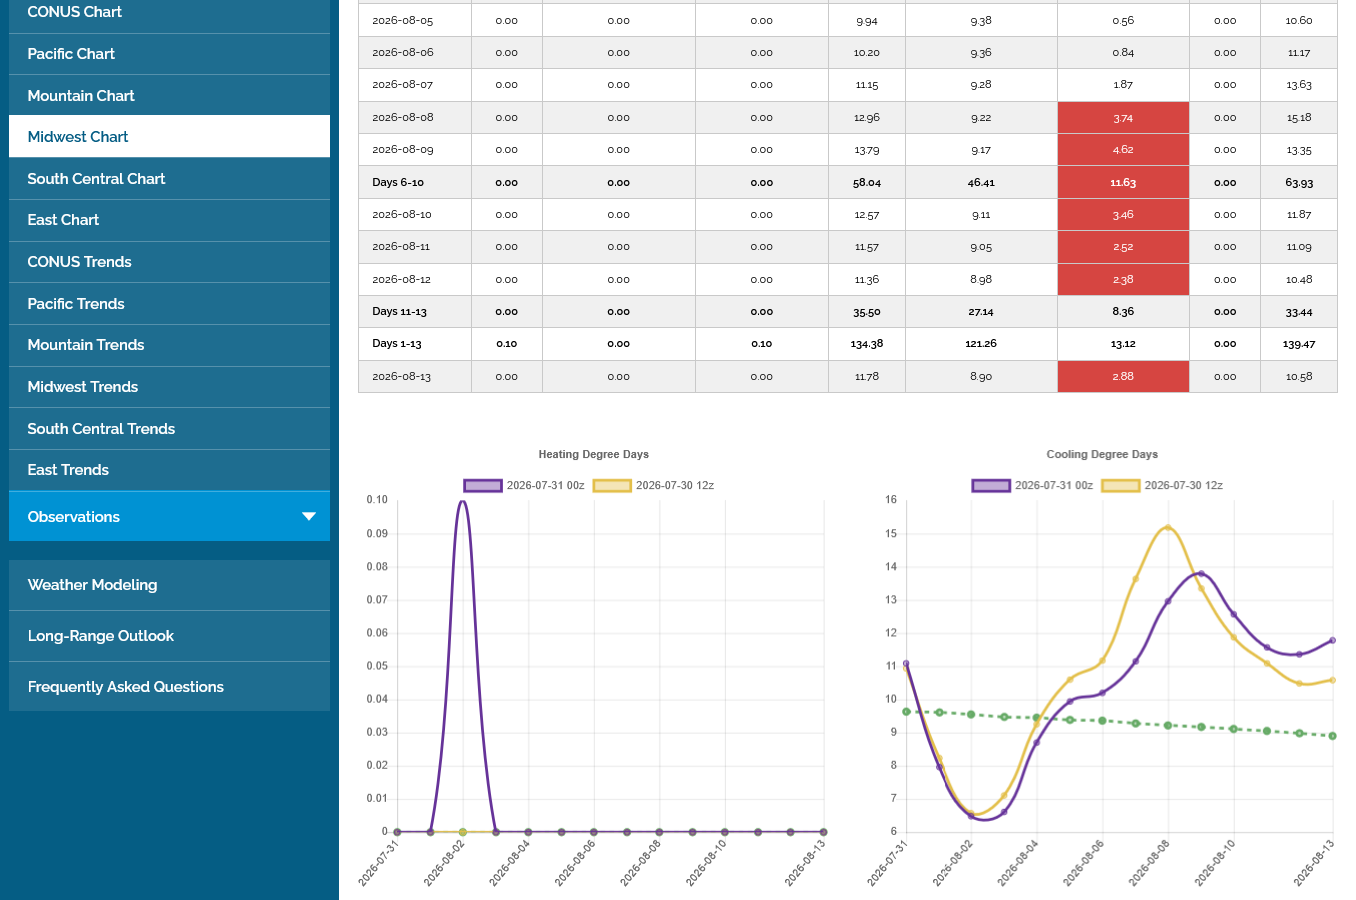
8:47pm: Part of the LESS bullish outlook today includes cooler temperatures. These are the CDDs from the last 0z European Ensemble model in purple/right. They were -5 CCDs compared to the previous run.
A big spike up in heat next week is LESS hot, then cooling quickly in week 2.
I honestly don't think we can guess at what beans will do today. With different forces and the weekend ahead, traders guessing what we will be facing on Sunday evening.
If we closed +15c or closed lower I would not be surprised.
AgTalk Farm website has Neb, SD, w Iowa guys complaining of lack of rain. MN seems to be getting over 2 inches and very pleased. Suspect east Iowa and Illinois actual rain will determine whether bottom is put back in
Thanks, tjc!
Anybody's guess on market reaction today and I don't have one other than leaning up just because every drop of rain that falls, is less rain for the bears in the forecast.
This is for everybody:
We don't need to always be trading for the action. The best traders wait for the best trades with the highest confidence, while missing some lower confidence trades and ACCEPTING that, so that when they miss some trades, they don't kick themselves for not being in the market all the time.
The nice thing about waiting for the higher confidence trades is that it allows us to "load the boat" and trade with much higher size because of the much higher odds of being right and lower downside risk.
If, however a trader is trading all the time and with smaller size in the low confidence settings...........what's the point?
The overall results of that trader will be determined, mostly by the larger trades(with size) that will count X times more than the smaller ones that are just that trader gambling based on low confidence and a need for the action.
It's fine if a trader enjoys using the action/gambling for entertainment and challenge. It can be very stimulating and help keep them connected to the market. At the same time it turns addicting and exhausting at times and makes it tough to know when to load the boat.
And worst of all, it means there will be losses and account churning that don't need to happen.
Everybody is different. Day traders have a different mentality than position traders. If you're a day trader, then forget most of what I stated above.
I'm also much older today and don't like staying up half the night babysitting my trades by watching every model solution as it comes out.
If I was day trading today, I would only do it from the long side but I'm not trading because the extended forecast did not get more bullish overnight.........its all about rains already fallen..........and however the market feels on a Friday, which is a different mentality than the same stuff on a Monday.
+++++++++
9:15 am: The fact that we're seeing the 2 sided trading today is exactly why I'm not trading. I want to have a position when 1 side has such an overwhelming edge that we mostly go in 1 direction and I see that BEFORE the market reacts.
The benefit of that is being able to get long or short early in the move and quickly be able to put in a protective stop that locks in X amount of profits.
When the market is gyrating up and down, like it has been since the open last night, that's impossible. If you bought the open last evening, you had a nice profit, then we spiked BELOW that level. Then we spiked to the highs, then we spiked back towards the lows, now we're up again.
The weather is not causing the up then down, then up then down then up. It's uncertainty from traders with different ideas of where value is, many using technical levels today. Maybe part of it based on the radar images and rains falling and there are situations where the rains are much greater or much less during the trading session that have resulted in double digit moves.
Corn and beans making new lows. Impossible to predict what happens today!
12:25pm The Canadian model is the first one to come out and it out thru much of week 2, continuing the COOLER (less bullish) trend of the other models overnight.
I doubt the models are making the 12z Canadian model top priority for buying and selling the grains with less than an hour to go in the trading week but it is more bearish so far, mainly from cooler temperatures.
This is also bearish NG and for corn filling(beneficial)
1pm: This was the last map of the 12z Canadian Ensemble model. Go to the link and see the incredibly wide spread in the individual members that make up the mean. Numerous are incredibly bearish. A few extremely bullish. It is cooler for the Midwest than recent guidance, including the already cooler overnight runs.
https://weather.gc.ca/ensemble/charts_e.html?Hour=240&Day=0&RunTime=12&Type=gz

1:14: The 12z GEFS is out thru 10 days and is also a bit cooler and wetter too. This really makes no difference to the close> just passing along.
The guidance has been getting WETTER for the Cornbelt in week 2.
Good chance the week 2 NWS guidance this afternoon will start adding rain.
++++++++++
3:55pm CDT:
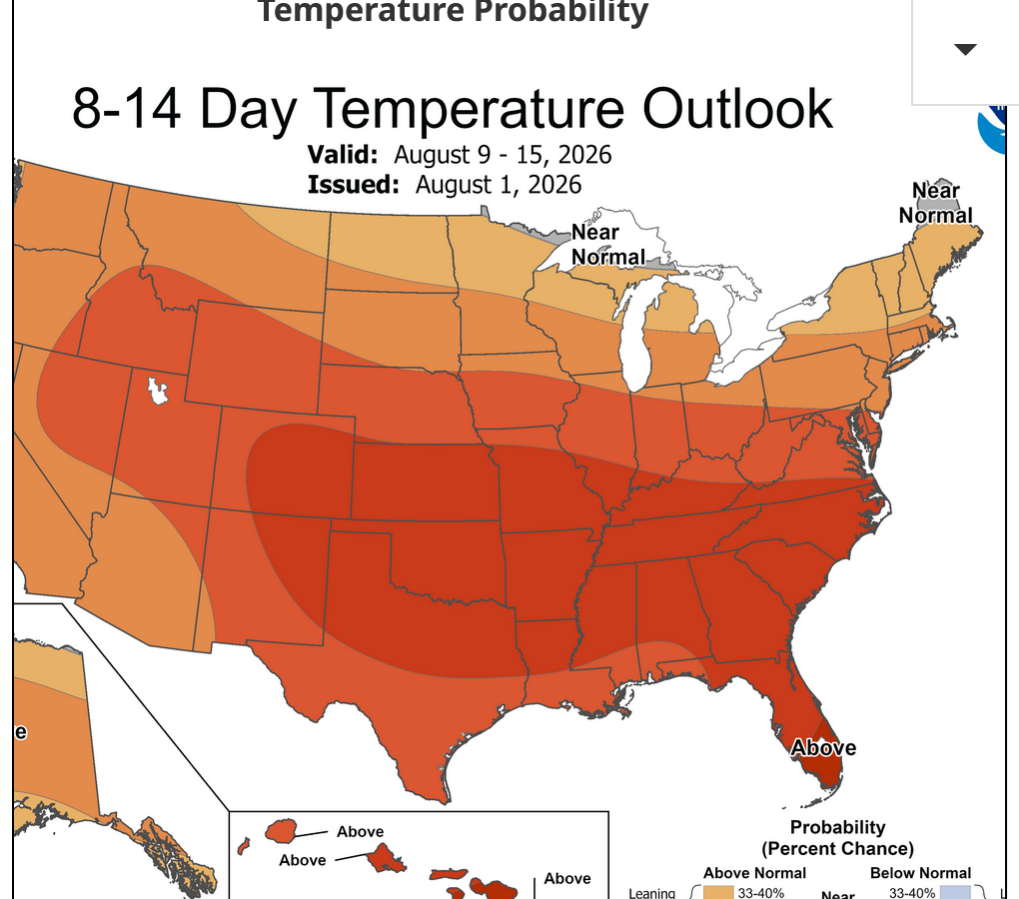
Yep the NWS added a ton of rain today:
https://www.marketforum.com/forum/topic/83844/#83852
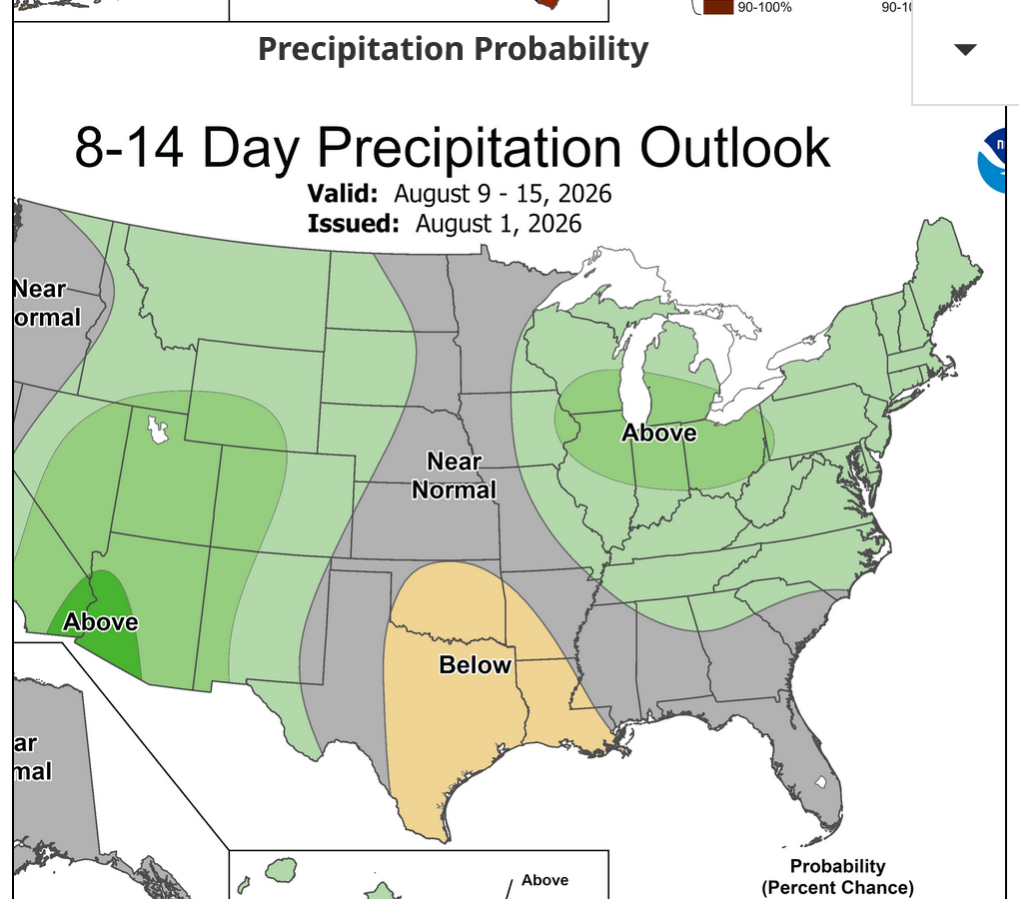
Still plenty of heat but much farther SOUTH and east, where a lot of people use air conditioning. Could turn bullish for natural gas!
Eric's awesome weather from the last day in July!
July 31, 2026: July Forecast Grade | Wet Cornbelt, FL Coast | HOT/DRY Southern Plains | OR/WA Fires
https://www.youtube.com/watch?v=eq0-pZmAm84
+++++++++++++
The weather continues to look excellent for crops but bearish for prices this week. We already had a huge price plunge because of this last rain so its uncertain how bearish this will be for the market now week.
There were many areas of the Cornbelt that missed the last rain but that's always the case at this time of year.
Another great link for 24, 72 and 168 hours on a nation-wide basis:
https://www.pivotalweather.com/maps.php?ds=stageiv&p=stageiv_qpe_168h_p&r=conus
Thes map below will update automatically at this thread.
https://www.pivotalweather.com/maps.php?ds=stageiv&p=stageiv_qpe_168h_p&r=conus
Last 7 days:
++++++++++++
Our rain gauge measured just .38" from this last event, not nearly enough. However, the wonderful 1.5 inches the previous weekend means we aren't suffering.
cutworm has not been so lucky recently
How much did you get, cutworm?
Paraphrasing MetMike.....market made a huge plunge this past week....uncertain how bearish actual rain totals and possible cooler/wetter week 2 will be...
Totally agree. Daily cycle either ended Friday or possibly Monday for S and C. 3 daily %R buys S, first daily buy C; weekly RSI back down to 50. Correction may have completed.
Thanks, tjc!
How much rain did your area get from this event?
+++++++++++
4pm: The updated NWS week 2 guidance added more rain as expected.
https://www.marketforum.com/forum/topic/83844/#83852
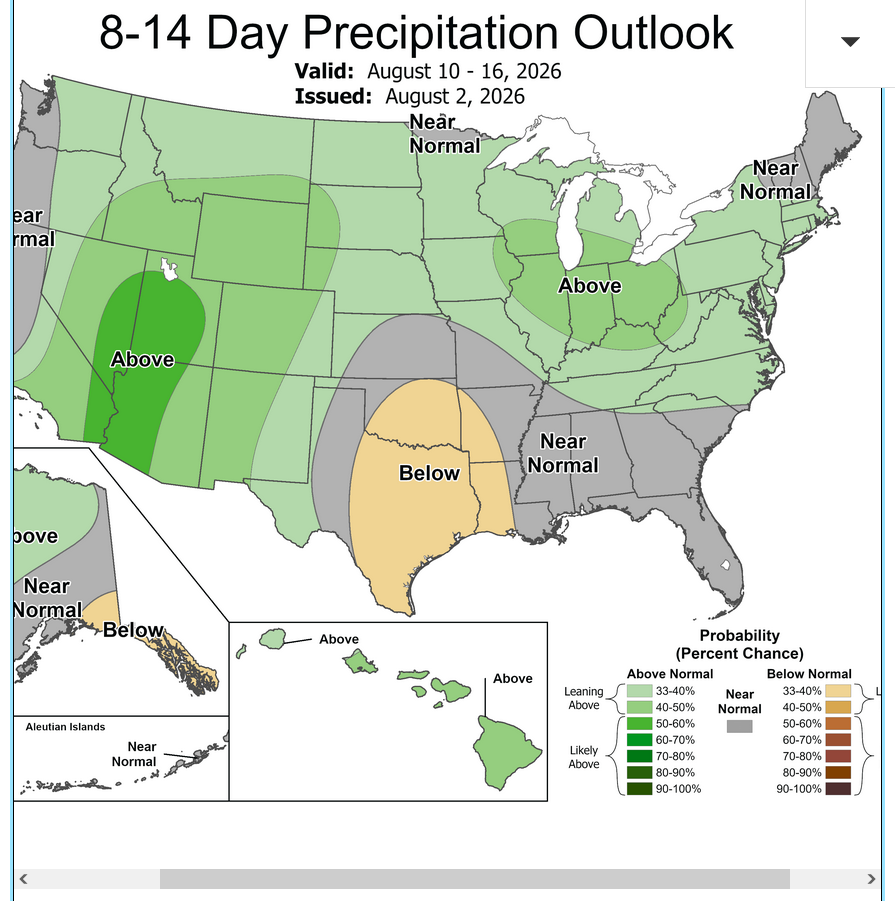
The market will NOT be able to use weather for a reason to go up.
We could trade expectations for tomorrows USDA crop condition/ratings released at 3pm.
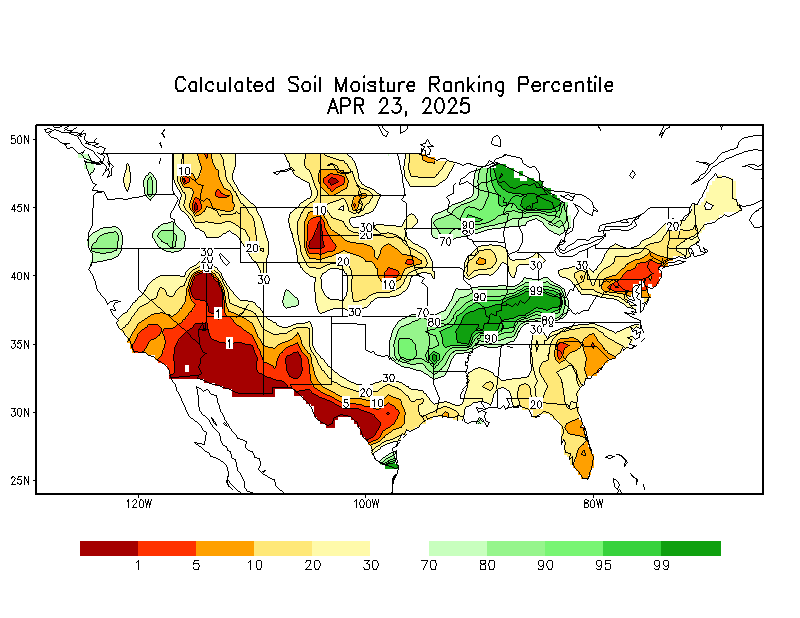
The northwest belt and far ECB are still dry enough to see ratings drop more.
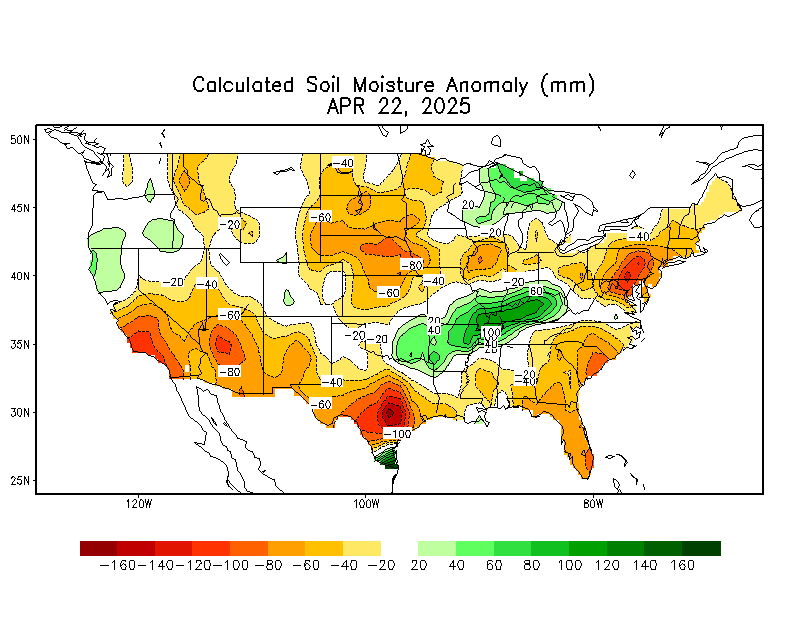
Everybody else seems to be doing well and could have a contra seasonal, slight improvement.
https://www.cpc.ncep.noaa.gov/products/Soilmst_Monitoring/US/Soilmst/Soilmst.shtml#
Market continues lower. I am stopped out of oats, wheat, and "soon" most likely bean oil.
Will reevaluate toward end of week (end of daily cycle band), but damage really done to charts.
On vacation in TN, so I do not know how much actually fell, but drove in rain on I80 east to 65 south.
2 3/4 inches Saturday 1/4 Sunday here at home
1 4/10 Saturday on west farm. drought damage on west farm has cut yields by some unknown amount that cannot be recovered
better late than never, cutworm!
thanks, tjc For sharing your trades with us. I have nothing new to add except that the market doesn’t want to keep going down, despite praetty bearish weather.
There will be some heat so that means heat fill for corn even with ample rain!
SURE looks like daily cycle lows, right on schedule. sad
Thanks, tjc!
Happens all the time. In fact, more often than not, which is why I limit my trading to ONLY when the trading set up is coupled with the weather.
1. When the trading set up is in a buy more, like we have and the weather set up is in a sell mode...........they cancel each other out, especially after the weather impact already took off XXc from the highs.
2. Last month, when we were going up, the trading set up(with an upside break away gap higher) and hot/dry weather forecast was a screaming buy mode.
3. After a huge rally of XXc from very bullish weather, the market turned into a selling set up from XXc of weather premium being baked into the price because of extremely bullish weather EXPECTED to result in Y amount of damage to the crop and Z amount of reduction to supply.
4. The criteria of the selling set up, well defined could only result in triggering an actual trade when the very bullish weather driving the move up, changed to less bullish or even better, BEARISH. That trade was mainly valid with minimal risk BEFORE the market reacted to take out risk premium by dialing in the NEW, much more bearish weather pattern that reduced Y amount of damage(added Y of benefits instead) and added Z amount of supply with a drop of XX in price.
5. After that huge move down last week from bearish weather, along with longer term bullish fundamental factors and chart interpretations, this week is in a buying set up but only if the weather flips back to bullish. THEY MUST BE COUPLED TOGETHER TO TAKE THE TRADE IN A WEATHER MARKET.
6. Since they are fighting each other here(and that happens very frequently), they cancel each other out. You find that frustrating because you want to be in the market for the action. I find it being a time to relax, enjoy life and continue to monitor extremely closely by analyzing the weather(my love since 2nd grade) and analyzing the markets closely (my love since I started trading in January 1992). Not being frustrated by things beyond my control. I REALLY WANT the weather to be bullish to be long so it lines up perfect with the buying set up which you see. However, on Monday, August 3, 2026 the weather is bearish. Dang! But so what? I can't do anything but accept it and even if I didn't make another trade this year and missed some huge ones, I almost doubled my money in 2026.........and have equity in an account to make a trade any time that I want ON MY TERMS!
7. If the weather quickly turns bullish tomorrow or the next day(definitely could happen with this heat ridge) and the markets have already bounced XXc from the lows because of the set up, then a decision can be made to get long but with INCREASED risk by the amount of the bounce off of the lows.
8. As mentioned earlier, this heat IS BULLISH for corn, even with the good rains because of heat fill. Despite that, I can't assume the market will trade that when so much bearish rains are in the forecast.
Re: Re: Re: Re: Grains 7-25-26
By metmike - July 28, 2026, 8:20 a.m.
The heat coming up thru August will take away yield from corn, even in areas with ample rain because of heat fill.
Here's our best thread for explaining and illustrating this principle:
HeatFill for Corn
Started by metmike - July 14, 2023, 2:47 p.m.
https://www.marketforum.com/forum/topic/97257/
++++++++++
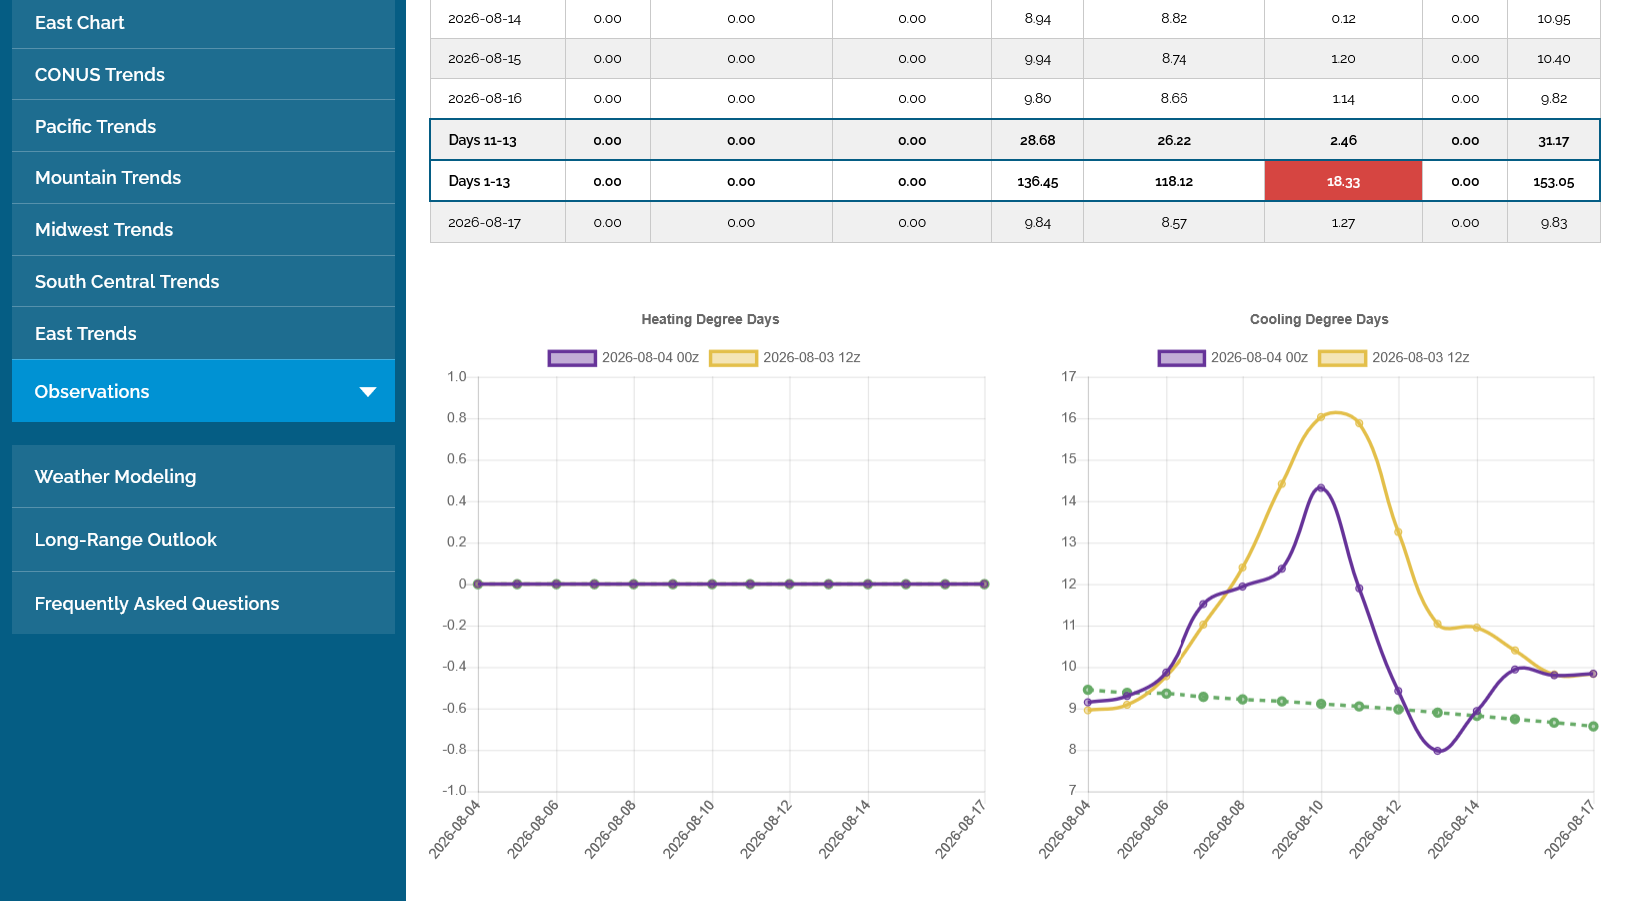
Added: The temperature forecast overnight Monday plunged lower and took away some of the heat risk that helped with Mondays dead cat bounce.
By metmike - Aug. 4, 2026, 10:52 a.m.
The overnight guidance took out a tremendous amount of heat for the Cornbelt.
This was the last 0z European Ensemble model for just the Midwest(purple line on the right-previous 1 from 12 hours earlier). Holy Cow! -17 CDDs!!!
Well reasoned, MetMike, but respectfully disagree.
THE buy weeks ago was with technicals and cycles strongly suggesting a LOW., which was followed by your change in weather. The most recent high was at over valued RSI, %R sell signals, and an extended daily cycle, which resulted in a sell on a Friday close. Down went S and C.
Friday %R, RSI, and cycle low timeframes suggested a buy. Weather says no.
My plan is now to buy on a test of these Monday lows.
Thanks very much, tjc.
Use whatever you want to trade and I love, respect and greatly appreciate your wonderful analysis.
Disagree with me if you want too, my favorite posts here are those that do that(we are an ANTI echo chamber at MarketForum).
I'm just defining what I use to trade.
Like often happens, the day session traders(big funds) have a completely different mentality like today.
After weak trading all night, the funds came out of the day session gate as buyers which has taken us to new highs during this session with corn leading the way. Is it from the heat and heat fill coming to corn? I could believe that because that's what I want to believe from what I stated over the weekend but we don't know that for sure.
Crop report:
Corn -2% from the good.
Beans no change.
Cotton -4%, all the went into the P/VP.
https://esmis.nal.usda.gov/publication/crop-progress
https://esmis.nal.usda.gov/sites/default/release-files/796007/prog3126.txt
+++++++++++
Thanks to Eric!
https://www.youtube.com/watch?v=dG7zSSLCCqs
++++++++++
Today's bounce could very well have been helped by MISSED pockets and expectations for the continued deterioration of the crop, along with the heat, especially with the corn.
AGREE, missed pockets. Funds re-interpreted THEIR weather. BUT, techs FOREWARNED!!
You had a HUGE advantage years ago--now you must anticipate THEIR weather--over sold/bought, cycles, RSI, %R, or AT LEASAT a combination of techs AND then your weather. Did you not 'observe' lack of rain? ON FRIDAY, just before close, I ignored rain/weather, then capitulated OH SO CLOSE TO THE BOTTOM--should have slept in!
You always bought/sold based upon your advantage--must rely on at least something else?
NOT criticizing, to me, just now a foregone tech advantage---it rained, so what!!! Not enough where it was needed. I did the prudent thing, set a loss level, and got stopped out.
NO matter.
I with the finest 8 grandchildren anywhere!
Thanks very much, tjc!
"ON FRIDAY, just before close, I ignored rain/weather, then capitulated OH SO CLOSE TO THE BOTTOM--should have slept in!"
You assume that a 1 day bounce means the bottom is in and you missed it. That could be the case but we don't know.
I understand traders remorse better than anybody. NOT pulling the trigger when I should is my biggest fault at this stage.
In your case, you are extremely active and kick yourself way too much for all sorts of things. Getting out too early, not putting a trade on, getting stopped out like you did today. You got frustrated with my weather forecast last month.
I totally get the appeal of trading beyond just making money because of the adrenaline rush and challenge. Competing with the market and competing in other things. It's in our DNA. Nothing wrong with that.
There's a lot of much better chess players than me and even older than me that love to compete in chess tournaments. Way too stressful for me. I enjoy just coaching young people and getting them in the chess tournaments because its a wonderful way to develop their minds and essential life skills.
Extraordinarily rewarding endeavor.
Anyways, I understand the competitive element to trading better than anybody. One has to decide if the reward is worth the stress and frustration. Everyone can answer that differently based on what they are getting out of it and what its costing them.
I am too content with the enjoyment of doing the analysis and sharing it here. I honestly think that if MarketForum didn't exist, I would be bored and spend more time trading. Same analysis, same weather except needing a good reason to justify it that much time on it.......although I enormously love analyzing everything and anything to death and this place is an opportunity to share it.
Anyways, I still suffer exactly what you are suffering from right now, tjc.......traders remorse even though I'm not as active as before.
It usually takes me a day to get over it on a trade I should have taken or got out to early on.
There are 2 things that fix it.
1. If the market reverses and suddenly my bad decision looks like a good decision.
2. TIME! The quicker I accept imperfection and move on, the less time needed to get over it. The bigger the missed trade, the longer it might take.