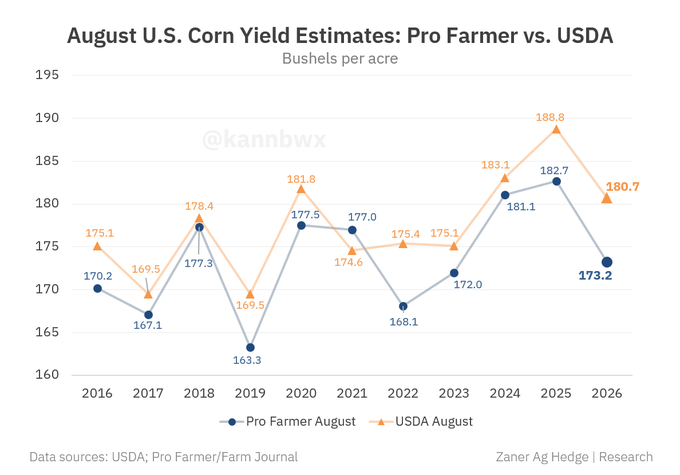
Pro Farmer projects U.S. corn yield at 173.2 bpa, well below USDA’s 180.7. PF corn yield has now come in below USDA in 16 of the last 20 Augusts. The 7.5-bushel PF-USDA shortfall is the largest for August in at least 20 years.
++++++++++++
·8-22-26, metmike: PF has only predicted a higher corn yield vs the USDA 1 time in 20 years, that being in 2021. So they get it right in the years when the USDA was too high and they get it wrong, sometimes REALLY WRONG when the USDA was not high enough in August but PF clearly had a serious bias for estimates that are TOO LOW.
I did a comparison between final USDA yields and PF yields below and got this.
YearPF forecast compared to final yield
2025 -3.8 bpa
2024 +1.8 bpa
2023 -5.3 bpa
2022 -5.3 bpa
2021 -.3 bpa
2020 -5.8 bpa
2019 -4.2 bpa
2018 -.9 bpa
2017 -8.9 bpa
2016 -1.8 bpa
In 6 out of the last 10 years above(60%), they were more than 3.5 bpa TOO LOW with their final yield estimate. 4 of those times(40%) they were more than 5 bpa TOO LOW.
This year, they are predicting a -7.5 bpa drop in yield compared to the August USDA. They probably have the trend DOWN correct but history and their huge bias for almost always being too low (90% of the time) with their corn yield suggests they are too low again.
Clearly, their crop scouts have a problem with underestimating corn yields!!!! With beans on the other hand they don't appear to have the same bias.
++++++++++++
·8-22-26, metmike: PF has only predicted a higher corn yield vs the USDA 1 time in 20 years, that being in 2021. So they get it right in the years when the USDA was too high and they get it wrong, sometimes REALLY WRONG when the USDA was not high enough in August but PF clearly had a serious bias for estimates that are TOO LOW.
I did a comparison between final USDA yields and PF yields below and got this.
YearPF forecast compared to final yield
2025 -3.8 bpa
2024 +1.8 bpa
2023 -5.3 bpa
2022 -5.3 bpa
2021 -.3 bpa
2020 -5.8 bpa
2019 -4.2 bpa
2018 -.9 bpa
2017 -8.9 bpa
2016 -1.8 bpa
In 6 out of the last 10 years above(60%), they were more than 3.5 bpa TOO LOW with their final yield estimate. 4 of those times(40%) they were more than 5 bpa TOO LOW.
This year, they are predicting a -7.5 bpa drop in yield compared to the August USDA. They probably have the trend DOWN correct but history and their huge bias for almost always being too low (90% of the time) with their corn yield suggests they are too low again.
Clearly, their crop scouts have a problem with underestimating corn yields!!!! With beans on the other hand they don't appear to have the same bias.
++++++++++++++
Pro Farmer projects U.S. soybean yield at 53.3 bpa, above USDA’s 52.7. PF soybean yield has topped USDA in just 8 of the last 20 Augusts. PF’s 53.3 is its second-highest yield forecast on record, behind 54.9 in 2024.
++++++++++++++++
8-22-26: metmike: 2 years ago, PF was +.7 bpa HIGHER than the USDA and had their highest/ MOST bearish projection in the last 10 years at 54.9 bpa.
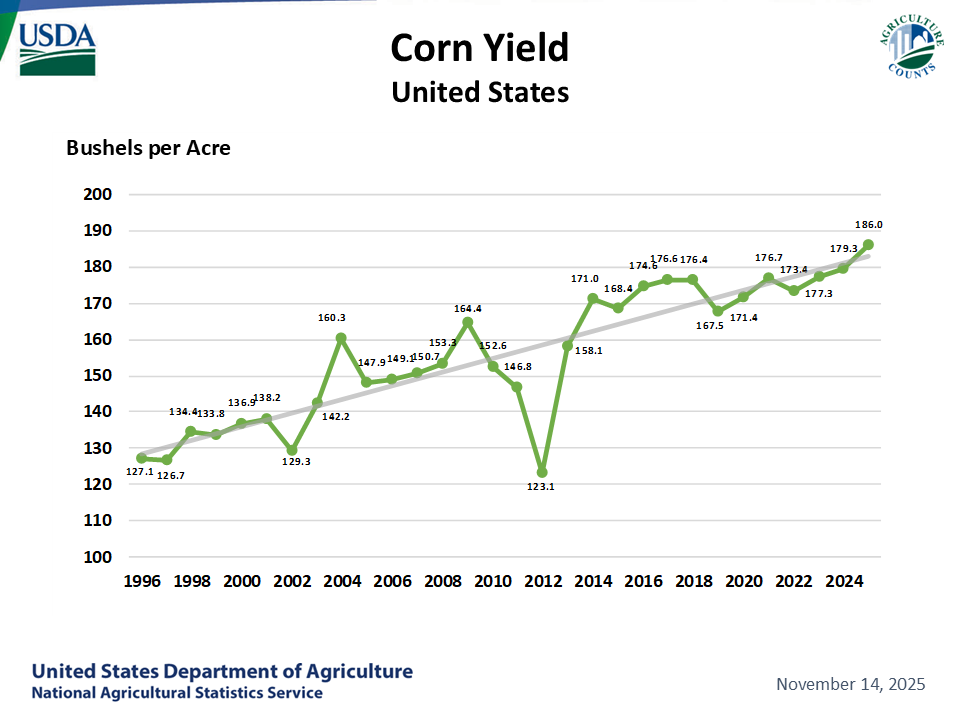
Turns out that the complete opposite happened. We had a dry finish to the growing season with the biggest revision DOWN for the soybean crop in history on the January 2025 USDA report and final yield of just 50.7, so PF was a whopping +4.2 bpa too high!!!!
Their yield forecasts above are just compared to the August crop report NOT the final yield, which is what matters the most. I would be MUCH MORE interested in seeing that metric to see if they got the trend/change in the right direction. In 2024, it was in the WRONG direction and wrong by a lot.
I would be very interested in hearing cutworm's perspective because I have not done a detailed analysis of ALL their work. My intentional cherry picking above was not meant to represent ALL their work, it was in fact intentional based only on the 1 year that stands out because it was such an anomalous outlier NOT a fair assessment of their 10 years above. It was meant only to demonstrate how a crop estimate this late in the season can still be off by 8% and in the WRONG direction.
To be fair, again, it was hot/dry for the last few weeks of the soybean pod filling in 2024 which took away yield AFTER PF did their crop estimate. Even the USDA struggled to get it right as late as the November 2024 crop report!
cutworm, bowyer, jim and others remember exactly because they were following it close!
You and I agree on most things when it comes to markets but on this one we are almost identical.
I still post our comments from late in the 2024 growing season during the flash drought about the crop being negatively impacted. The USDA didn't catch up to that until the January 2025 report!
With that being the case, it's impossible to expect the USDA to dial in recent changes from changing conditions with accuracy.
They have more information than that rest of us and their weekly crop ratings/conditions seem to do a wonderful job at capturing changes from the previous week.
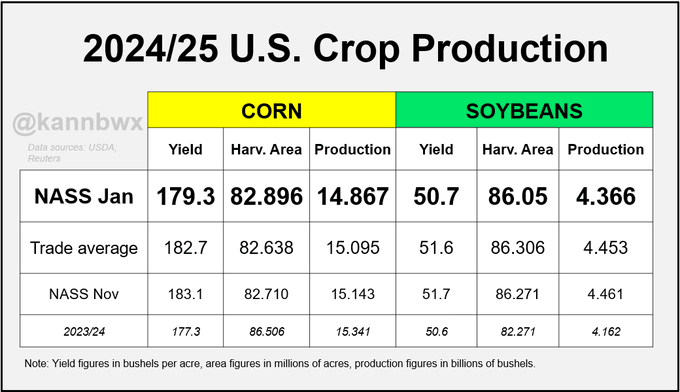
U.S. harvested corn area came in above expectations but soybean acres came in below. Both crops saw yield reductions far larger than analysts predicted - both yields were below the range of analyst estimates.
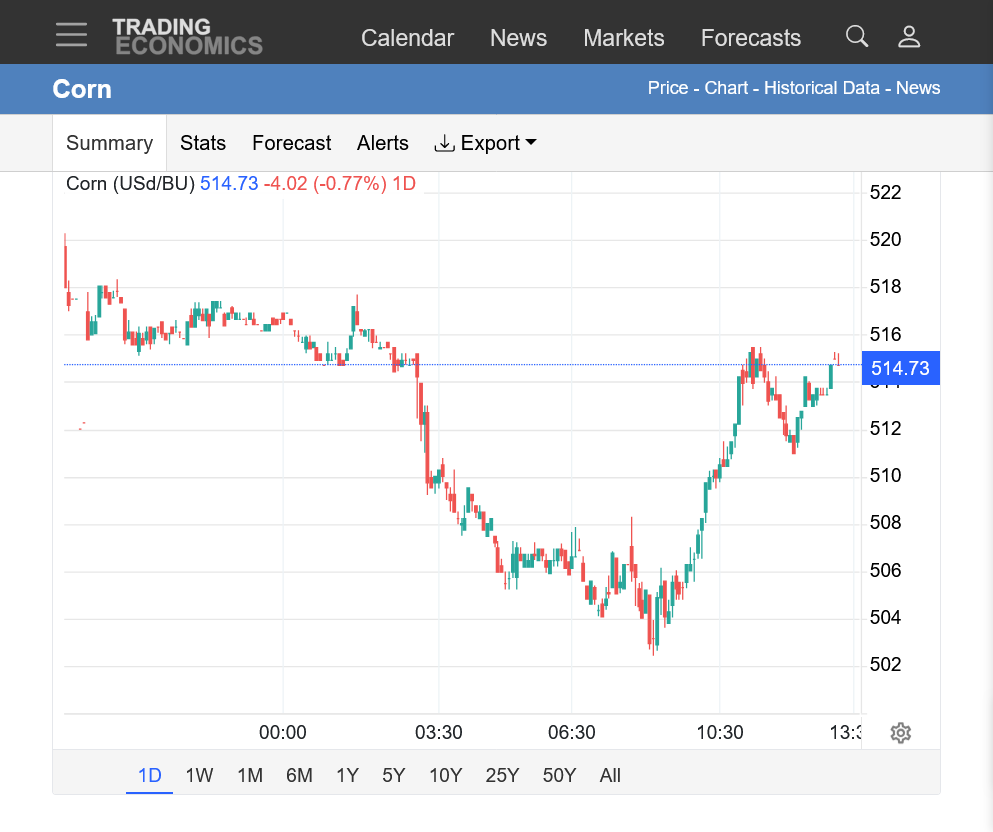
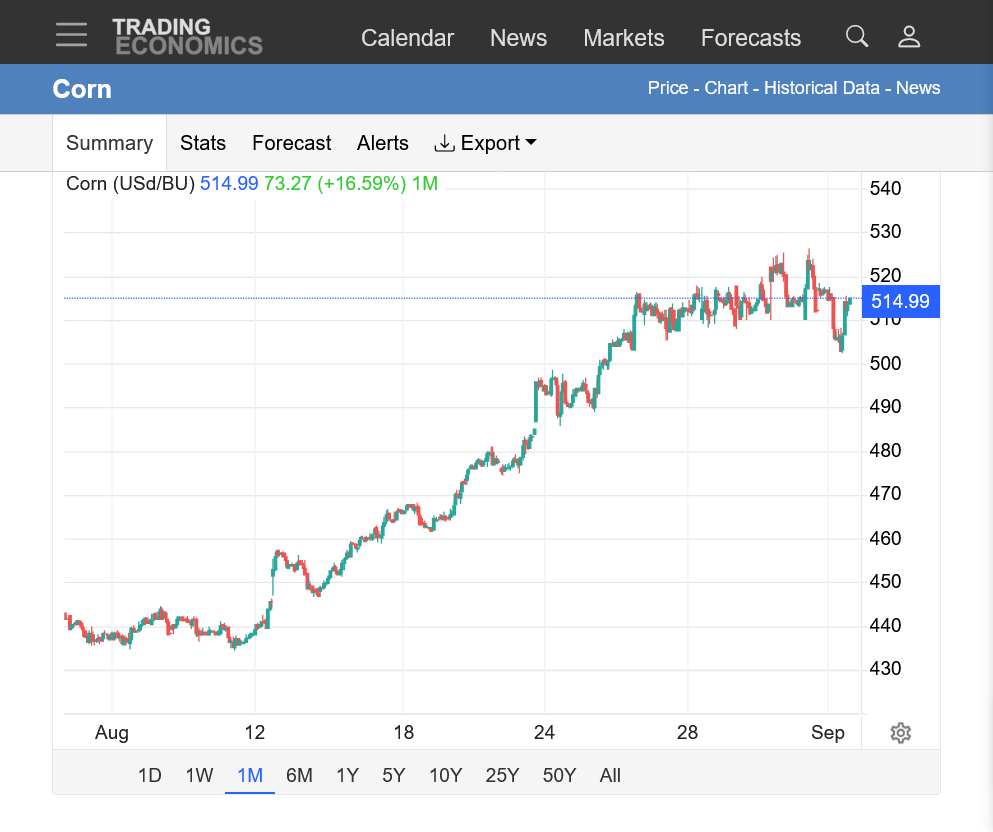
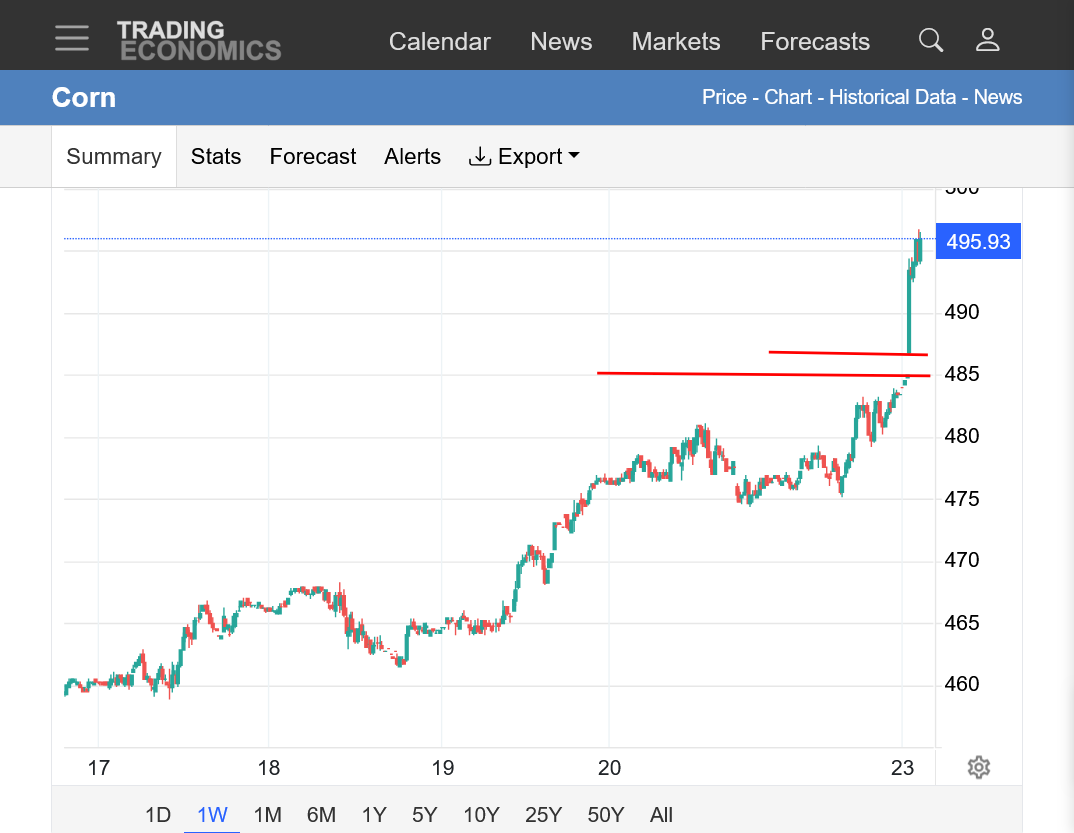
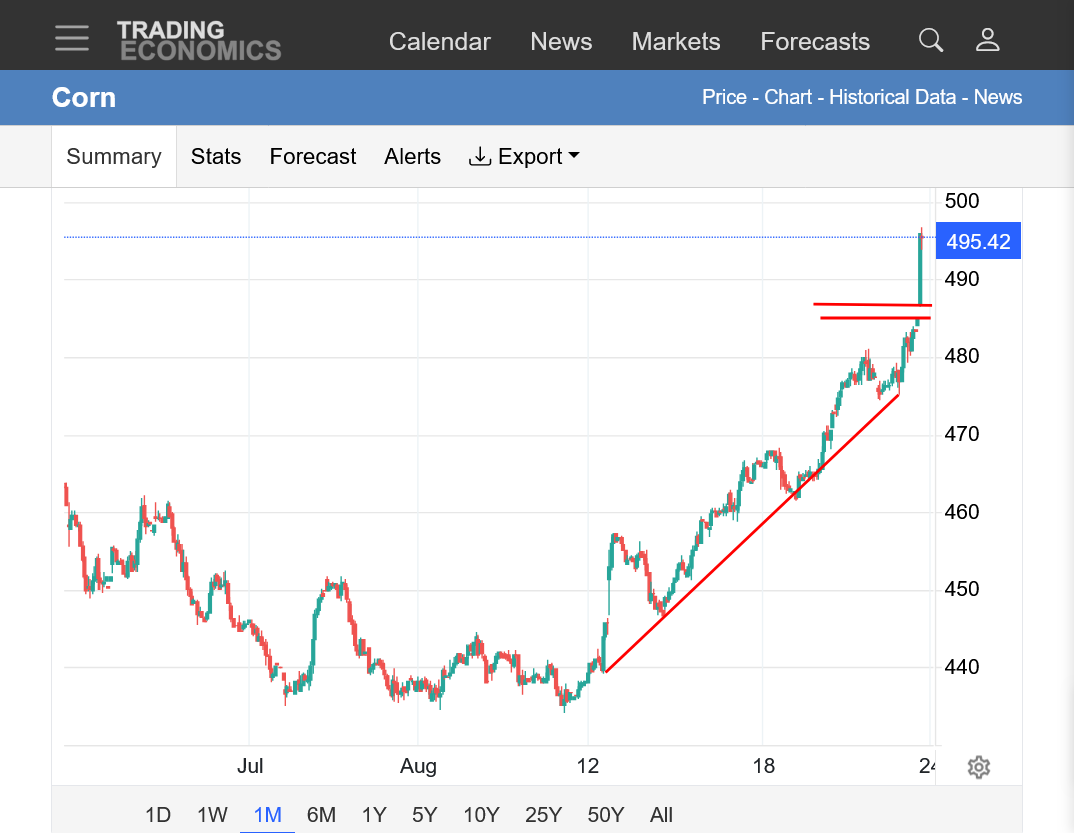
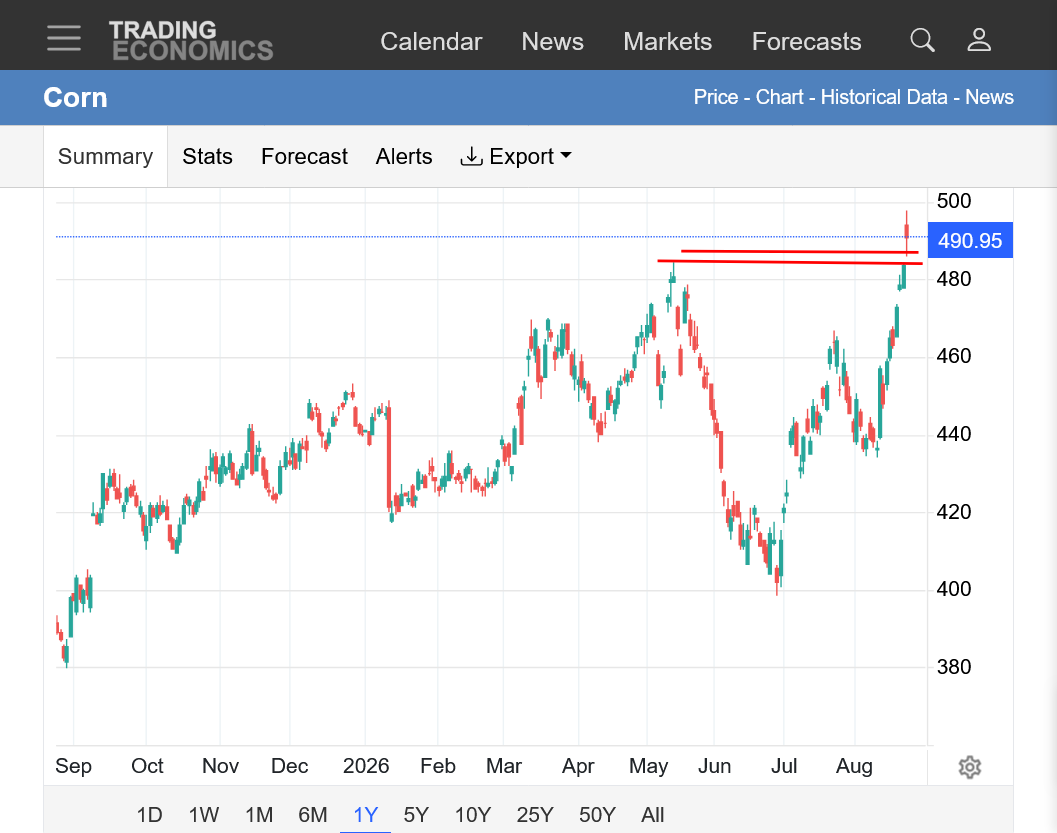
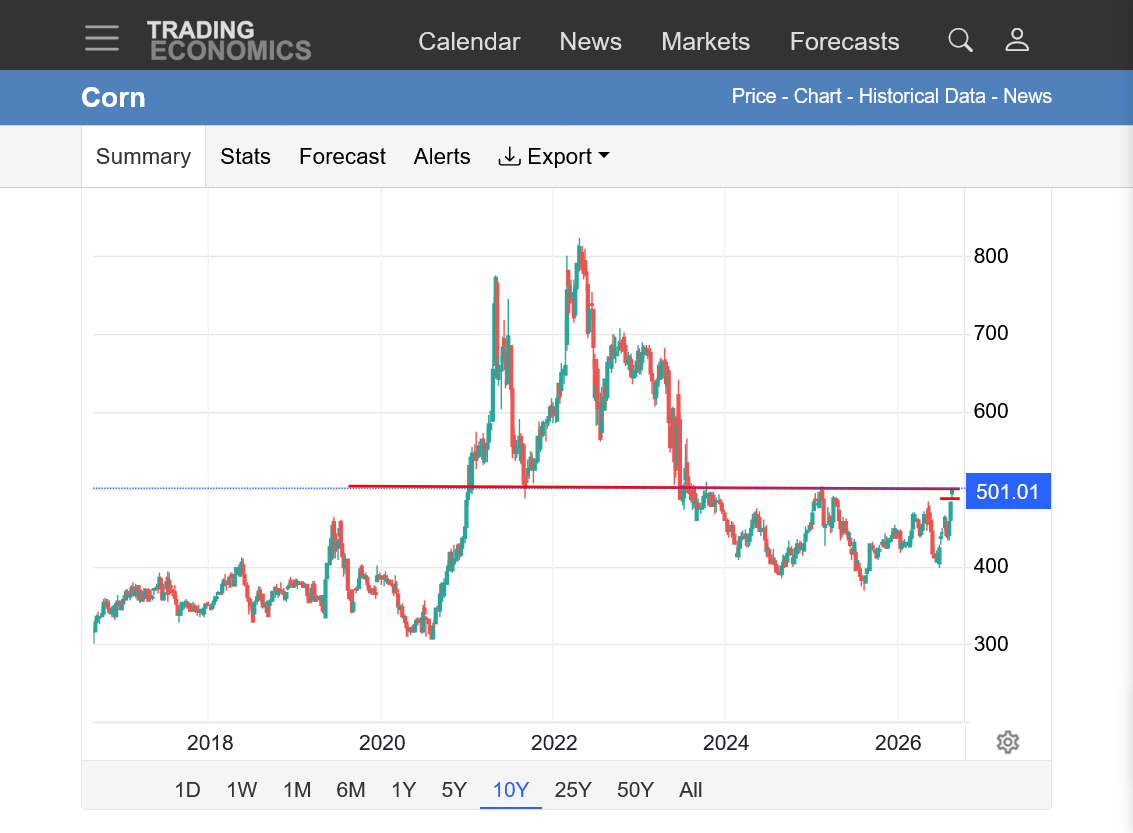
2. 1 month: Bullish upside break away gap higher after steep uptrend.
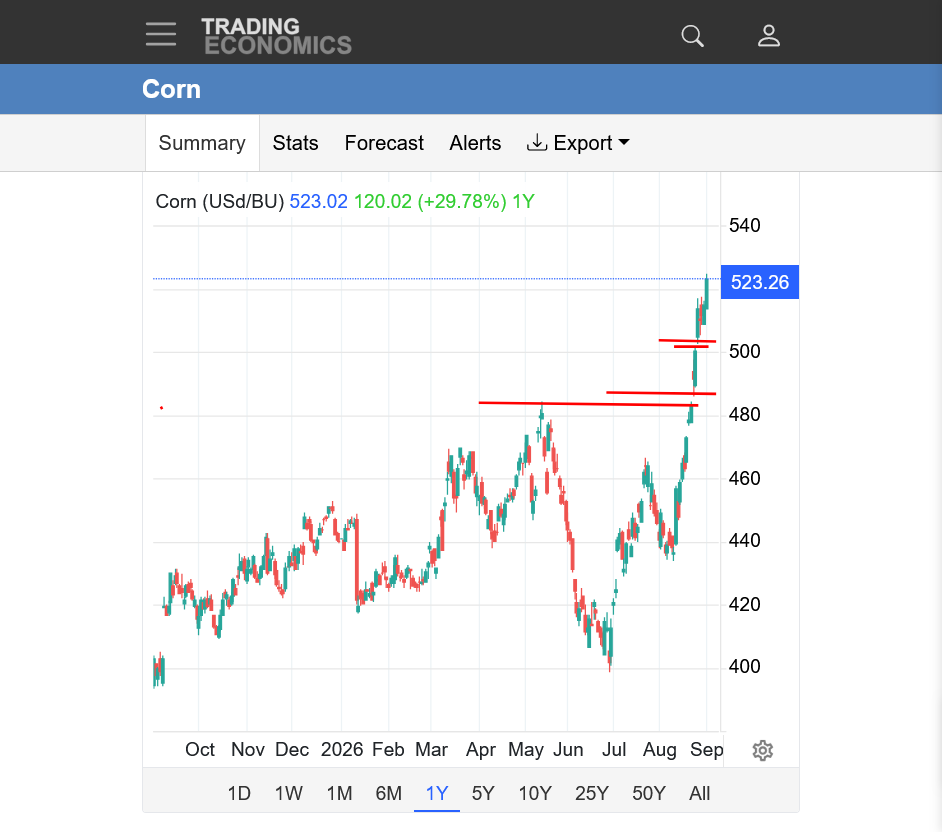
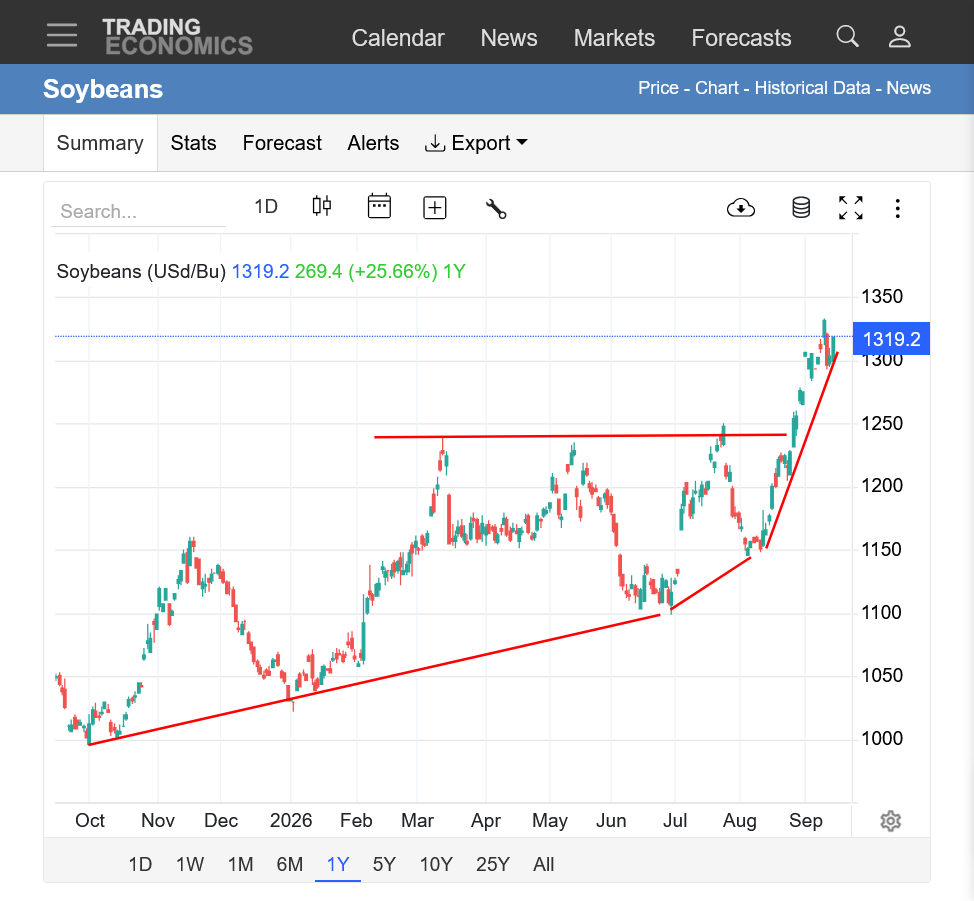
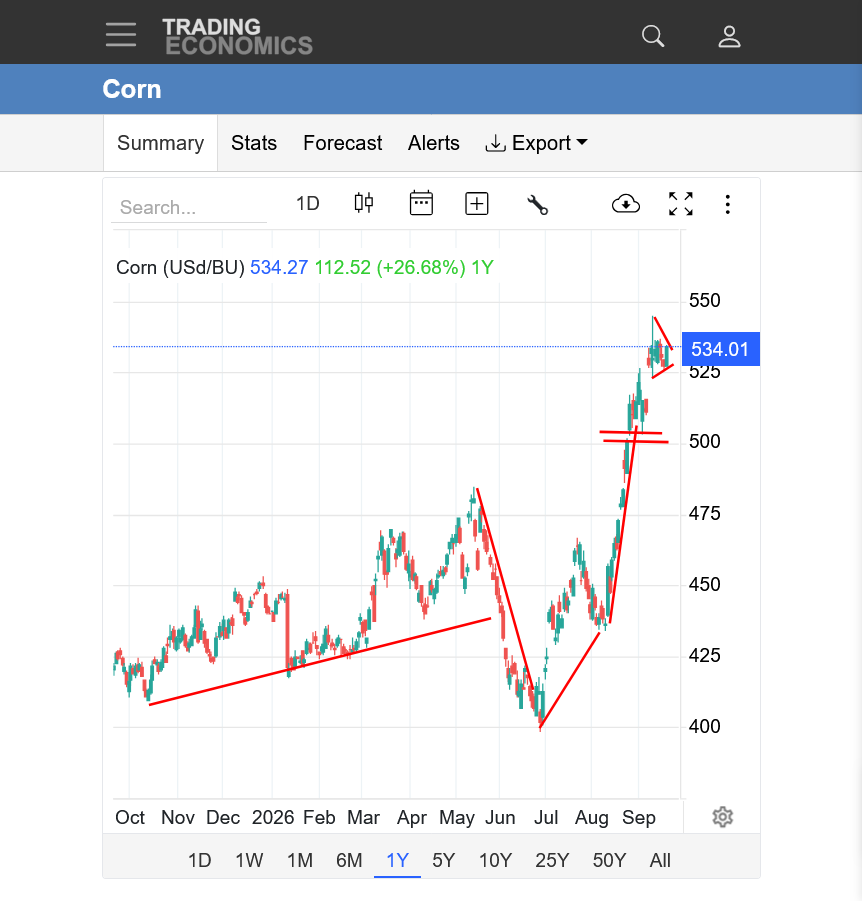
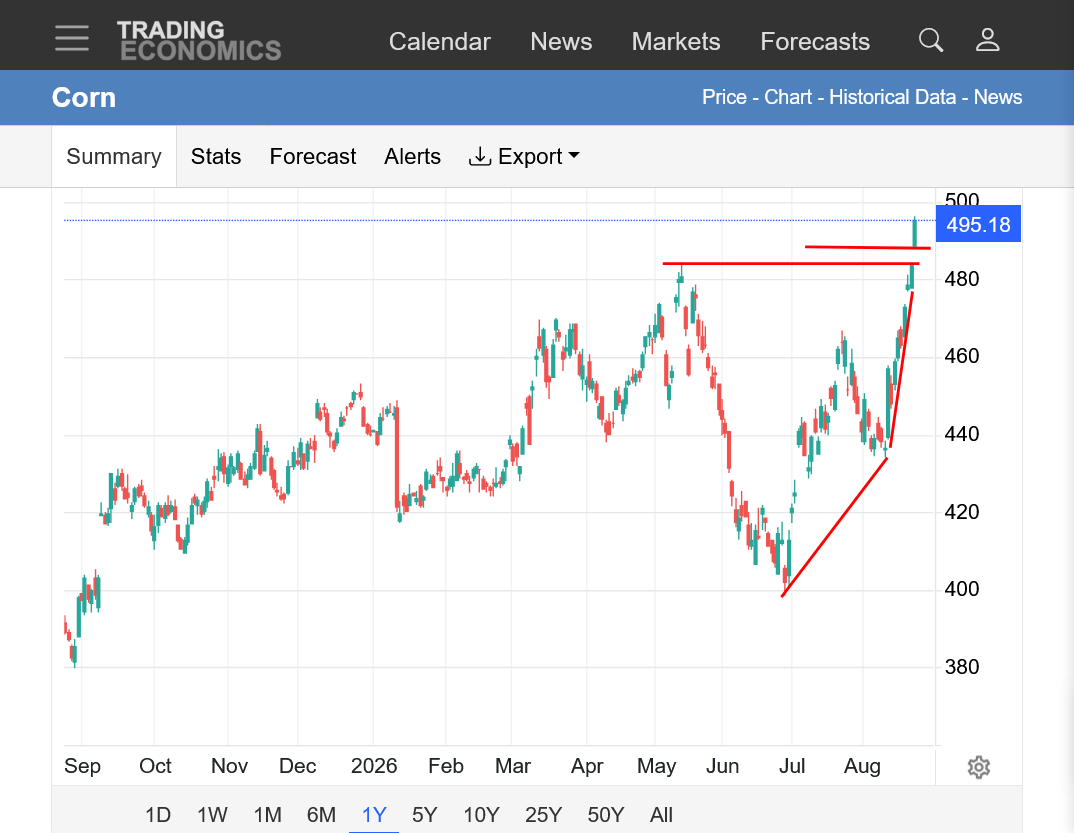
3. 1 year. Major late June low from intense heat in the northwest Cornbelt. Accelerating uptrend!!! Bullish upside break away gap. Highest price of the year.
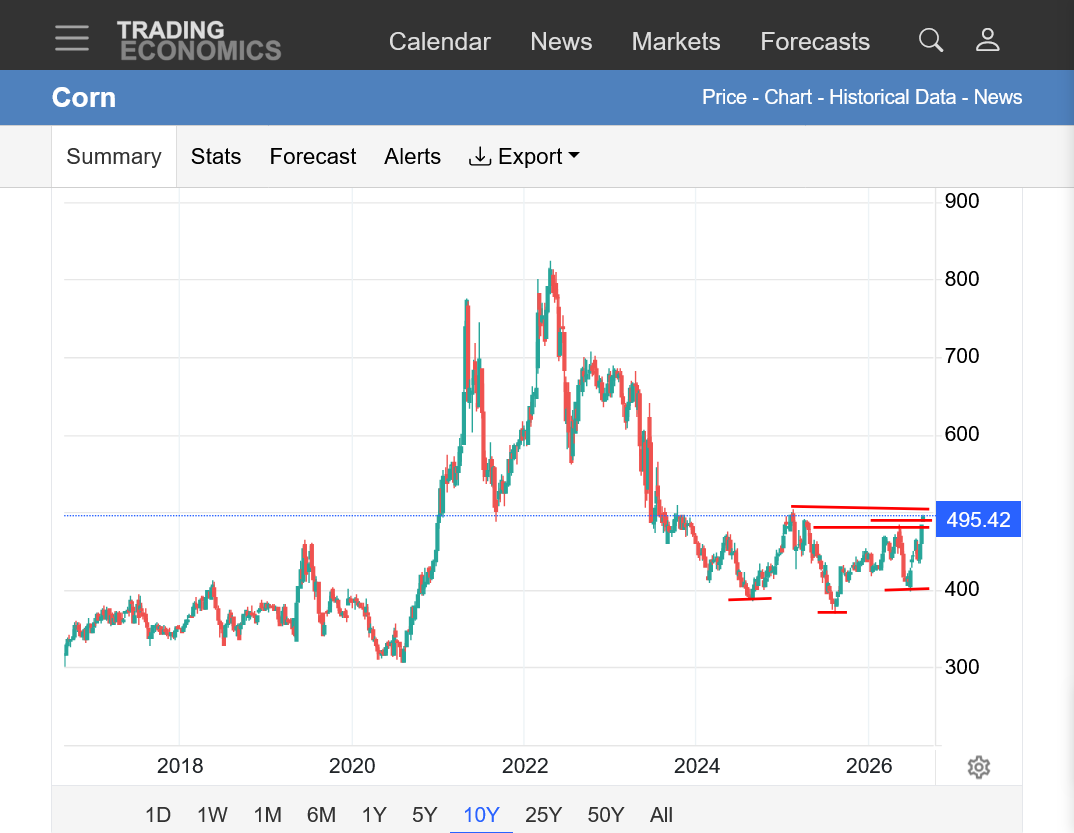
4. 10 years: Inverted/inverse head and shoulders bottom, with bottom and 2 shoulders on either side. Was this a break out above the neckline?? Or is there 1 last layer of resistance to overcome???
5. I've been very bullish corn the past 2 months from weather(supply) AND record demand/exports.
IF the gap holds all day I would consider it a measuring gap. The measurement would take dec corn to 560 ish. Which is also resistance from the July 22 continuous chart.
I think that the way to consider the pro tour yield estimates is to see what the market reaction is, in this case bullish price. Also it should be compared to the Aug and Sept USDA reports. Not to final USDA numbers.
We could be getting to 10% carry out, which historically price would be more than $5
Update: The graph from this site above has it wrong(which happens a lot but it's a free site to post here). Even in the Sept contract, the top of the gap has held and provided support with no filling.......so far.
Added: SX is getting crushed. -18c
12:45pm: CZ volume is a whopping 423,000 contracts. Sept is and impressive 130,000 contracts.
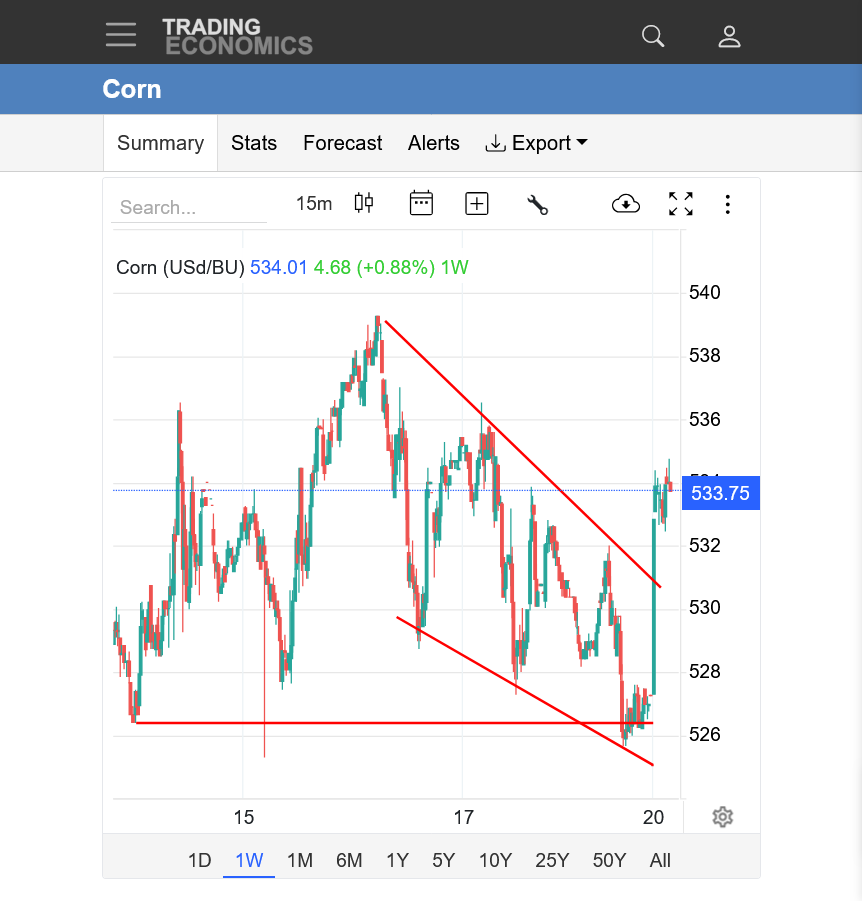
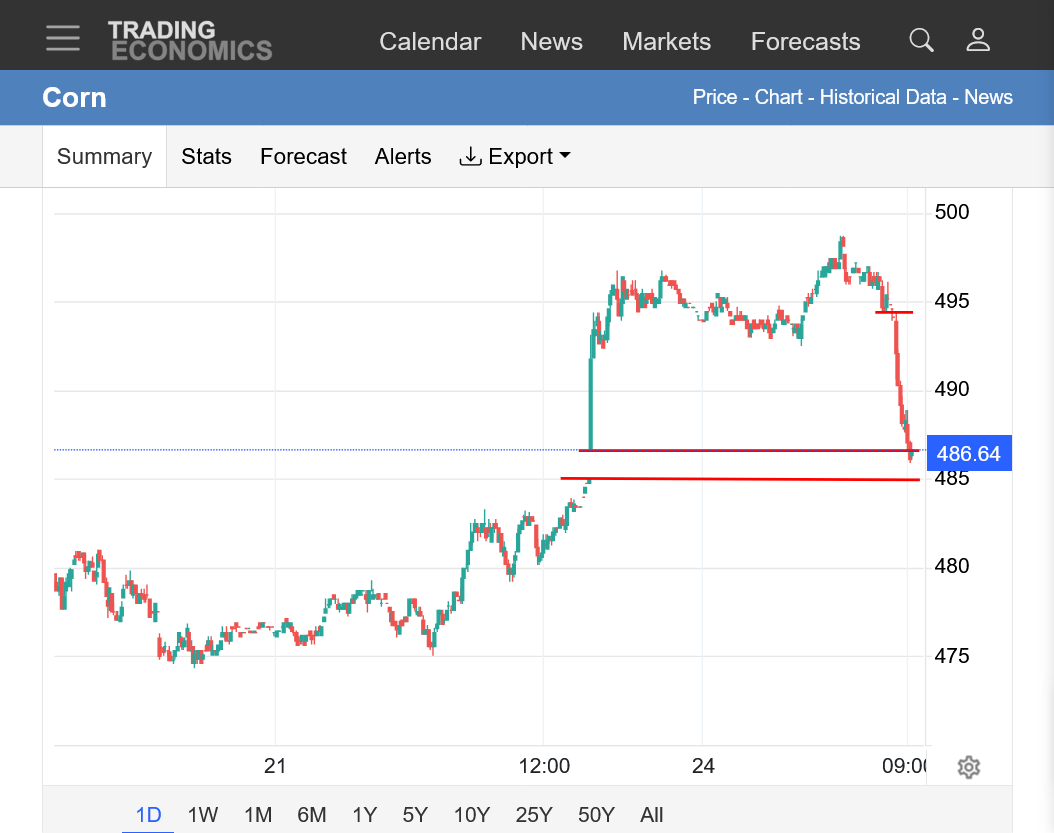
We couldn't even get down to the top of the gap higher before buyers jumped in just ABOVE the gap. This resulted in a big bounce to new highs for the DAY session but not the NIGHT session, now we are back in the lower half of the range.
Upside exhaustion gaps at a top like this are most powerful when they are filled in the first day after the gap higher. The longer it takes to fill the gap, the less powerful as an exhaustion.
This is why: Today, approaching the top of the gap triggered massive buying that pushed prices to new day session highs. That is the COMPLETE OPPOSITE of the buying being exhausted.
That's not saying that the gap will be not be filled tomorrow or some later date. It's saying that this particular formation did NOT serve as a classical "gap and crap" reversal. Things can change with news and the buying can run out at these higher prices and the approach of harvest and actual harvest could cause prices to drop lower than the gap with those items being INDEPENDENT of the gap and crap(failed initially) signal.
++++++++++
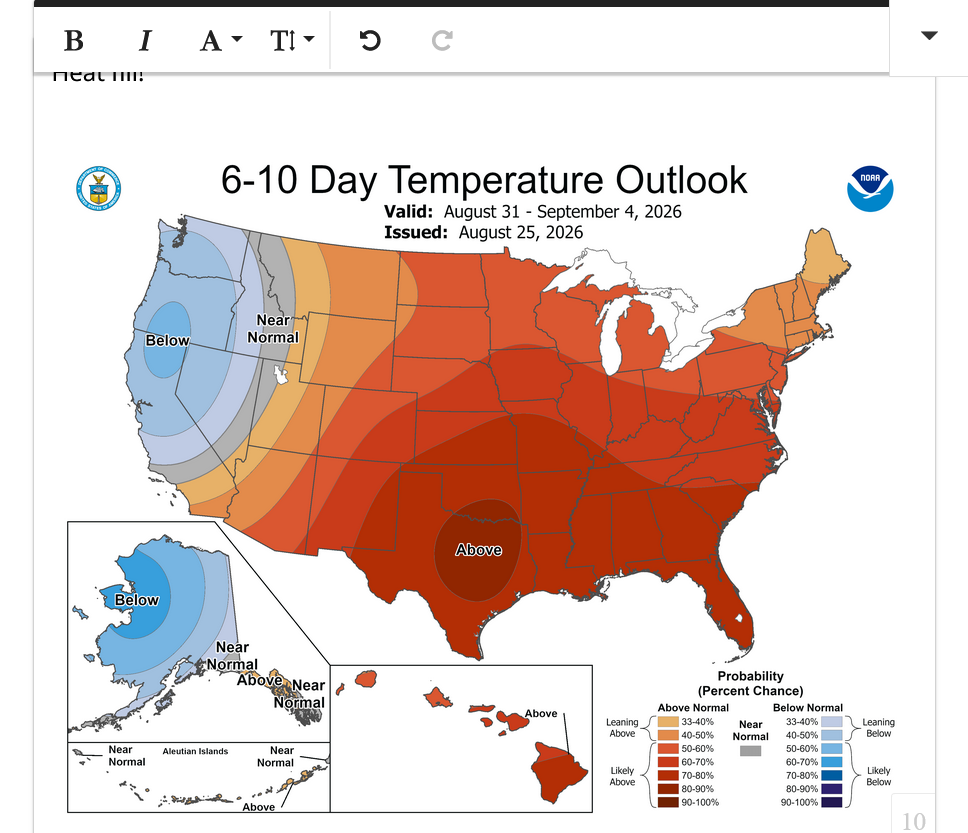
With heat fill and rapid dry down in the South this month, I imagine that harvest will be early and soon.
++++++++++
We're closing above the open and above the gap higher but in the lower part of the range so something like a surprise bearish crop condition report this afternoon could close the gap on Tuesday/tomorrow..........just like a bullish report could generate more buying. However, as a market gets higher and higher priced, the amount of bullish news needed to generate new buying has to keep EXCEEDING the old news.
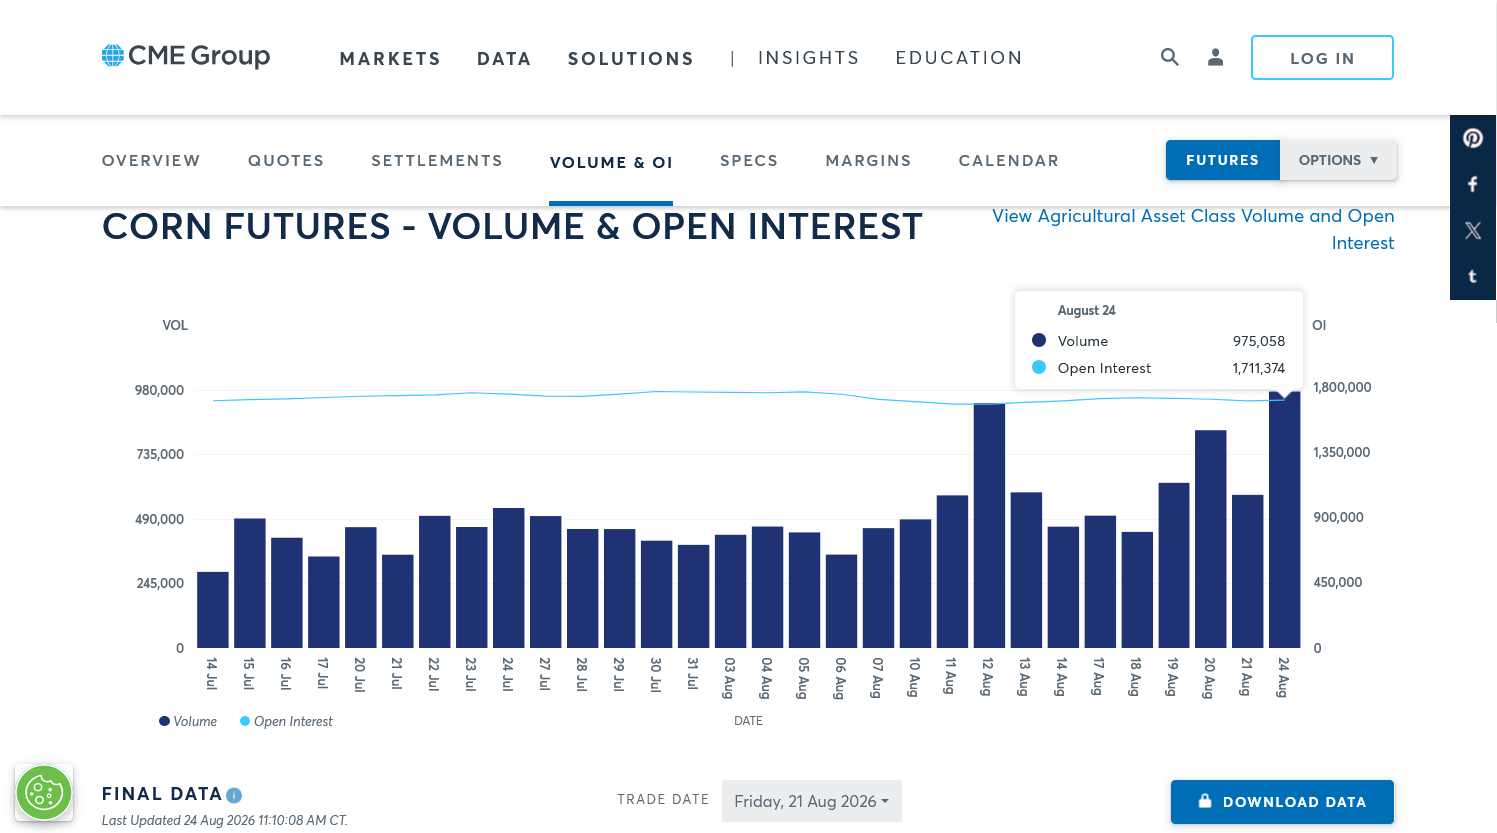
Volume today was over 476,000 for just the December contract. I don't follow this metric every day. Maybe cutworm does.
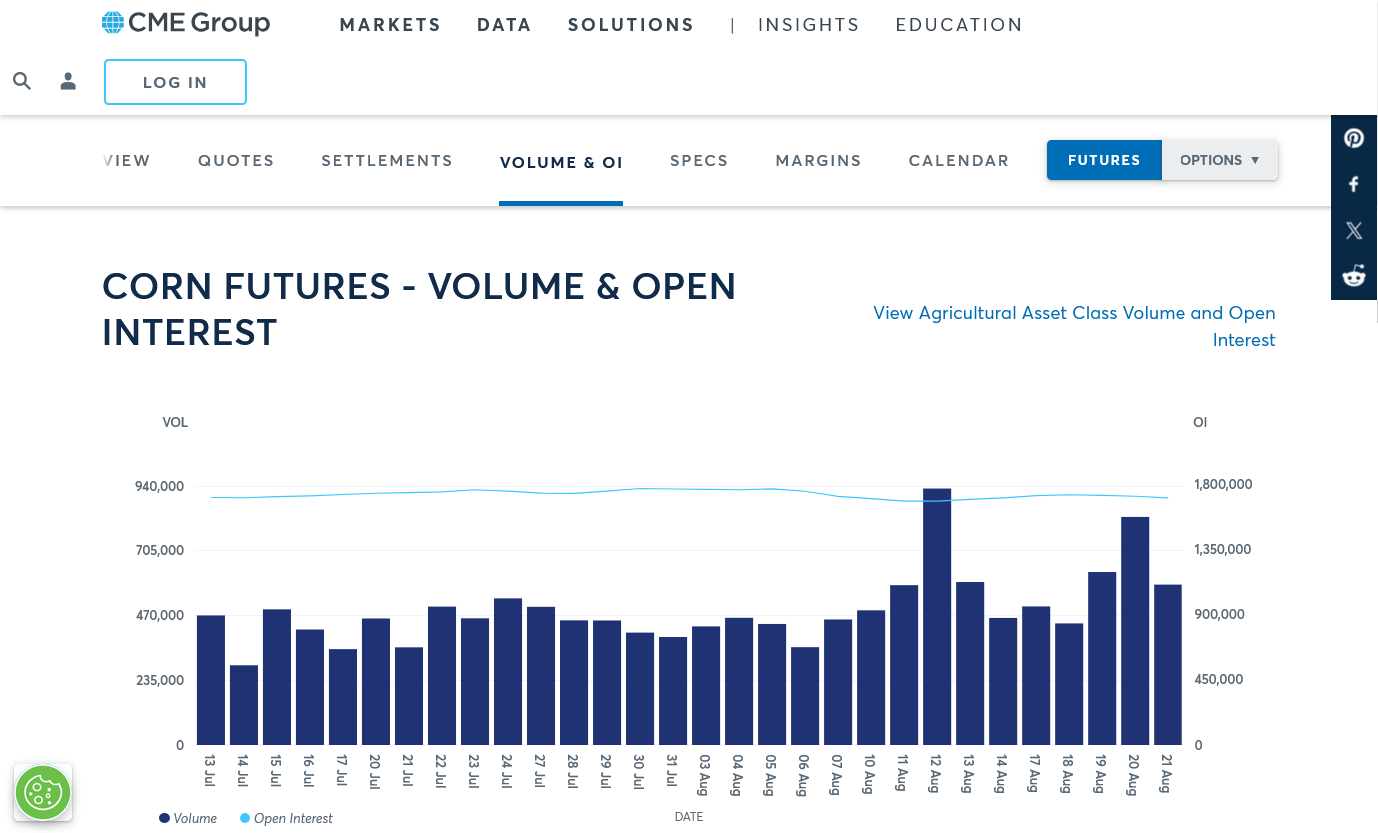
This is the data for TOTAL volume for all contract months (December is easily the highest). It will be interesting to see where today clocks in. For sure at the higher end but not the highest, which was August 12th because of the USDA crop report:
Friday's volume in December corn was 279,000 and pretty active but we blew that away with 476,000 today.
I'm going to guess that total volume was close to 900,000 today (or more) compared to the 931,069 high in volume on August 12th on the bar graph above that only goes back to July 13, 2026.
+++++++++++
As mentioned previously, the source below makes a lot of mistakes when they graph prices but I will correct them verbally.
1. The low today did NOT get as low as the open and low last night as it shows here.
2. They have a red candle that indicates the close was lower than the open. If this was just the DAY SESSION that would be true. The night session traded almost half the volume and CAN'T be ignored! So their red candle should be a green candle with the bottom of the body being the bottom of the stick/open last night.
Does that matter? You bet it does if you are using candlesticks to graph prices!
The red candle they show looks potentially ominous with a close below the open after a gap higher and partially filling the top of the gap.
The correct green candle, showing the close ABOVE the open and the entire gap holding is not ominous but the close in the bottom half of the range is a potential warning signal of lost momentum.
Sometimes I have a hard time following you when you are constantly changing things.
Now you're short from 511 instead of 518 with no explanation.
With regards to sell stops at those prices.
Bar chart is telling you where the sell stops are? That link does not work. You're assuming that since there was a low of 514.75 on Monday that many traders put their stop 1 tick under the low at 514.5?
As a technical trader that insists the charts change first and that's what you use, what technical/chart signal are you using here?
Harvest will be starting early in the South with potential harvest pressure hitting soon but recent years have featured corn going UP sharply during harvest.
Corn traded contra seasonal, going up in July because the crop size was shrinking and we've had record demand. Because prices have gone up so much recently is usually not the best reason for prices to go down but it works sometimes.
+++++++++++
This news below is adding a bit of support to corn this evening but most of the bullish news is likely dialed into the current price and the bulls might be running our of steam. If the corn fails and closes the gap Tuesday, then you were just early. If not, then you sold new highs and an upside break out.
U.S. corn conditions dropped 3 points last week to 57% good/excellent, the lowest for the week since 2023. Spring wheat harvest is moving quicker than expected, and the earliest corn and soybeans are just now starting to reach maturity.
I was short on Friday and sold more, now average 511.
As to sell stops, Barchart's 15 minute chart clearly shows spike lows that must hold.
Grains have had a tremendous run creating high RSI, over bought values, and other sell signals. No significant weather issues in next few weeks, thus I sold.
A traders #1 plan is always to minimize potential losses. I state this emphatically here because this site represents, to the best of my ability a guide to use in order to trade markets successfully for profits.
I'm not here to cheer lead or encourage people by telling them what they want to hear or read to maximize views/hits. Even if I like the person. I've traded successfully for 34 years using solid principles based on weather markets, where I have a big advantage but those same principles apply in most other markets.
Your plan, revealed with more detail today (and I greatly appreciate you sharing it, tjc) has no limits to the amount of loss that you might be taking. No mention of stop losses...........just get out on Friday.
No mention of what you need to see between now and Friday to admit that you might be wrong. Maybe that IS part of your plan but you didn't share it so I will make it clear to other readers this MUST be a part of every trading plan.
Before putting a trade on, especially one that lacks legit justification (other than prices seem overdone and the market is due for a correction) decide how much money you want to risk and stick to that.
A market that has an extremely bullish, upside break away gap higher(above all previous highs) and you being short is NOT a market to add to a loser on ...............unless you know something that the market doesn't(which is why I trade using MY weather forecasts).
Another very bullish item to the demand picture I haven't noted is the weakening dollar.
tjc,
Sorry to come down so hard on you but you are violating commodity trading 101 principles here!
Sometimes, the worst thing to happen is when we violate principles............and get lucky and make money on a trade, it makes us think that we were SMART and not LUCKY.
Then, we enter the next trade thinking that we are smarter than we are and we violate the same principle again because of the positive reinforcement from the last LUCKY trade.
I'm NOT saying this is you right here. Just mentioning what happens to all traders(including me in the past).
As I suspected yesterday, volume was incredibly high. Even HIGHER than the August 12th previous high after the USDA report.
High volume days carry an extra amount of weight, especially after key news items and at technical points.
In this case, the high volume after an upside break out to new highs from a gap higher, with the top of the gap not even tested(instead of exhausting the buying-the gap inspired ADDITIONAL buying), strongly validates the move up.
The follow thru today, closing on the highest price since 2024, near the highs just validates that gap more.
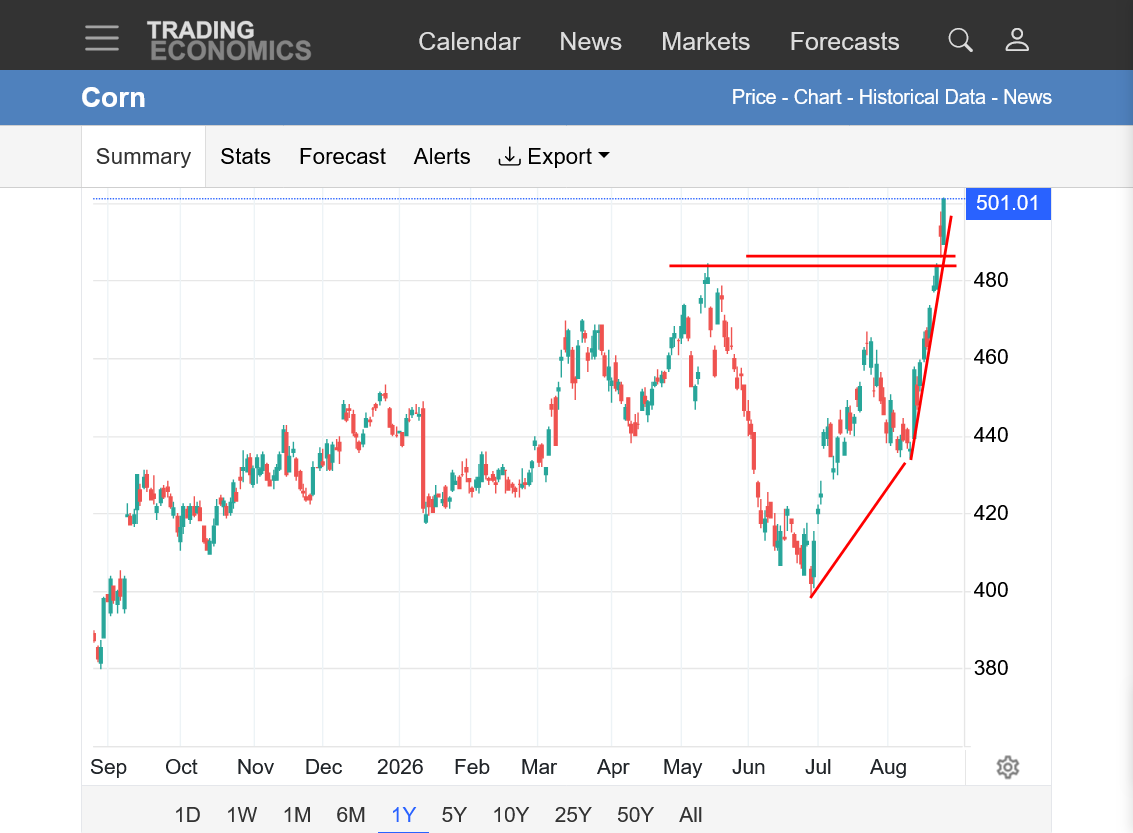
1. 1 year chart below: Accelerating uptrend from ultra bullish fundamentals hitting at the same time. Upside breakaway gap on Sunday Night has been validated by the measures analyzed on the previous page.
With the extreme slope of the move up, the upside side risk is tremendous. The close today was 1 tick from the highs and highest price since 2024.
When a move up/slope starts going parabolic/exponential, volatility gets extreme(with high volume) and you get some panic buying(to cover shorts) but also uncover producer selling/hedge selling. If the funds are convinced of prices going MUCH higher and load up, shorts will get run over.
2. 10 years: A few cents higher and this is the highest price since August 2023!
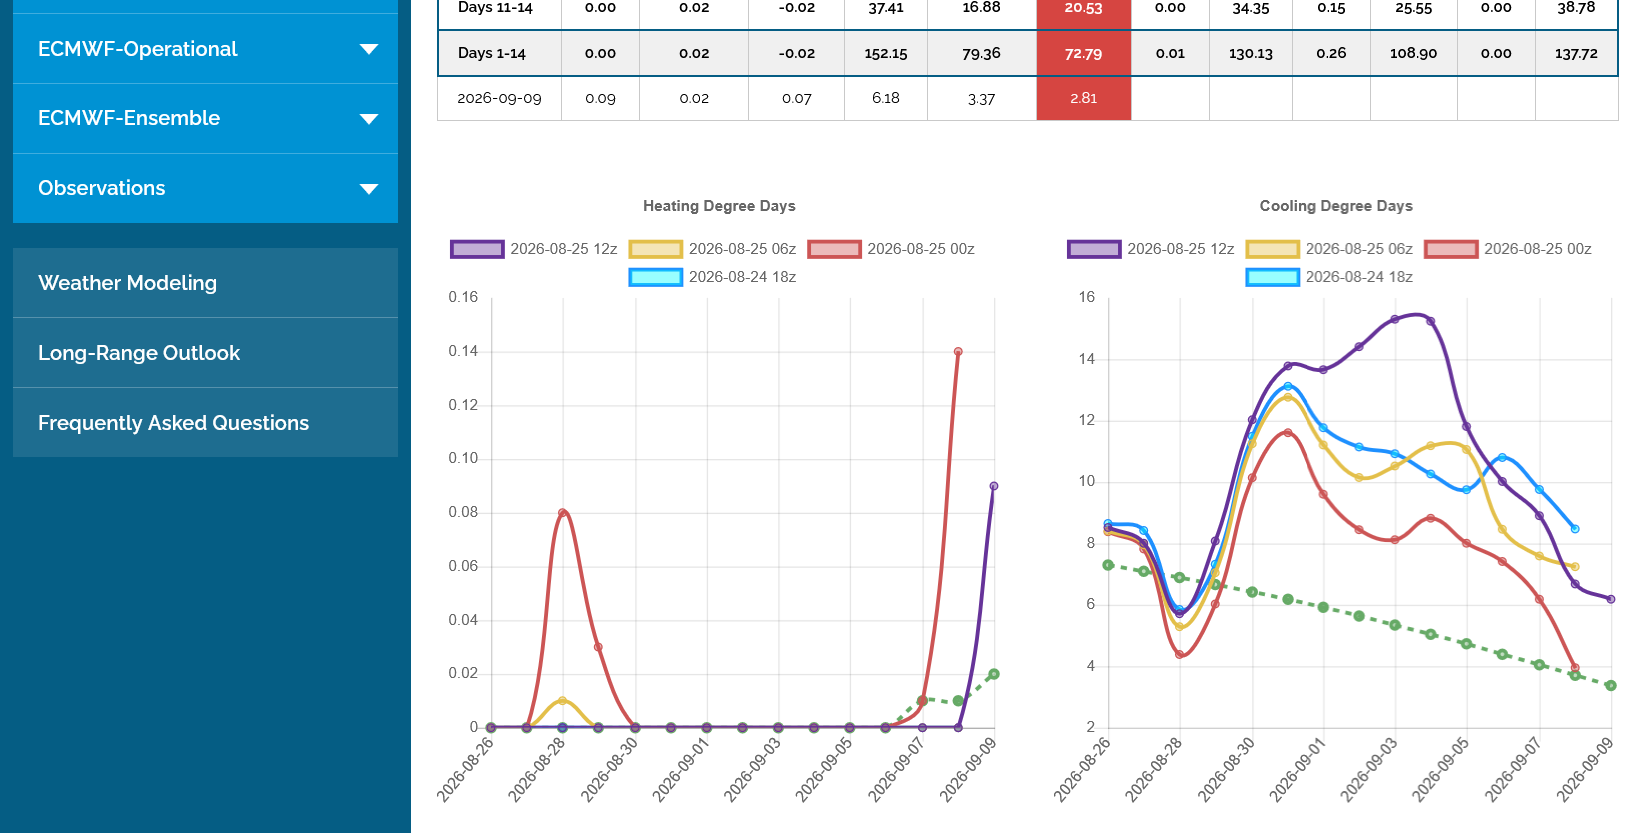
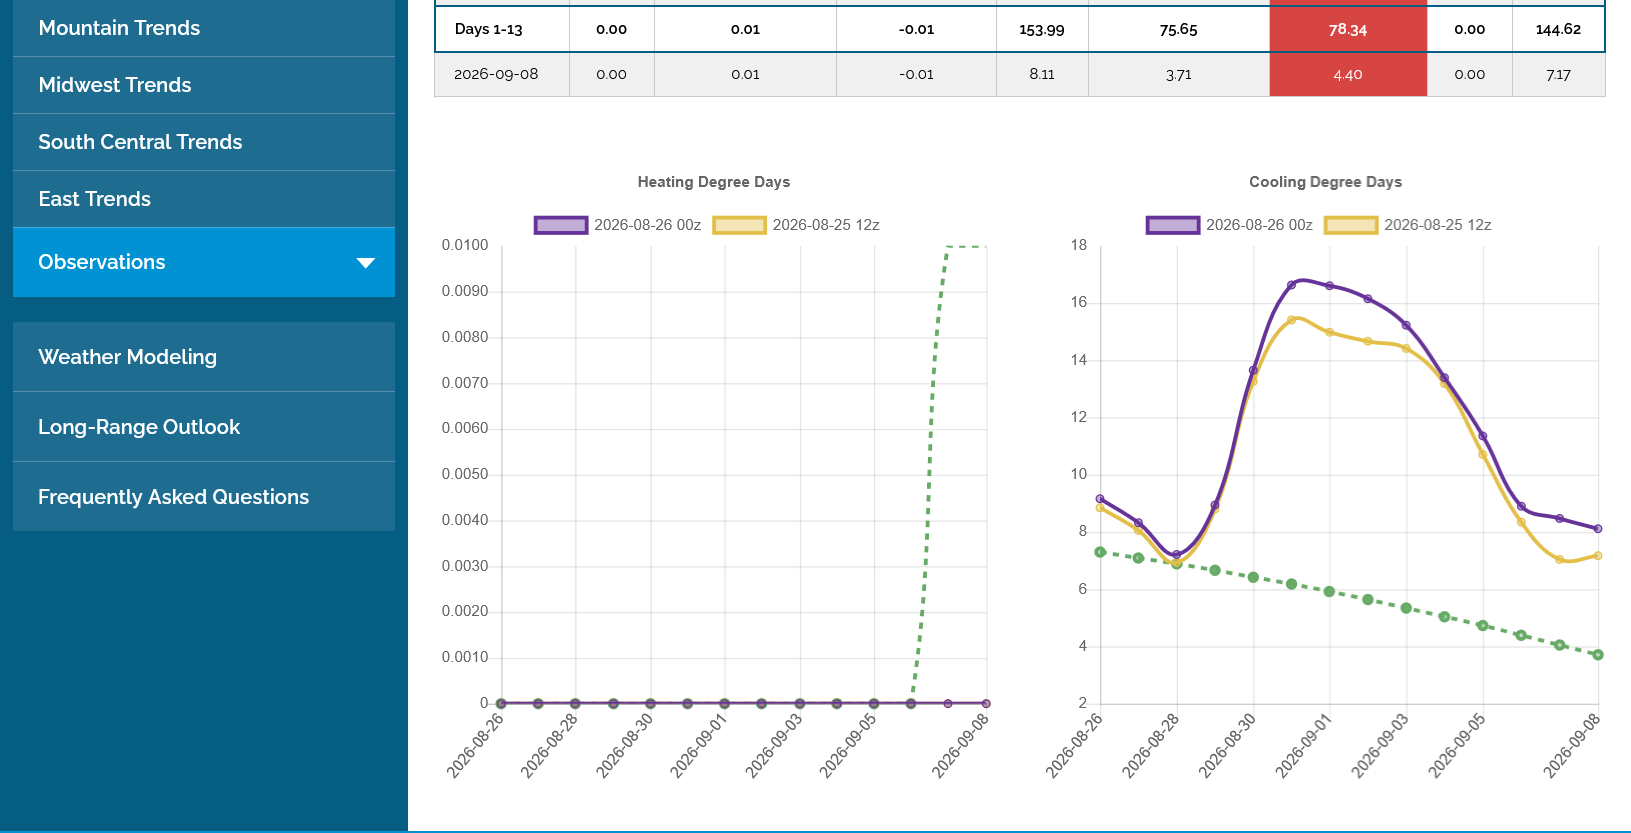
The last run of the 12z GEFS for JUST the Midwest(purple line) was a whopping +22 CDDs hotter than the previous 06z run and +44 CDDs compared to the 0z run before that(red line) which is the most I've ever seen for any ensemble model change in 12 hours!!!
Here's our best thread for explaining and illustrating this principle:
I noted that you took awhile to report it to make sure it didn't reverse lower first after hoping it would reverse lower for days..........agonizing hours and minutes of watching the losses mount.
This taps into the psyche of traders, especially those with no discipline/plan ahead of time but even those with an exact plan.
Very often, the most powerful element to how we view the trade is "what we did last".
If we made 10K on the trade but got out too early on a trade that would have made 90K with trailing stop, it can hurt almost as much as a trade that LOST 10K but would have lost 90K if not for getting out ASAP to avoid the catastrophic loss.
In fact, my best trade ever was in 1994 when I LOST half my money on the open Monday from a weekend long that featured the weather going from ultra bullish to ultra bearish......on a Monday that went lock limit down after 10 minutes of trading after the open. 10 minutes for me to get out before losing all my money +more and ending my trading career. Enough to live to trade for another day and end up making money that year.
After getting out with half the equity left and seeing the lock limit down(and half a limit lower open on Tuesday) I was celebrating and anxious to get back to the business of making money trading grains.
So I know that you are feeling a load off your shoulders here
1. The pain/stress is finally over! Of watching your trading account going lower and lower WITH NO END IN SIGHT, wishing like hell that we never put the position on and hoping it would reverse lower but being AFRAID to get out because of an even bigger fear that the market will reverse lower right after we get out. MARRIED TO THE POSITION with flawed, emotional thinking driving our thoughts. Every time the market moves slightly to reduce the crushing loss, it is positive reinforcement to feed our hope, only to be crushed when it resumes going the way it was destined to when we put on the EXACT WRONG trade. Watching a trade like this for days is emotionally draining. An hour can feel like an eternity.
2. Getting out, even with a huge loss will always feel good if it avoided an even MORE HUGE loss. When we are extremely attached emotionally to a position, whether it was making or losing money, after we cover that trade we usually continue to track it very closely.
Instead of watching the actual balance in our account and that trade change every second based on the last tick while the market is open computed by our broker/platform we keep track in our minds.........
Suddenly, the initial metric of what we made or lost being set, is not as important. Now we are measuring a new metric based on WHAT WE DID LAST which is changing fast and determining whether our last action was genius or dumb.
This is what it does to our minds. We compute the CHANGE since we got out. For instance, if I was still in, I would be behind an additional -X amount. An additional -2X amount, -3X amount. Yippee for my psyche!!!! The stress from #1 is over and even better, I DID THE RIGHT THING BY GETTING OUT!
Then, there's the absolute WORST THING that can happen and fear of this happening keeps us in really bad trades much longer than they should be. After we got out, the market reverses in our direction. OMG! I was right all along and got out at the worst place because I couldn't handle the stress any more! If I was still in, I would only be behind X amount. I took a devastating loss AND was right all along or picked the WORST time to get out. That one will linger AND GROW for as long as the market we just exited, keeps going in the direction that you were hoping for before exiting.
That thinking impacts most traders. For sure me. The sooner we stop torturing ourselves from bad decisions and instead convert that into a learning lesson that becomes part of our future trading strategies, the sooner we can apply that. Rationalizing or justifying a bad trade for X, Y and Z reasons is avoiding the accountability that allows or learning lessons.
For instance, if we put on a trade that violated reasons A, B and C because of our wishful reason X and want to use reasoning that justifies reason X instead of being honest we LEARN NOTHING.
The worst thing that can happen to traders starting out is violating solid trading principles but getting lucky and interpreting the LUCK as SKILL.
The best thing for a beginner trader is often to LOSE MONEY(not all of it) and learn lessons about what NOT to do to apply in all their future trading.
This late season heat wave with no rain will be horrible finishing weather and take away a few bushels in several Cornbelt states from heat fill of kernels in corn as well as poor pod filling weather for beans in some places.
With September starting on Tuesday, the corn crop is made but late heat fill will take a few bushels away in some spots.
The beans were planted early and flowered early but late pod fill will surely be detrimentally impacted by the hot//dry finish into early September.
However, this has been known for over a week and the growing season is running out, so adding another week of hot/dry can no longer keep the bull going by itself.
There are other bullish elements that might take over. The approach of and early harvest often puts pressure on the beans but each year is different!
Stone X typically releases its September crop yield estimates during the first week of September, usually on the first or second business day of the month. [1]
Corn exports continue to be incredible and at record levels!
Karen Braun@kannbwx Last week's U.S. corn export inspections topped trade estimates, setting another record high for the week among 40+ years of data. Mexico was the top corn destination at 34% of the weekly total, while the EU took 15%. Soybean inspections fell short, with no cargoes to China.
2012 is back in the mix AGAIN as fund buying in U.S. grains and oilseeds continues accelerating. My Sunday newsletter covers where things may stand now, the risks and a corn detail many may be missing. If you're not signed up yet, now's the time. See the link in my profile.
#CORN. Managed money net +376,513. The extreme-long line is +357,143. Twelfth time in twenty years. A long that size has to be fed. Fresh export business, a yield cut, a South American problem. Something new every week, or the length starts looking for the door on its own. Bullish news that only confirms what is already priced does not feed anything.
+++++++++++++++
metmike: Fund buying the past 2 months based on bullish weather and record demand for corn was responsible for most of the contra seasonal rally. With funds already loaded with record longs in September, now what happens? The last(only) time funds were this long at this time of year, 2012 they liquidated just over half that position the rest of the year.
Each year is different and this one will be different too!
U.S. corn conditions held steady last week, though soybean ratings dropped 2 points to 58% good/excellent - the week's worst in three years. That marked soybeans' fourth consecutive cut in weekly ratings.
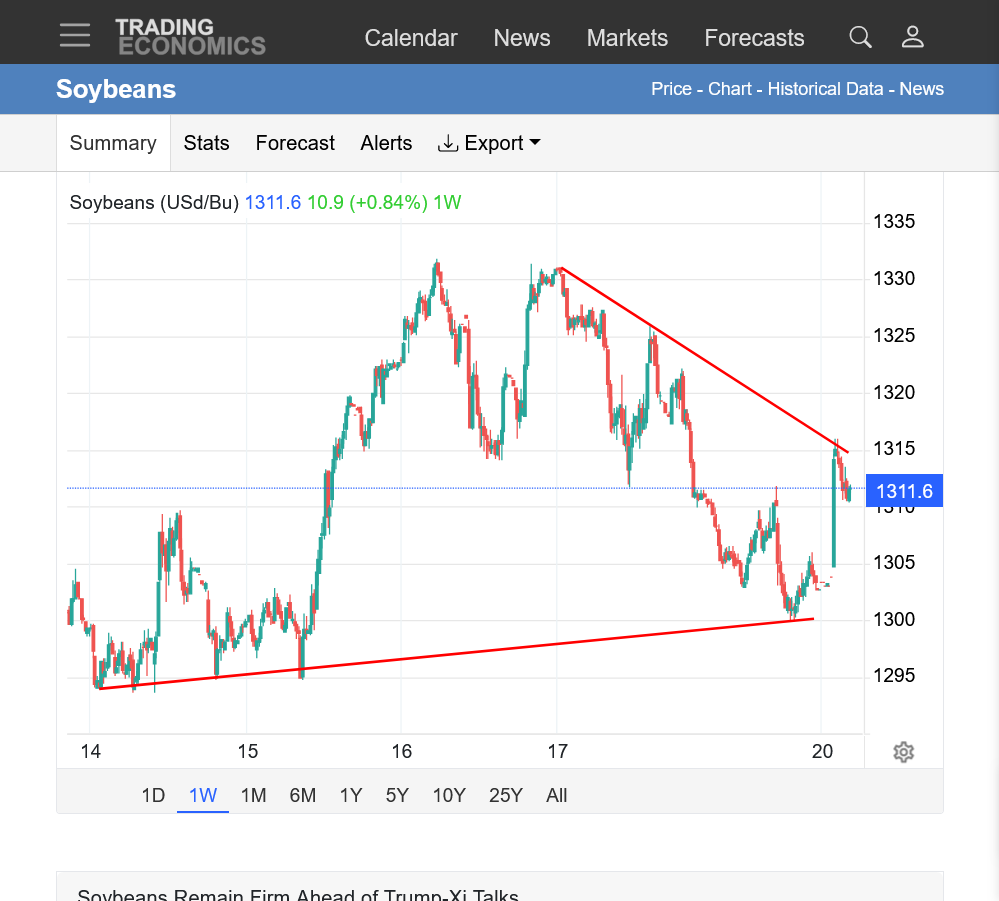
The beans, which had a better/more bullish fundamental/technical picture earlier in the year(held the uptrend, even when corn was making new lows above), have been a follower to corn the past month(with its record demand and record August rally) but last night's drop in crop ratings for the S crop, along with the HOT/DRY pod filling weather that is taking bushels off the size of the crop right now has launched the beans to new highs!!
·August was one for the record books. CBOT December corn gained 15.9% last month, its strongest August since at least 1973. What tends to happen after a summer rally like this? My Tuesday morning newsletter tackles that question and takes a quick look at soybeans and wheat.
I never recommend any paid services here since I would never use them myself, other than to get timely weather model data.
A trader can get all of this information themselves with some work and do their own analysis. However, as evidenced by my use of Karen's awesome graphics FOR FREE to this point, now that she has a huge following and is using that to make money (good for her but not so much for the rest of us) she might be worth it for people that want quick, usable data handed to them on a silver platter with the most awesome graphics....that currently don't have a paid source they find reliable.
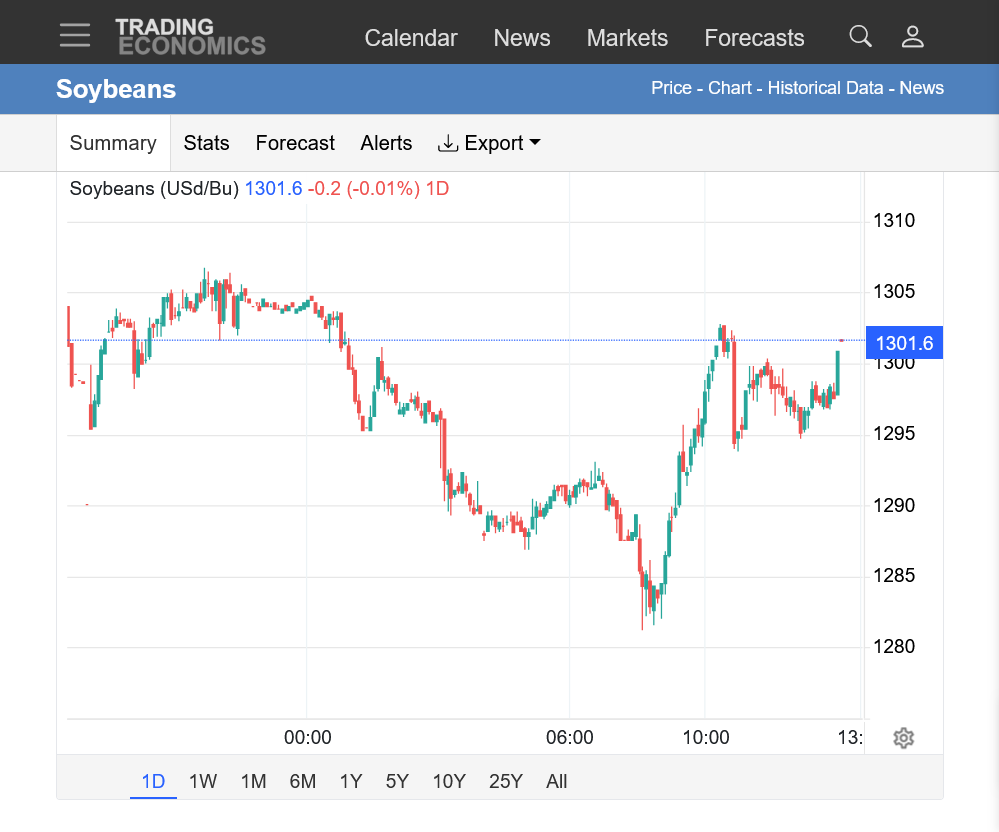
Beans sold off over 20c overnight from extremely overbought conditions(and in most markets would have signaled a top and others joining in........BUT COULDN'T STAY DOWN because they are so bullish right now with traders buying new highs AND buying small corrections!
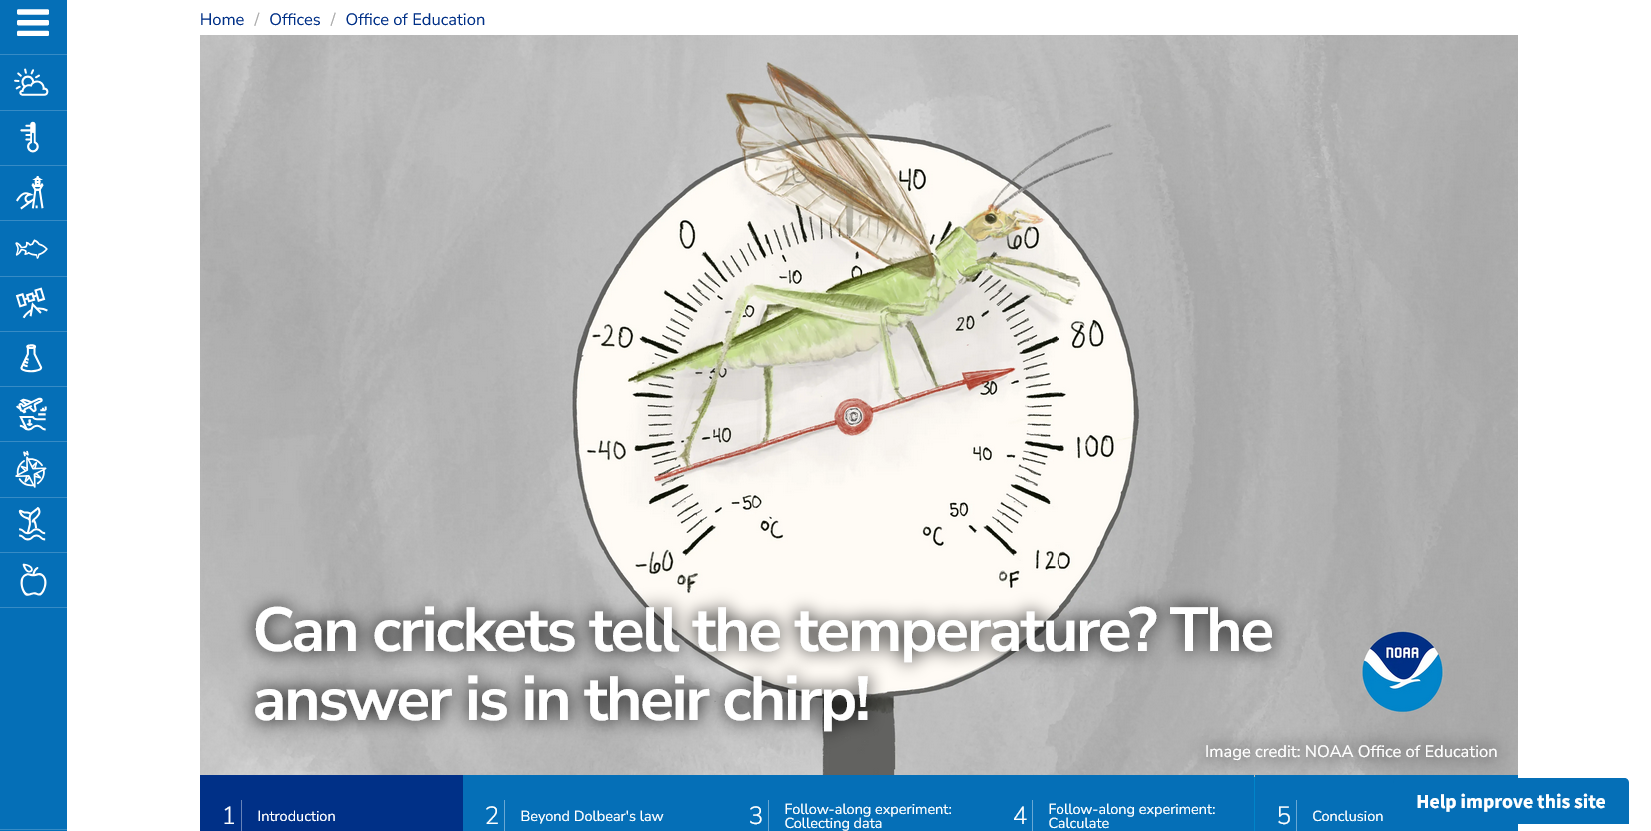
Dolbear's lawstates the relationship between the air temperature and the rate at which crickets chirp.[1][2] It was formulated by physicist Amos Dolbear and published in 1897 in an article called "The Cricket as a Thermometer".[3] Dolbear's observations on the relation between chirp rate and temperature were preceded by an 1881 report by Margarette W. Brooks, of Salem, Massachusetts, in her letter to the Editor of Popular Science Monthly[4]— although, it seems, Dolbear knew nothing of Brooks' earlier letter until after his article was published in 1897
For many people, opening their windows to a chorus of crickets is a hallmark of summer nights and fall mornings, but did you know that their symphony can also be used as a thermometer? By counting the frequency of their chirps, you can estimate the temperature with arithmetic!
Much like a sluggish bumble bee on a cool spring morning or a lizard sunning on a rock, crickets move slower in cooler temperatures. This is because each of these animals is an ectotherm — their body temperature depends on the temperature of their environment. As crickets warm, they can rub their wings together faster, which is how male crickets make the nightly repetitive chirp they use to attract mates.
The relationship between cricket chirping and temperature has been noted for a long time. In Western science, it is called Dolbear’s law after the most widely referenced early publication on the phenomenon published in 1897 by Amos Dolbear. His observations showed that you can count the number of chirps per 15 seconds, add 40, and that will give you the temperature in Fahrenheit (F).
Dolbear's law
Temperature (F) = number of cricket chirps in 15 seconds + 40
++++++++++
Temperature Duality: The Heterothermic Mastery of Honey Bees
The night/day beans "decide" that buying the dip is over will result in a dramatic move down as the 'bottom' pickers, having bought a perceived low, get crushed as the false support gets overwhelmed.
Will this 3 day weekend generate a well known axiom---markets tend to create highs/lows the Friday or Tuesday (Monday night) of three day weekends. Take a look at 6 month chart and notice the 3 day weekends. Are there not highs/lows?
Weather report/expectations changes, momentum slowed/accelerated, drastic change world events, etc
I should also point out, occasionally, a weekly breakaway gap can occur!
Thanks for sharing what I consider to be one of the best/elite sources for grain market discussions.........and incredibly, it's FREE!
I should probably try to pass on their daily stuff here to readers on a regular basis if I can remember. Please do that when I forget or when you see fit.
Knowing the weather intimately, I'm in the lower yield camp. The amount of heat fill in the really hot places hurt the yields there!!!
Funny thing is that I was bringing our just turned 4 year grandson here from preschool yesterday. We always drive past tons of corn and soybean fields on the way and I tell him about all sorts of things related to those crops that a bright 3-4 year old can understand.
He's very observational/analytical. Yesterday, on the way home he said "What happened to the corn?" remembering it used to be green earlier in the year.
"It's ready to pick for the animals to eat. The pigs and chickens and cows" I told him.
Then we spent the rest of the trip making different animal sounds and once home, watched a video of 50 different animals sounds that allowed us to guess before they told us what the animal was.... with Daddy and Grandpa guessing along with the tough ones.
U.S. corn harvested area came in BELOW both trade expectations and last month's estimate, a turn from the surprisingly high areas printed both last month and during the 2025 cycle. For soybeans, harvested area edged upward from last month.
USDA cut U.S. corn ending stock estimates this month with old-crop below and new-crop above expectations. Old-crop soybeans were unchanged, but new crop stocks were cut. Larger crop, but an increase in exports.
USDA reduced U.S. corn yield after some weather challenges this season. Prospects increased from last month in top producer Iowa, but they fell in most other major states, incl. a 12 bpa plunge in North Dakota. Illinois eased just 3 bpa, not quite the degree crop tour implied.
U.S. soybean yield increased slightly this month, and it would rank 2nd all-time after last year. Most top producing states saw increases. Top grower Illinois slid slightly, but North Dakota and Kansas were down hard after battling unfavorable weather late in the season
.
World wheat carryout jumps from August on larger crops in Argentina, Australia & Canada. Those three are also set to pick up the export slack given lower expectations out of Russia & Ukraine. Ukraine's corn exports are steady on the month at 22 mmt, China soy imports steady.
Excessive rain in IA and vicinity is battling against the market being way overbought by record large fund longs ahead of harvest pressure and a reversal down Friday after a bearish crop report.
Record bullish. Funds entered Friday's USDA reports with a historic net long in CBOT soybeans. But some of those bulls may be uneasy after Friday's reversal, led by a larger U.S. crop projection.
++++++++++
Price charts from our usual source are not plotting correctly.
Weather and crop conditions rarely impact prices in September, especially since global warming has greatly reduced the chance of an early, damaging freeze!
The U.S. corn and soybean crops are maturing slightly faster than a year ago and the five-year average, but less than half of both crops have reached maturity. Still time left. Harvest progress is still in the single digits but slightly ahead of the norm.
·
U.S. soybean inspections were better than expected last week. Nearly half the volume was destined for China versus none the week prior. Mexico remained the top corn destination with 31% of inspected cargoes.
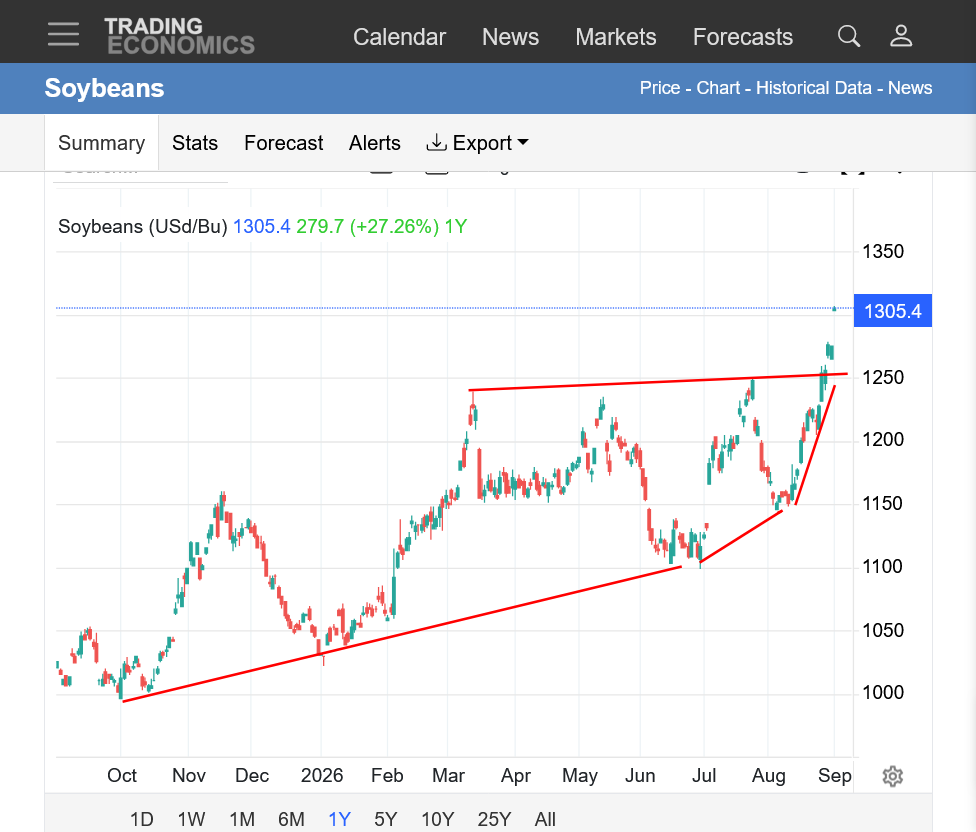
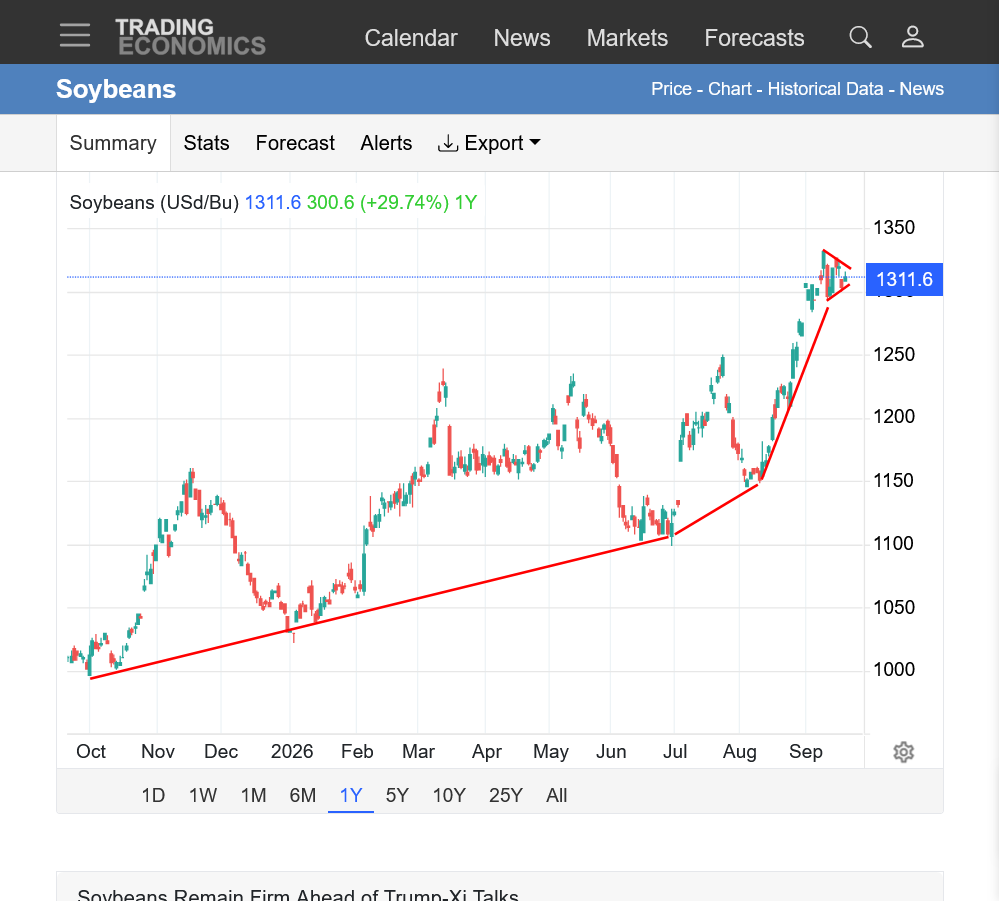
1 year beans below: BULL MARKET! Slope of uptrend has become steeper as prices accelerate higher. Recent price action/correction lower suggests a potential bull flag(continuation pattern). However, the market is extremely over bought, funds have record length and harvest is looming with extremely negative seasons the next 3 weeks.
The chart below could also be a (short term) top last week for the alternative view.
But I also think that the USDA numbers last Friday were too bearish because the late pod filling was brutal for some places with extreme heat/dry. There were also some extreme rains the past month+ that did damage. Demand for beans seems to be solid too.
++++++++++++++++
Andrew was in today with our weather:
Sep 15, 2026: Recapping Windy Storms in NE-KS-IA, More Midwest Storms Today, Heat Continues South
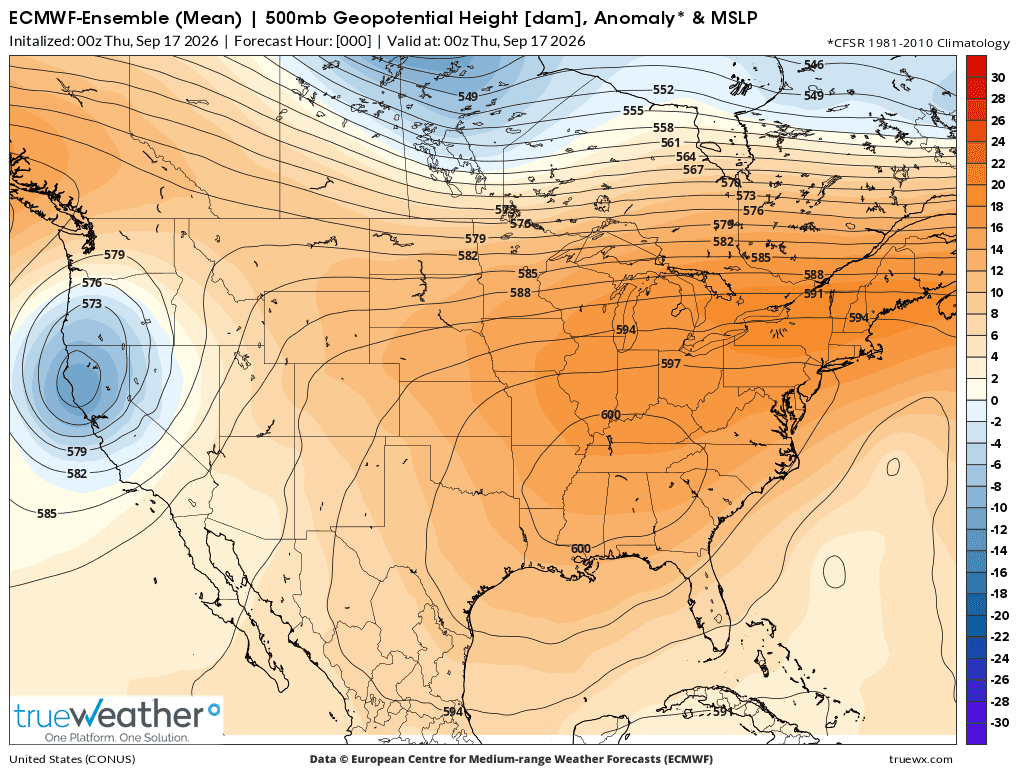
This was the Heat Dome as measured last evening on the 0z European Ensemble model. In 4+ decades of being an atmospheric scientist, I've never seen anything like this in mid-September. Not even in mid-July!!!!!
I would bet there hasn't been anything like this for our part of the country, this late in the hot season for much longer than that.
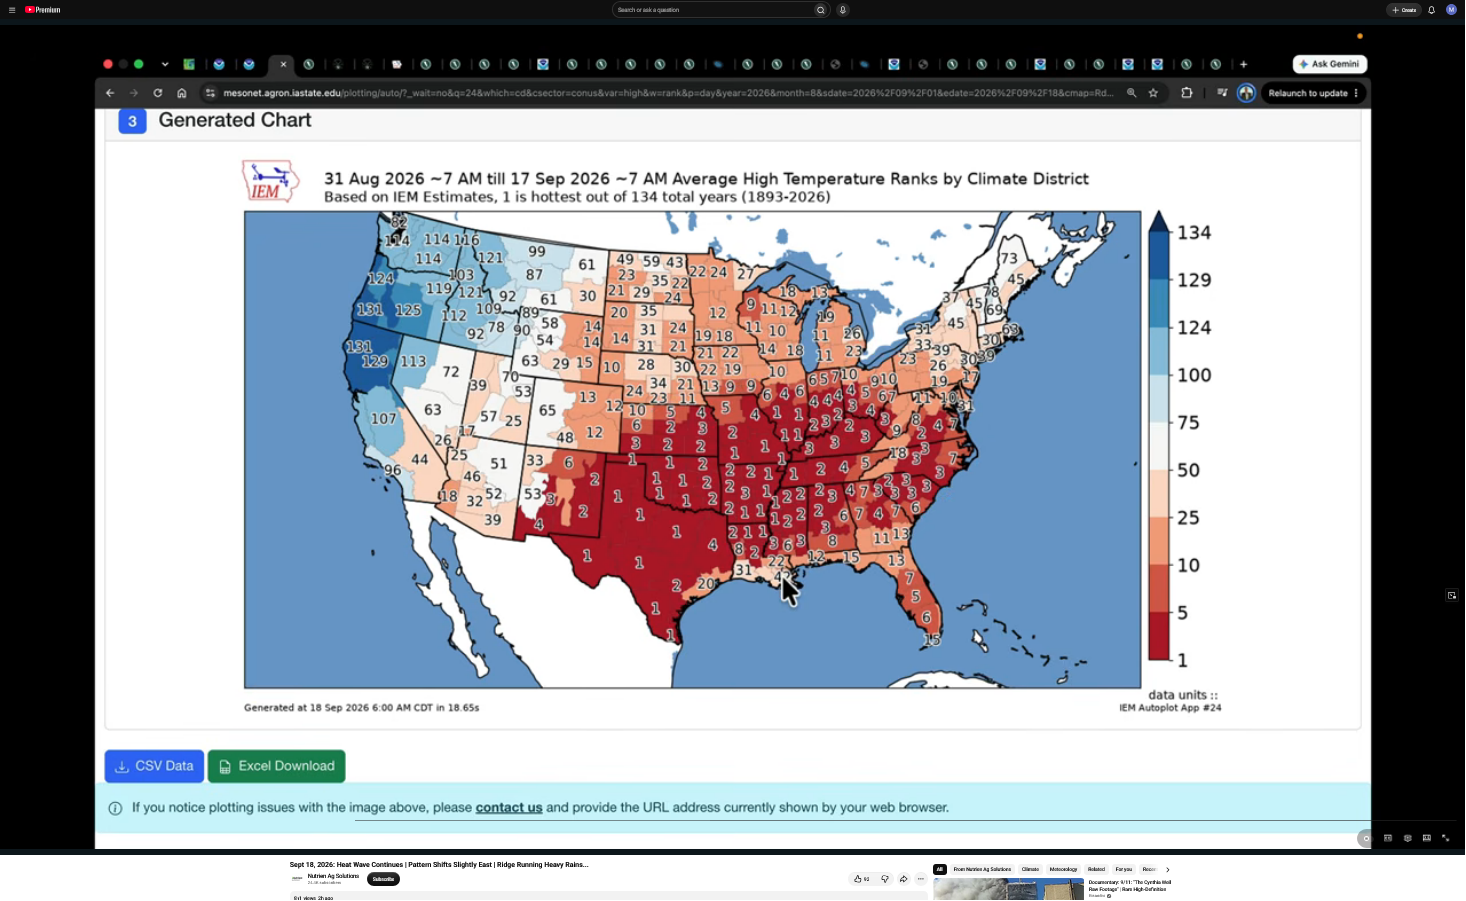
Temperature rank in history for the first 17 days of September. #1 is the hottest ever!
1. 1 year. BULL market, accelerating uptrend but harvest pressure usually causes lower prices from now into early October. Each year is different. We probably hit a short term top ahead of harvest and large funds already long out the wazoo. If extremely bullish, this is a bull flag.
2. 1 week: Potential short term double top. Potential symmetrical triangle.
3. Late Summer weather was very extreme in some places that hurt yields! 2026 production is likely LOWER than what the USDA just estimated in my opinion.
1. 1 year: Top at the end of May. bottom in early July, then the biggest price gain in August in 50 years. Unfilled gap higher that started this thread. Potential short term spike top/buying exhaustion or this could be a bull flag, despite harvest pressure on the way and funds loaded long.
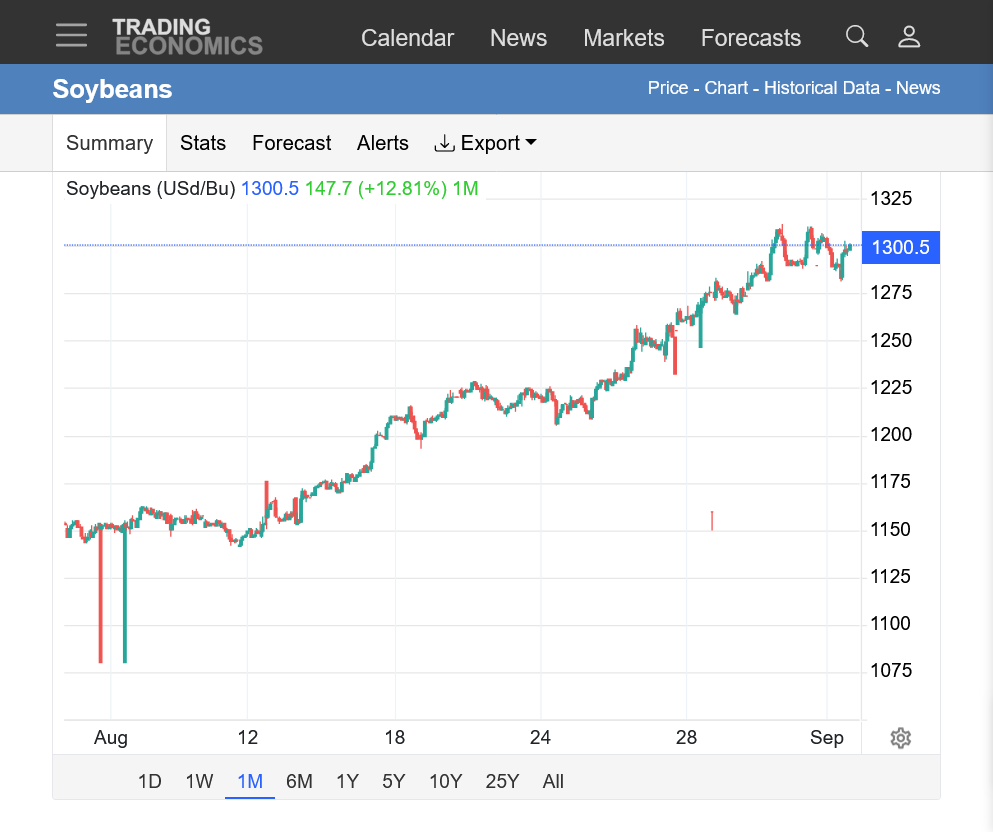
2. 1 month: Potential top but we held support and broke the short term downtrend after the highs. Harvest pressure on the way.
3. Late Summer weather was very extreme in some places that hurt yields! 2026 production is likely LOWER than what the USDA just estimated in my opinion.
I figured it was China because of the cotton doing the same thing which isn't grown in the Northern Cornbelt and the forecast didn't get wetter in the Northern Cornbelt and it's still just September.
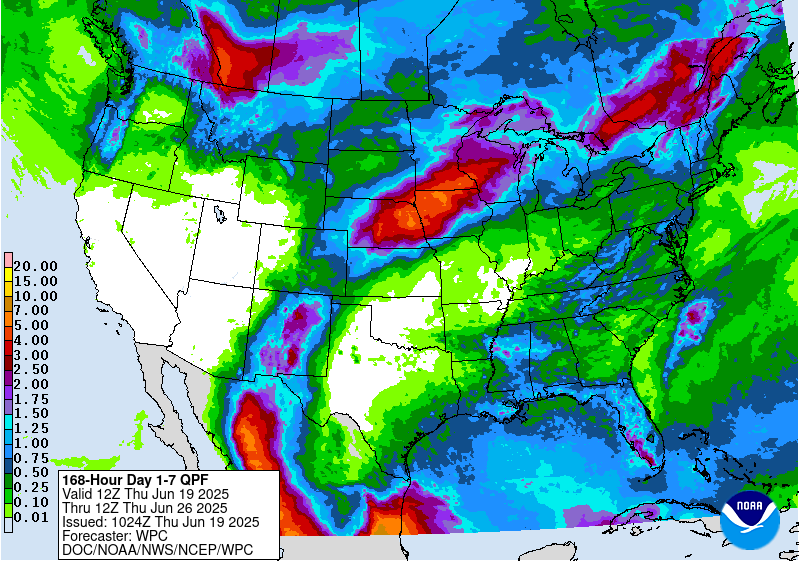
Total rainfall anomalies for the next 2 weeks from the last 0z European Ensemble:
This appears to be an OVER reaction by the market to the upside but that's what happens in BULL markets that are still BULL markets.
It's when the market UNDER reacts to bullish news when it's a warning sign for the bulls.
We still have a market looking for any excuse to go up!!!!
+++++++++++++
We could make a case for the Super Duper El Nino, now coupled with the atmosphere to greatly enhance these amounts going forward. Also, this stinks for us in the brown area with just 1 decent rain the past 3 weeks(non producers that care about the non crops).
Producers are saving time, money and risk(of high winds-lodging) with rapid dry down on the corn and prices have made a huge pop. Beans didn't mature as quickly as the corn (that used degree days/heat) but they will need to be harvested quickly and be careful to avoid shattering of the pods........right cutworm?
AI Overview
Bean pod shattering from overly dry conditions happens because extreme dryness makes the pod walls and fibers contract, putting intense tension on the pod seam (suture) until it splits open and launches the seeds. [1, 2]Why It Happens
Fiber Contraction: Drying pod wall fibers shrink and pull against the central seam, causing the brittle tissue to fracture.
Wet-Dry Cycles: If dry mature pods absorb moisture from rain or high humidity and then dry out again, the repeated swelling and shrinking weakens the seams.
Low Moisture Threshold: The risk of shattering spikes significantly when grain or seed moisture drops below 11% to 13%. [1, 2, 3, 4]
How to Manage and Prevent Shattering Loss
Harvest Early in the Day: Cut or pick crops in the morning when overnight dew keeps the plant material slightly damp and flexible.
Don't Delay Harvest: Avoid leaving mature, drought-stressed crops in the field past their prime readiness window.
Adjust Equipment: Slow down combine or thresher speeds and properly set reels to minimize mechanical impact on brittle pods.
++++++++++++++
metmike:
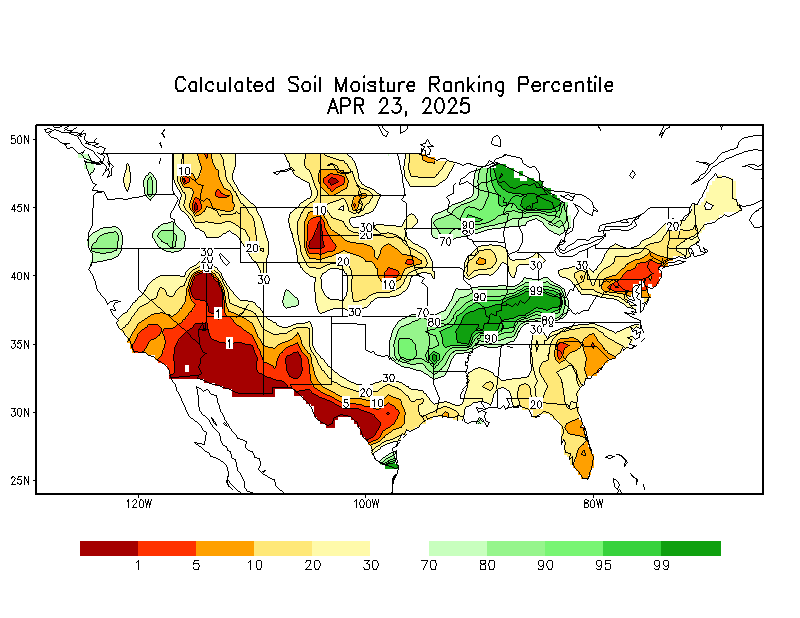
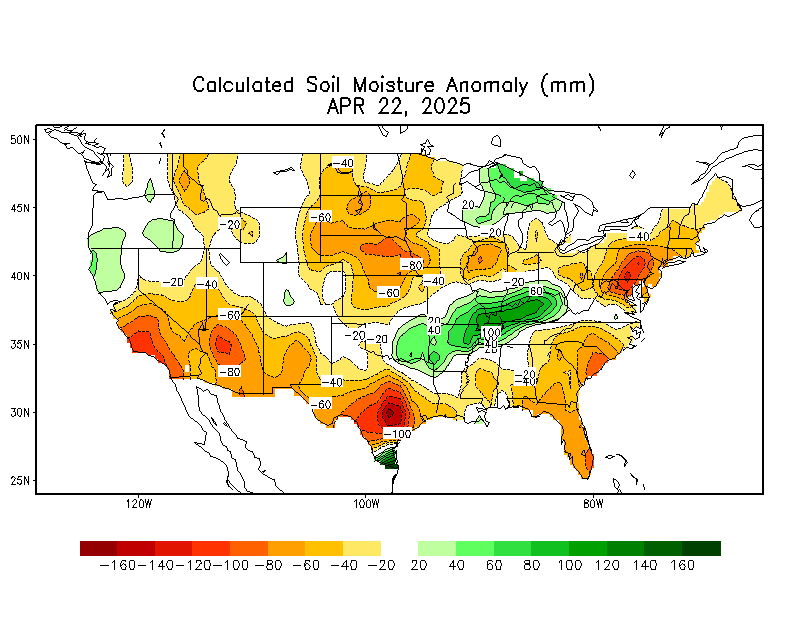
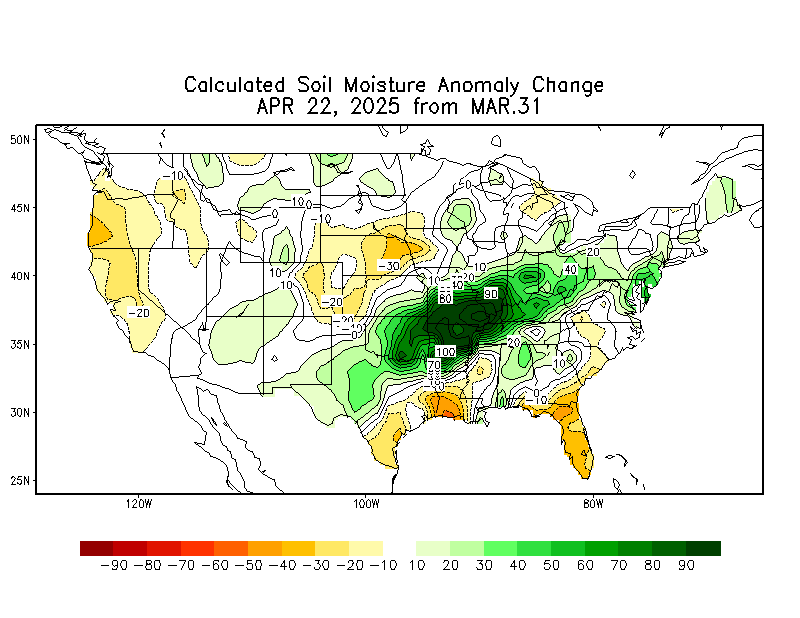
Soilmoisture anomaly:
These maps sometimes take a day to catch up to incorporate the latest data(the bottom map is only updated once a week).
Harvest Early in the Day: Cut or pick crops in the morning when overnight dew keeps the plant material slightly damp and flexible.
Let me explain.
Damp pods will not open (thresh) when the rotor hits them. The rotor along with the concave is the part of the combine that shells the beans from the pod. The squeezing action shells the beans from the pod. If the pods are damp they bend and don't break open, causing losses.
The real enemy is the reel the front part of the combine that helps bring the grain into the machine. Running that to fast will shatter the pods before they can get into the machine.
also the stems will not travel through the separation process if they are damp.
Just my 50 + years' experience operating these machines.
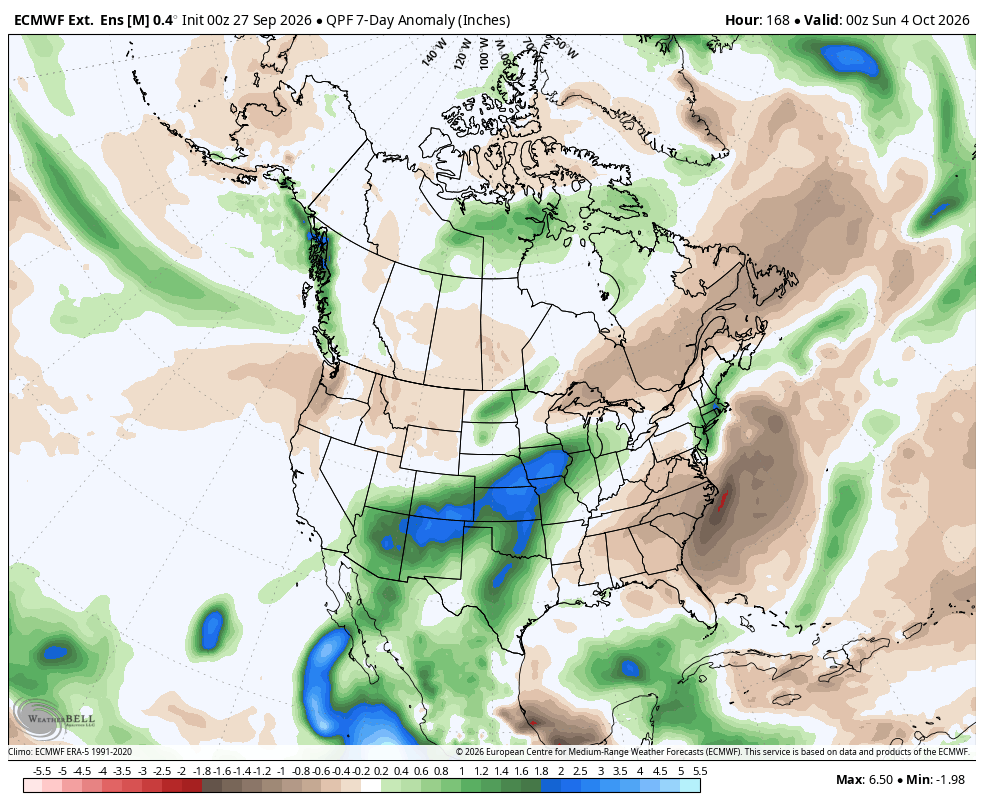
1. This is the total rain anomaly for week 1 from today's European Ensemble model 46 day outlook. Very wet in the Western Cornbelt. This is NOT wetter than the forecast last week. However, the 4 weeks after this are pretty dry!
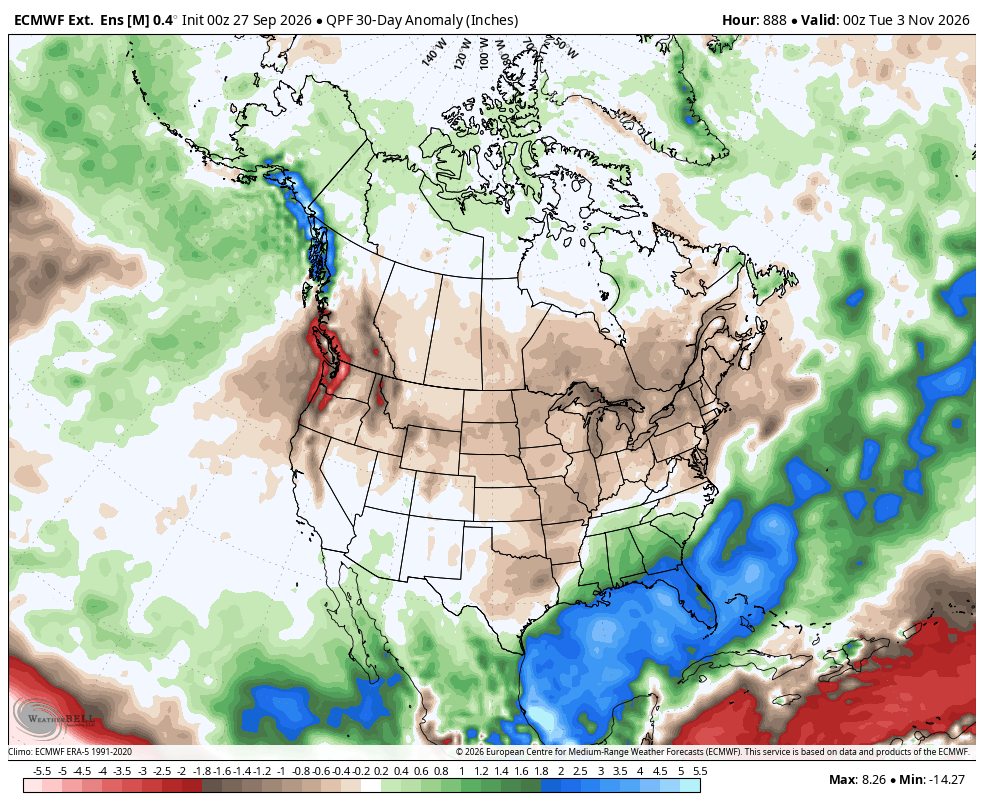
2. 30 day precip anomaly starting AFTER the week 1 forecast. October 3 thru November 3rd. Wet in the Gulf of Mexico to Florida in October. This is a potential El Niño pattern, shifted/displaced southward by a +PNA, northern stream regime.
increasing interest rates are bullish for the US dollar as foreign money buys dollars to purchase higher yielding bonds and treasuries. This makes our exports more expensive and hurts demand…….a bearish factor for grain prices.
It’s tough for beans to go higher at the end of sept/start of October from harvest pressure But each year is different. It has happened several times before.




 @kannbwx Last week's U.S. corn export inspections topped trade estimates, setting another record high for the week among 40+ years of data. Mexico was the top corn destination at 34% of the weekly total, while the EU took 15%. Soybean inspections fell short, with no cargoes to China.