
Previous thread!
8-28-26 Late Summer heat wave
17 responses |
Started by metmike - Aug. 28, 2026, 8:45 a.m.
https://www.marketforum.com/forum/topic/122444/
+++++++++++
Get all the comprehensive weather here:
https://www.marketforum.com/forum/topic/83844/
+++++++++++++
The latest guidance has a STRONG cold front dropping thru the Midwest in the middle of this week as the MAJOR heat dome is beat down by upper level energy from the northern stream!
Weather features the next week. Note the cold front. This one will finally have some much cooler air behind it.
https://www.wpc.ncep.noaa.gov/medr/medr.shtml
.png)
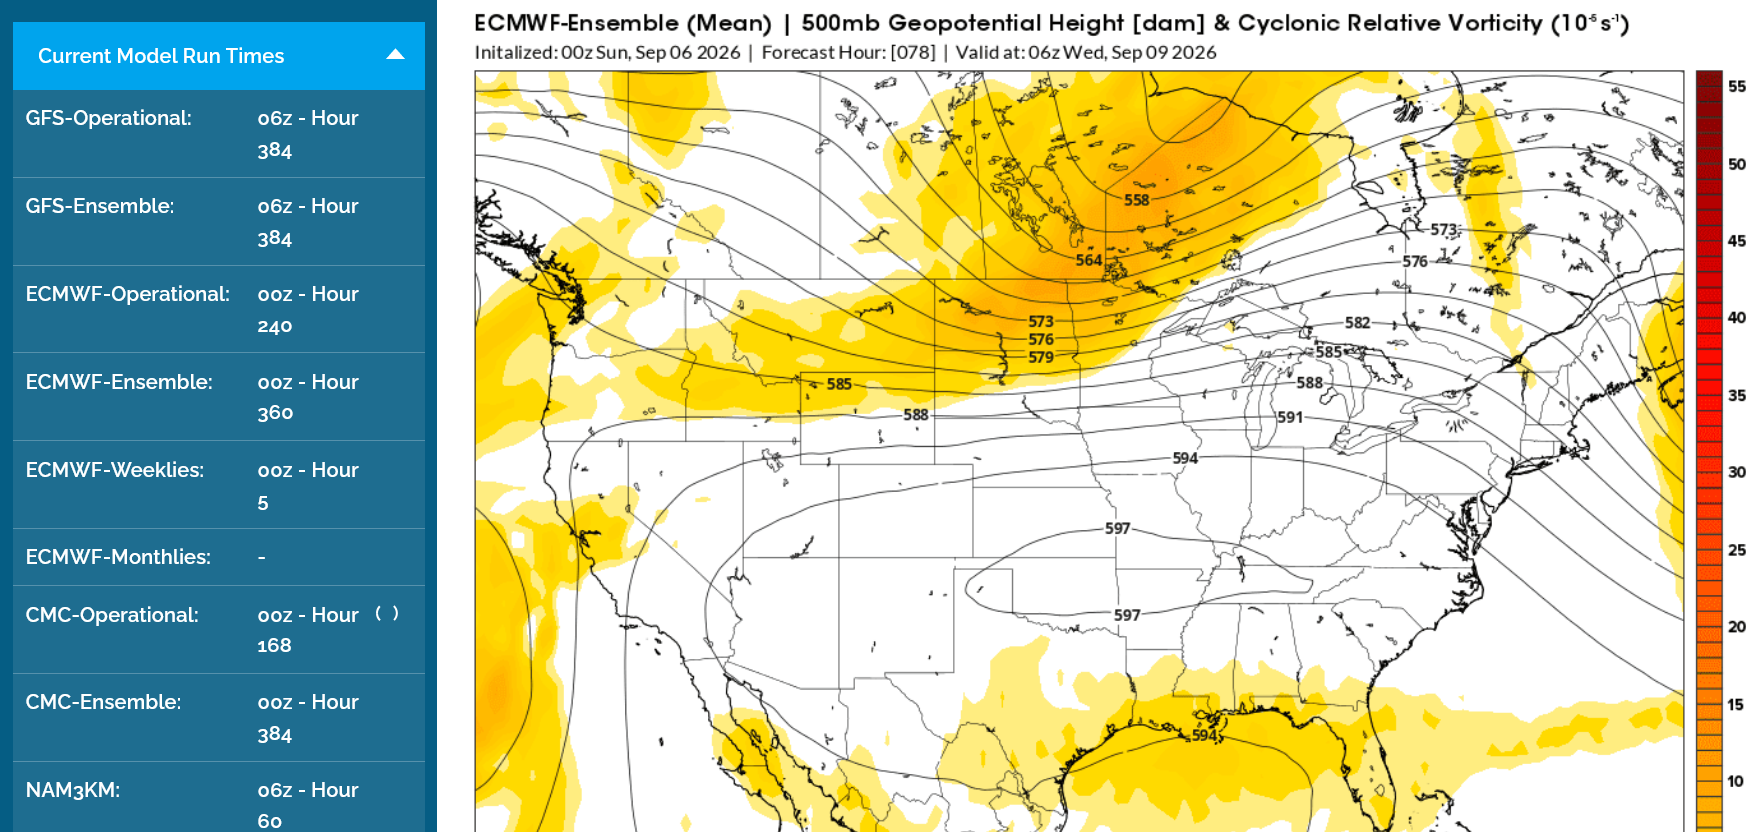
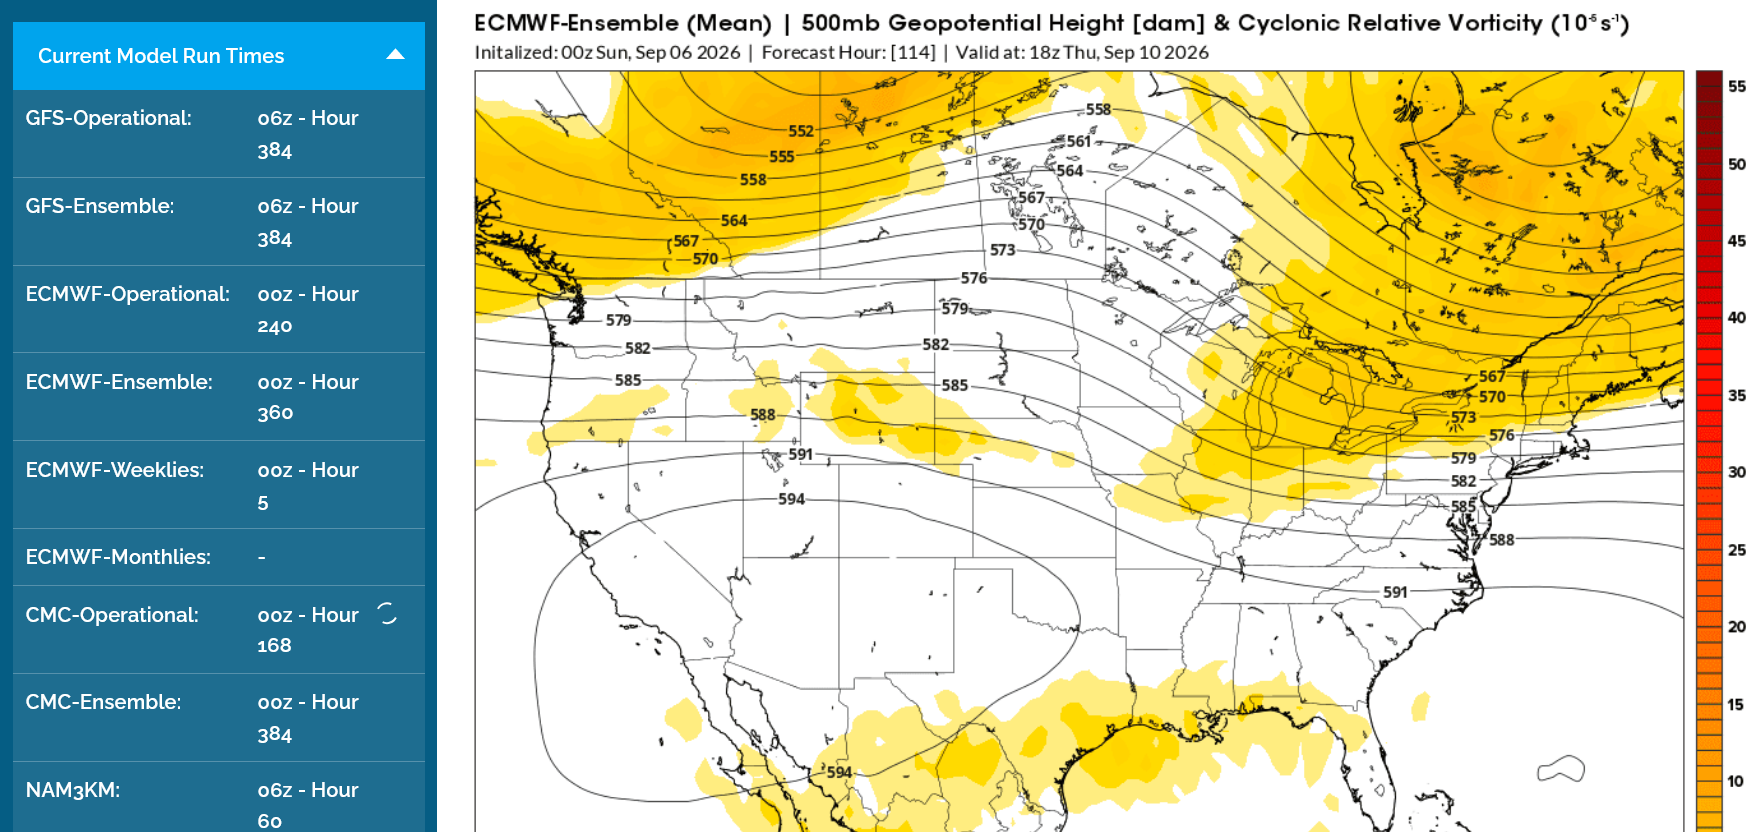
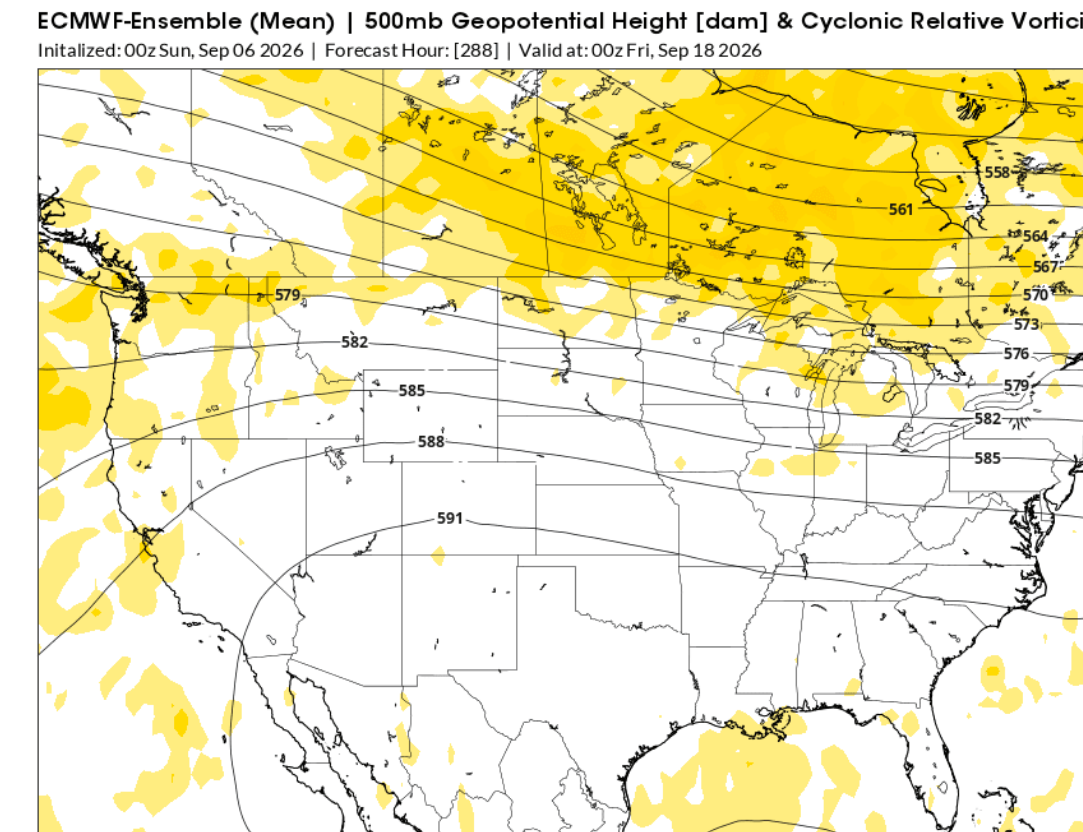
This is what the expansive, rain suppressing heat dome will look like from the last 0z run of the European Ensemble model. This is 500 mb which is around the mid point of the atmosphere based on its mass/weight. In this case
A 500 mb geopotential height of 597 on a summer weather map corresponds to an altitude of 5,947 meters (about 19,587 feet or 3.7 miles) above sea level.
The hotter it is the less dense the air and the fatter the atmosphere becomes with the 597 contour (for 500 mb) only showing up when the atmosphere has really expanded from HEAT.
500 mb pattern this week:
1. Late Tuesday: 597 dm closed contour heat DOME with powerful upper level energy crashing thru the Upper Midwest and tracking southeast.
2. Thursday: Upper level energy has smashed the heat dome and forced it to retrograde much farther west!
3. September 17/18: The heat ridge is farther southwest to the south with modest northwest flow into the Midwest.
++++++++++++++++
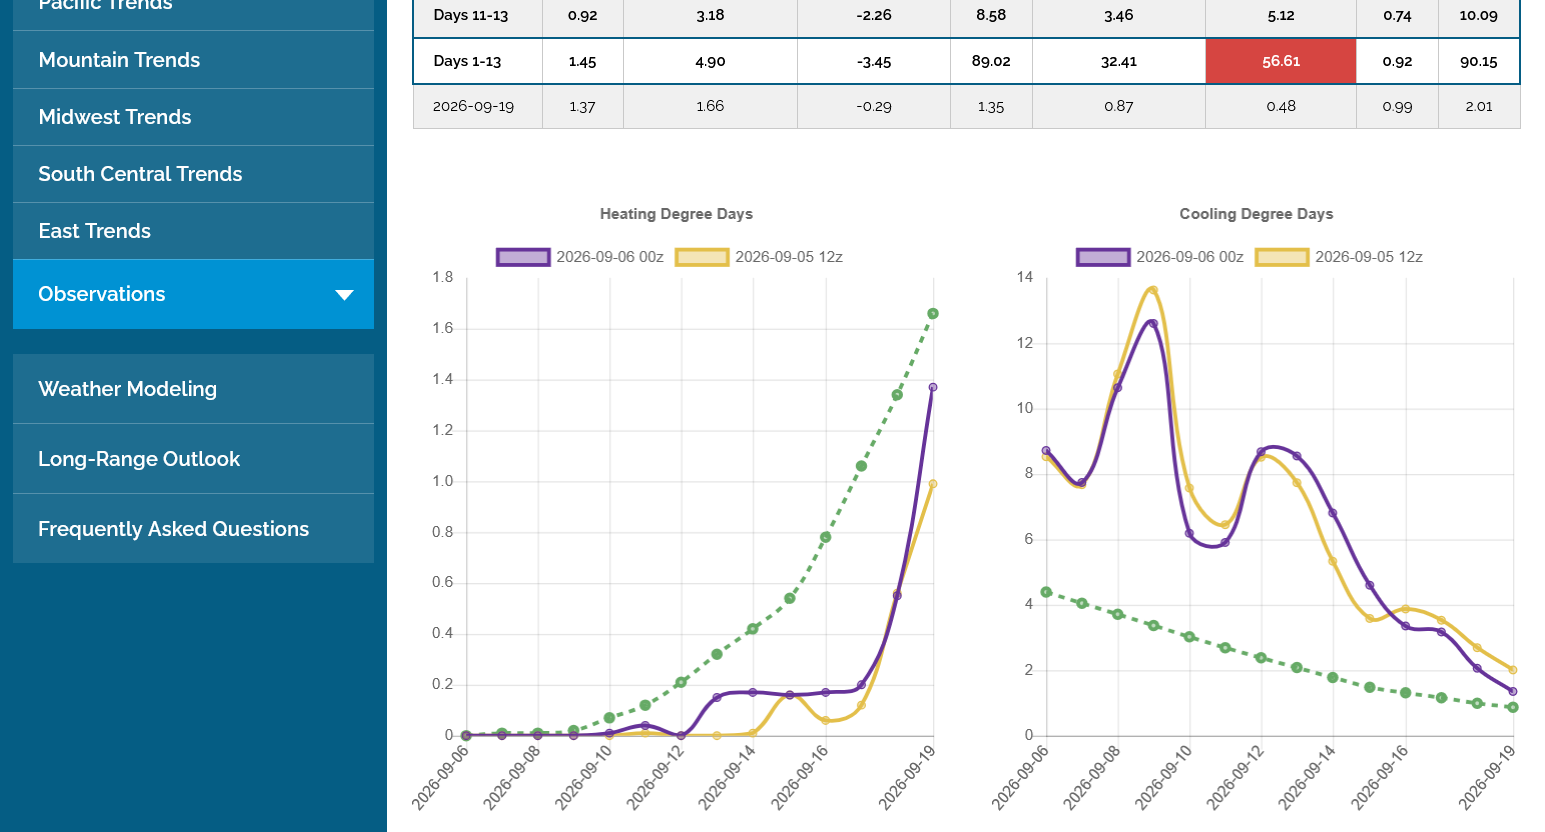
Graph on the right: Predicted CDD's(cooling degree days) for just the Midwest the next 2 weeks from that last 0z European Ensemble model(purple). Previous run was 12 hours earlier. After the spike higher early this week, note the significant drop which even takes temperatures close to average(that may be optimistic). The heat will be pushed farther south and especially southwest.
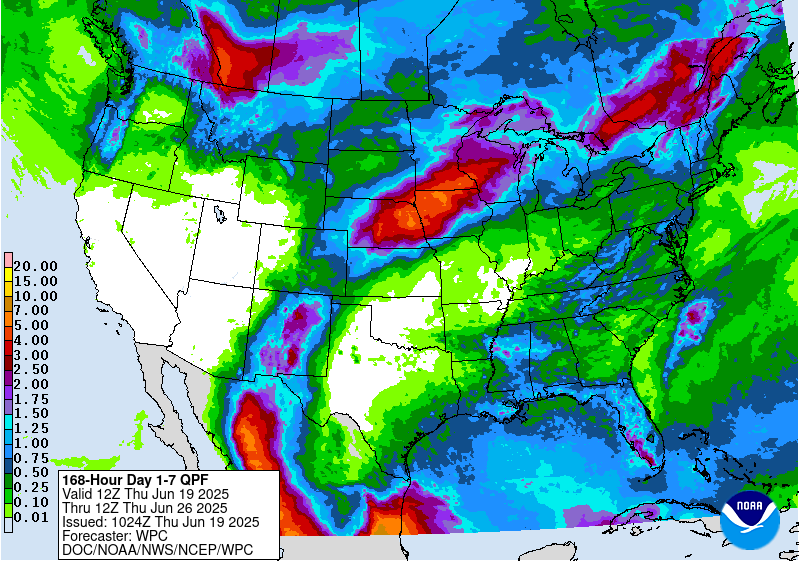
The biggest benefit here will be to potentially get the first decent rain in several weeks!
https://www.marketforum.com/forum/topic/83844/#83848
7 Day Total precipitation below:
http://www.wpc.ncep.noaa.govcdx /qpf/p168i.gif?1530796126
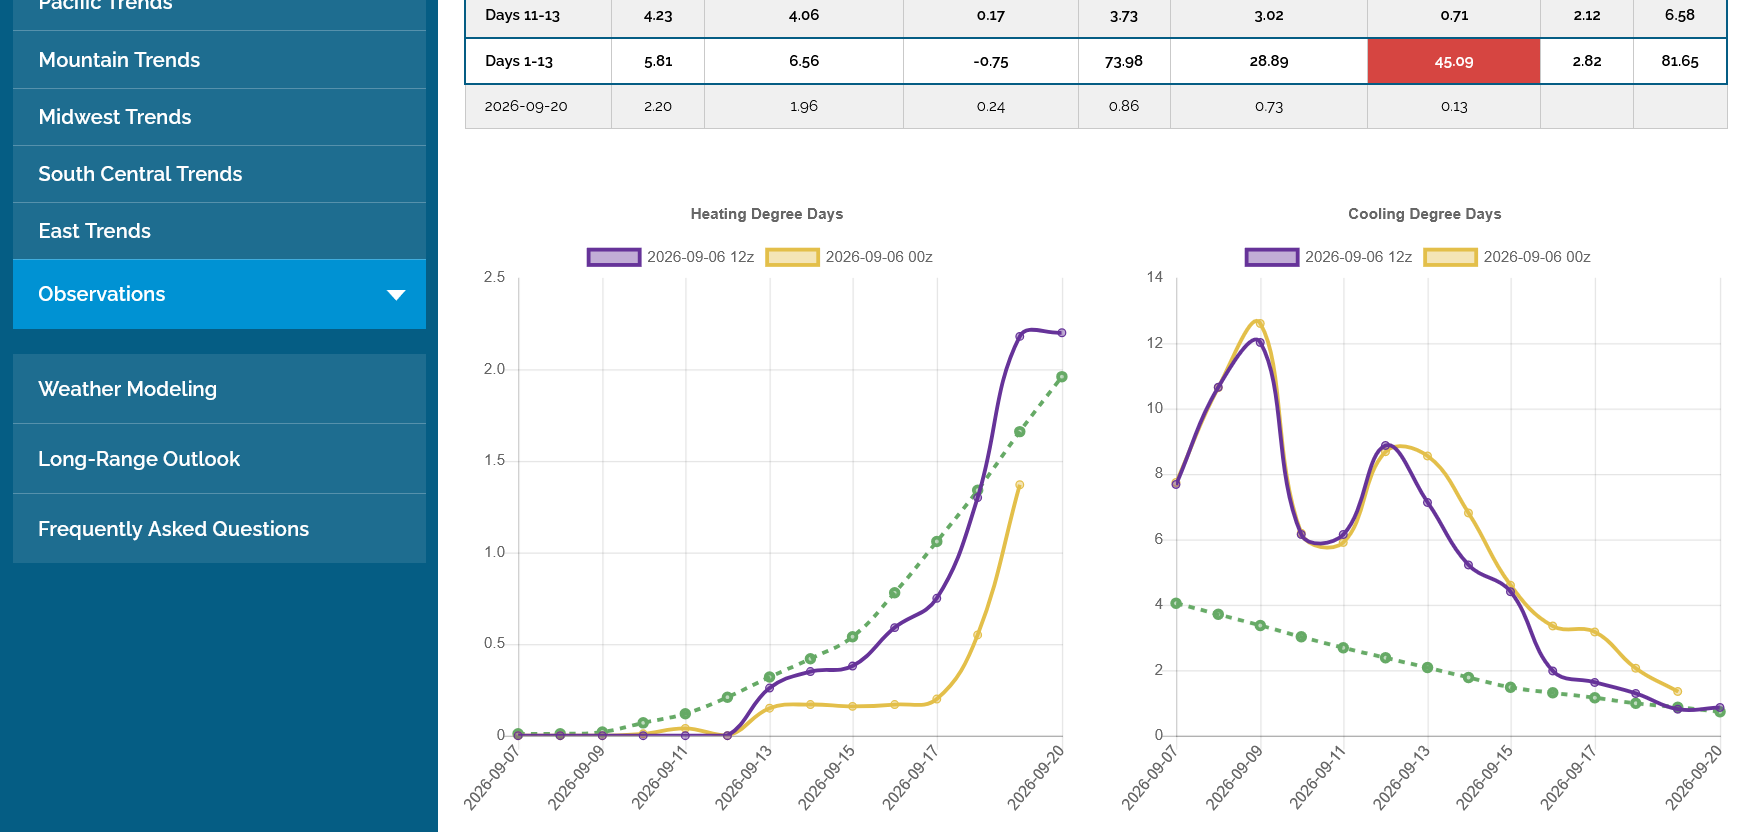
This was the last 12z European model update for CDDs for just the Midwest, purple/right. Down another 7.7 CDDs. from the previous, already cooler run.
After a few wet months, New England is deep in mushrooms and spotted lanternflies.
The upper Colorado & Pecos/Rio Grande watersheds are still desperate.
Florida could use a gentle tropical storm. Last week's drought map: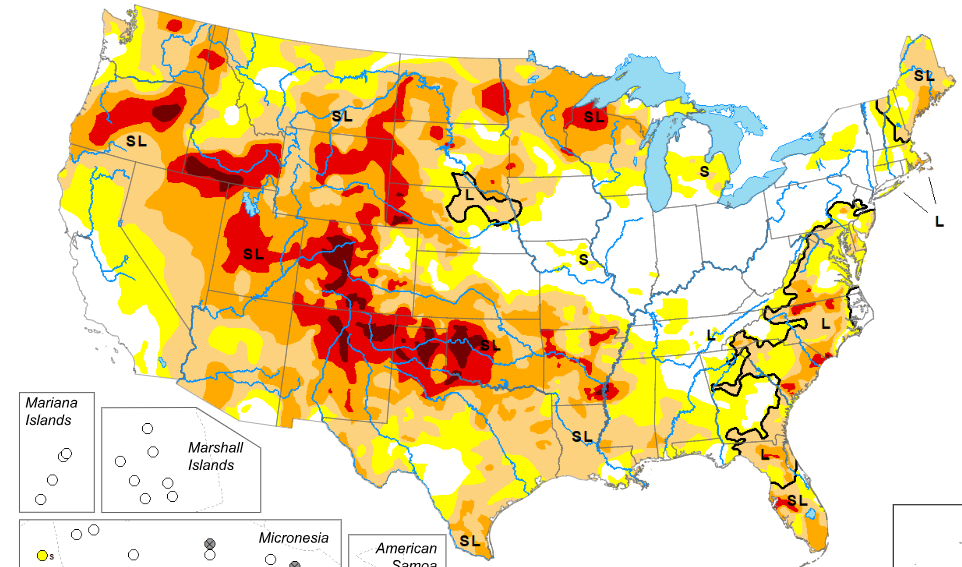
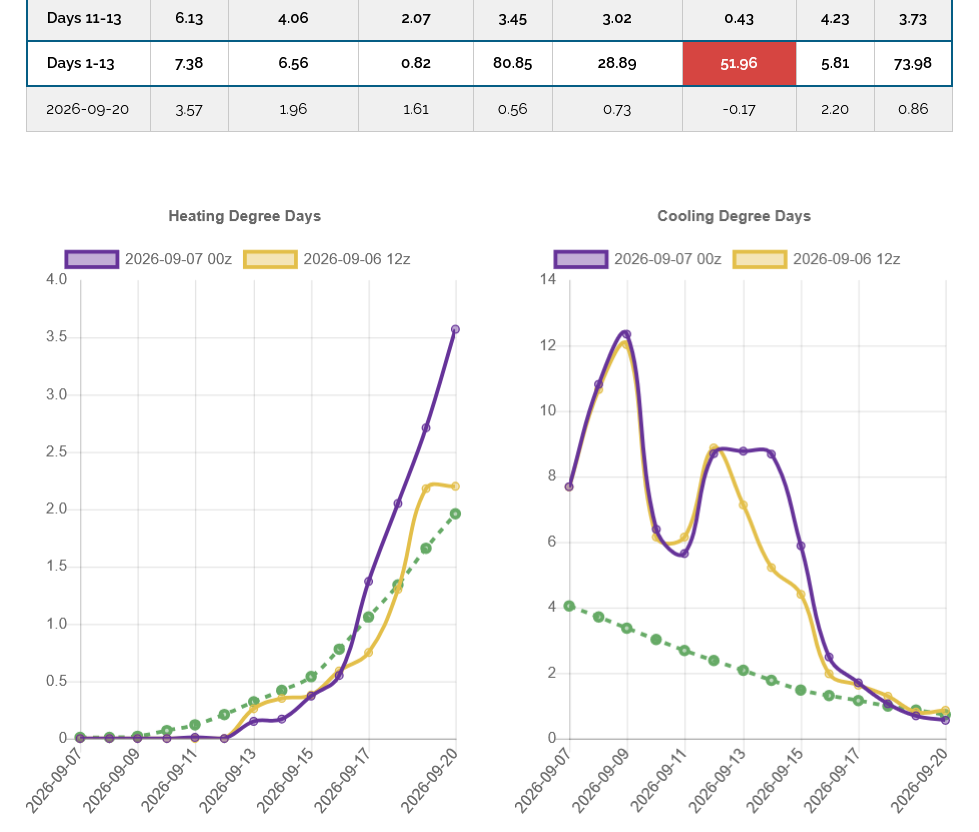
The last 0z European Ensemble model's CDDs were +8 CDDs vs the previous run with another SURGE IN HEAT as seen in the bump up in the middle of the graph on the right for the purple line.
This is a temporary/short term dynamic as the OVERALL pattern below continues to feature a steep drop in the down slope that takes the predicted CDDs from greatly elevated on the left(next couple of days) to almost average on the right, as the purple line CONVERGES with the green dashed line(climatological average-which is falling but not as fast as the actual temperatures will be falling).
The drought is so bad in the CO Rockies that black bears are coming into towns like Vail and Aspen more in search for food as the supply of wild berries is reduced a lot.
Thanks, Larry!
Yes, the drought is pretty bad out there.
Watch the current record El Nino turn some of the southern areas currently in severe drought turn into flood zones later this year/early this Winter!
2-17-26 El Nino, here we come-FAST!
Started by metmike - Feb. 17, 2026, 11:54 a.m.
https://www.marketforum.com/forum/topic/117969/
++++++++++++++
https://www.marketforum.com/forum/topic/83844/#83853
https://www.drought.gov/current-conditions
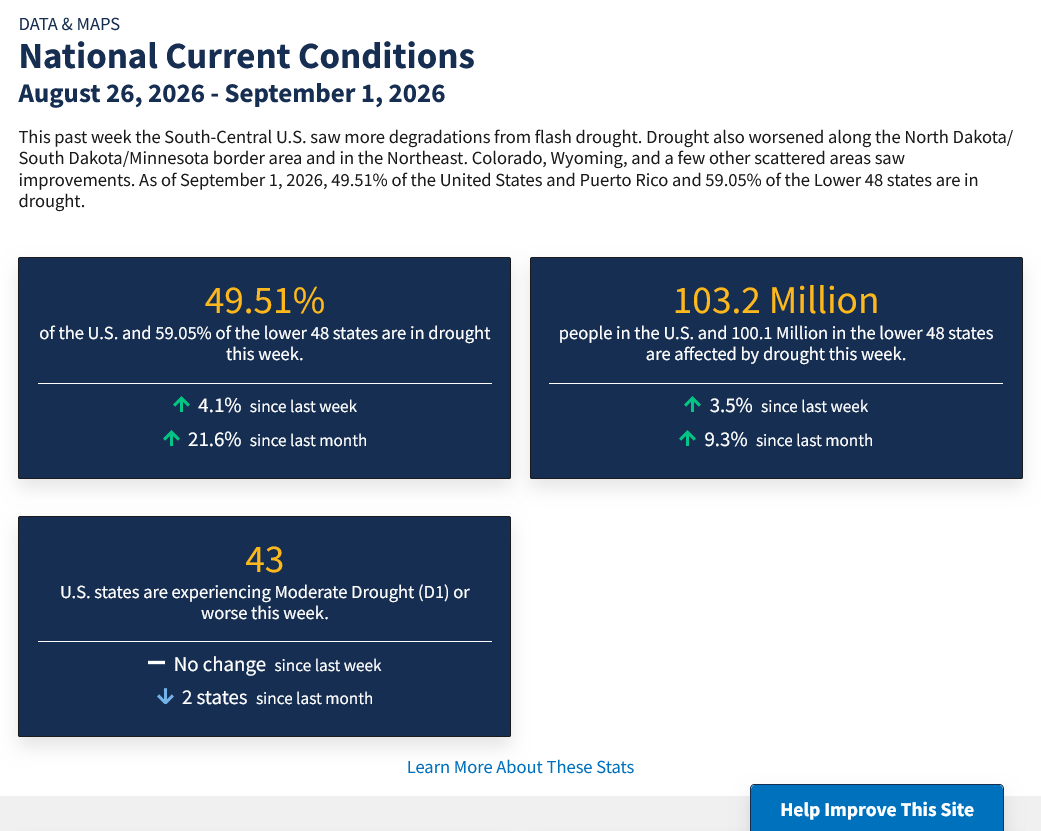
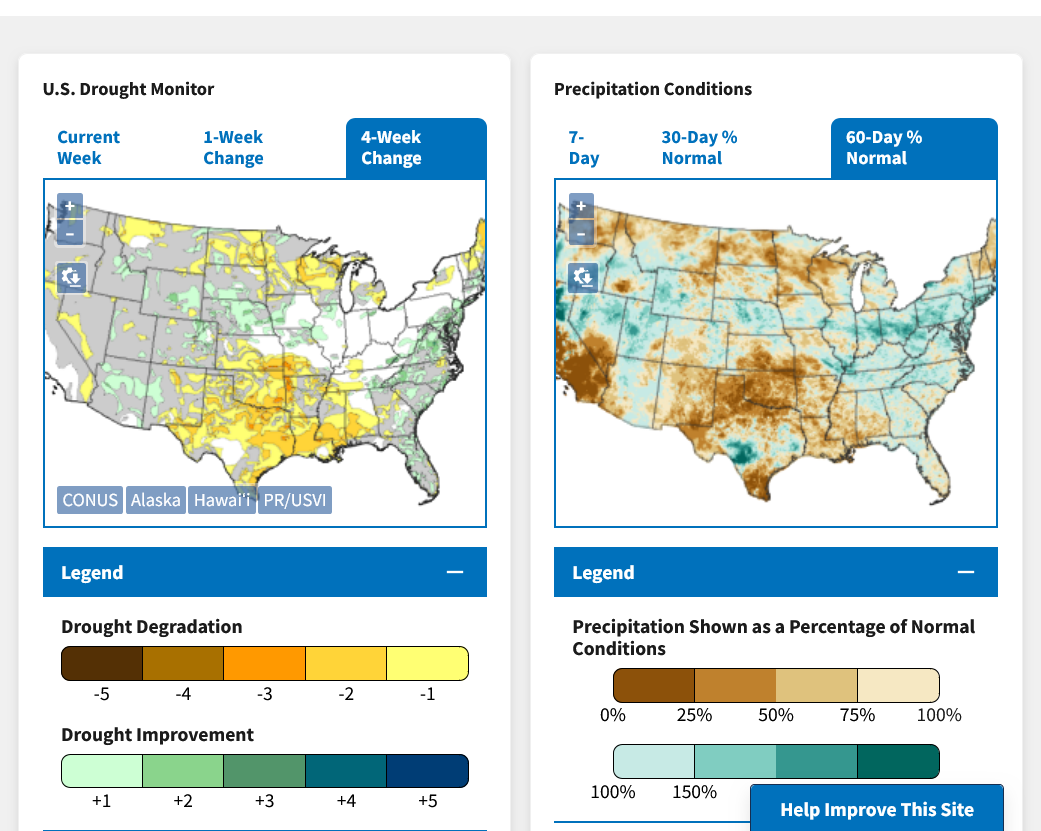
Recently, Flash Drought in the Southern Plains!
National Current Conditions
Thru August 4, 2026
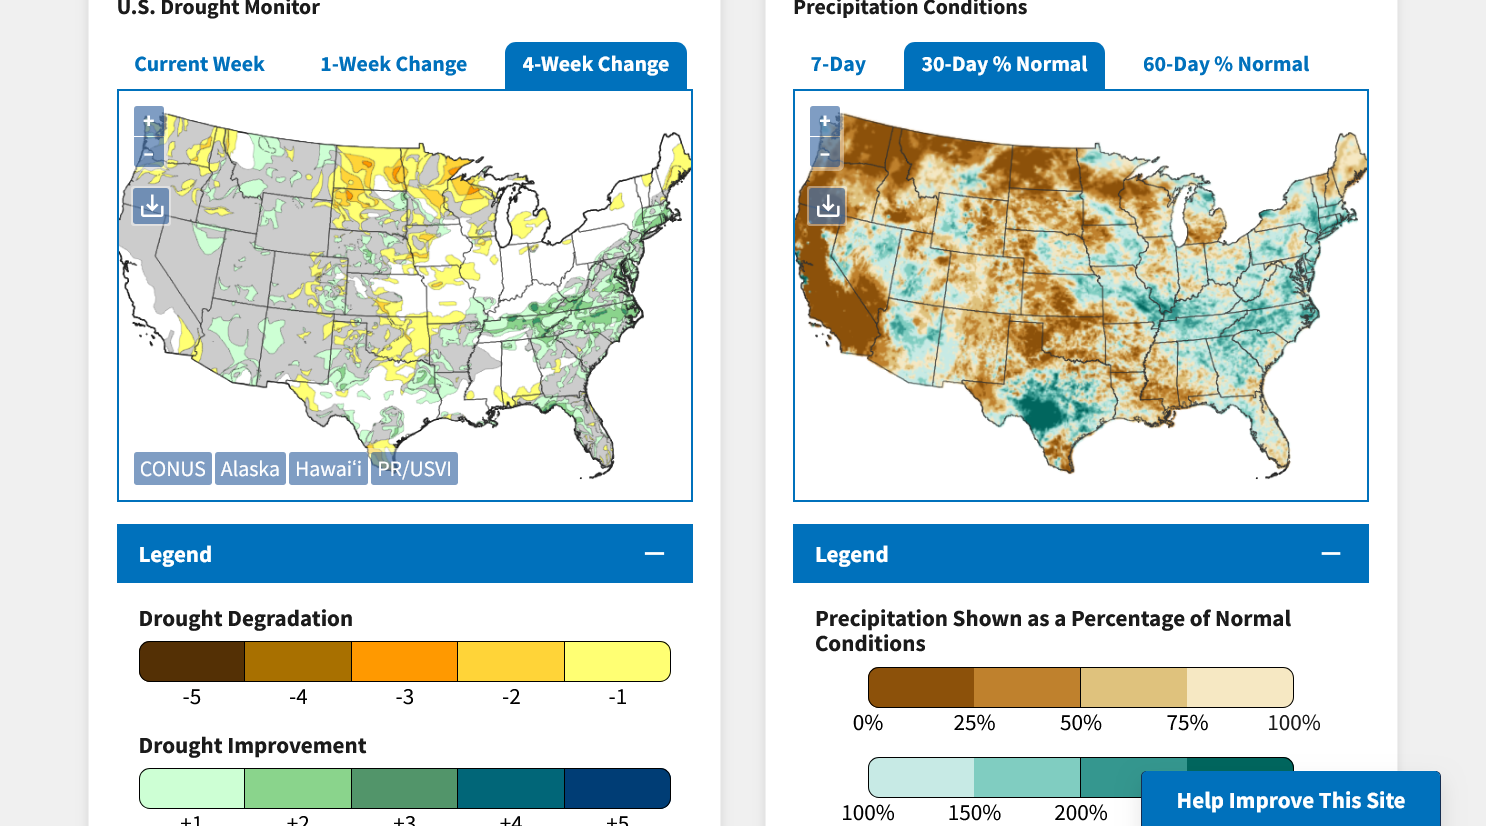
Drought worsened a great deal in the Southern Plains, Northern Plains/Upper Midwest (FLASH DROUGHT) but improved in the East to FL the past 2+ months!
https://droughtmonitor.unl.edu/Maps/ChangeMaps.aspx

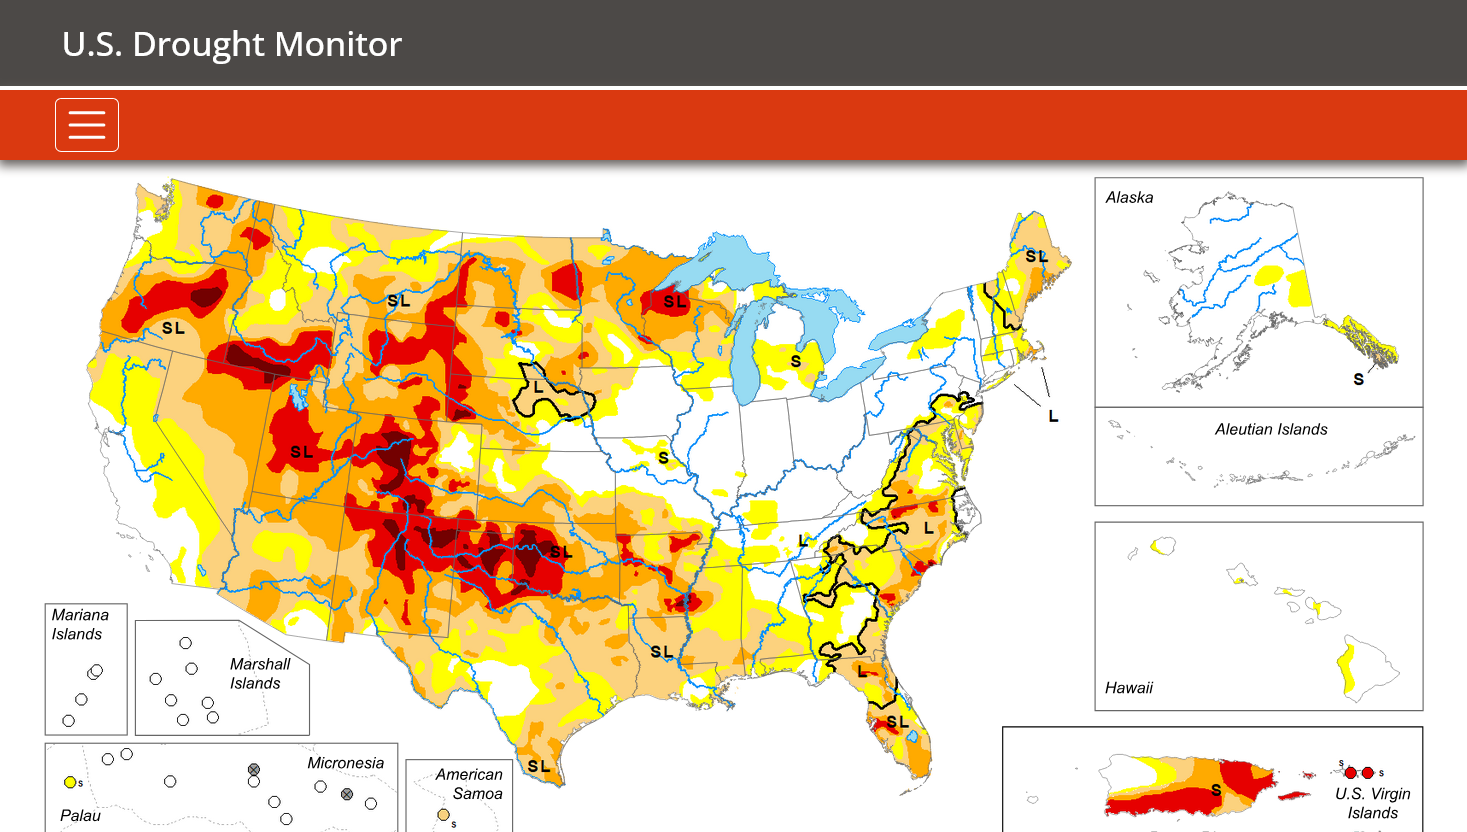
DROUGHT MONITOR
https://droughtmonitor.unl.edu/
Released September 3, 2026
And a bigger thanks to patrick for bringing up the drought. I missed your post earlier because I was typing a new post and just noticed it!
For a small board on a beautiful holiday, timestamps 2 minutes apart aren't something you watch for!
Just came in to put away some laundry & now time to go back to the terrace.
Been repairing the irrigation system today but there's not much new with our weather.
Tomorrow's heat advisory should be the last one for this heat wave. We'll hit 90+ again a couple of times but with modest dew points the Heat Index may stay below the threshold.
Hoping for at least .5" of rain with this next cold front but we have our first T-Ball game of the season at 6pm Thursday, so let's get it out before then.
Surprise! It's another brief heat wave coming up this week for 4 days. We will likely have another Heat Advisory for the Evansville area this Tue-Thu.
This page was created for our Fall T-Ball program at McCutchanville/Evansville, IN that is playing evening games this week.
We should note that HEAT WAVES are huge air masses that can be predicted days in advance with high confidence, while many rain events can't be known until we wait to see if they actually develop on the LIVE RADAR.
Get all the comprehensive weather here:
https://www.marketforum.com/forum/topic/83844/
https://www.marketforum.com/forum/topic/83844/#83851
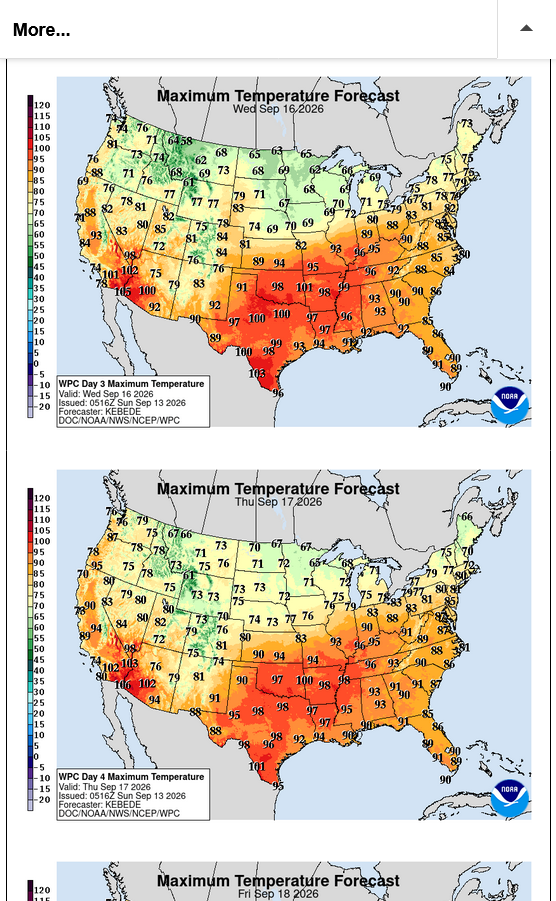
Highs Wed-Thu below.
The Heat Index will still be at 95+ deg. F at 6pm on Tue-Wed and probably Thu!
AI Overview