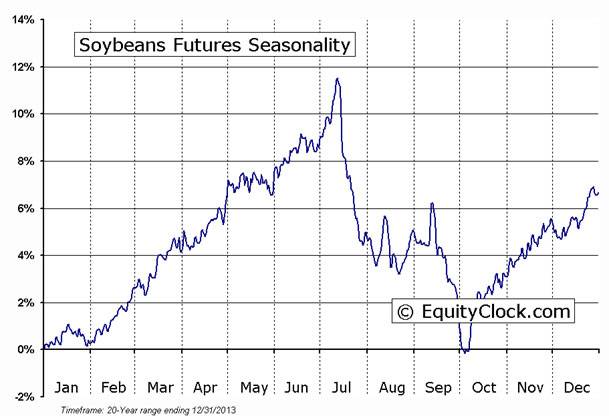
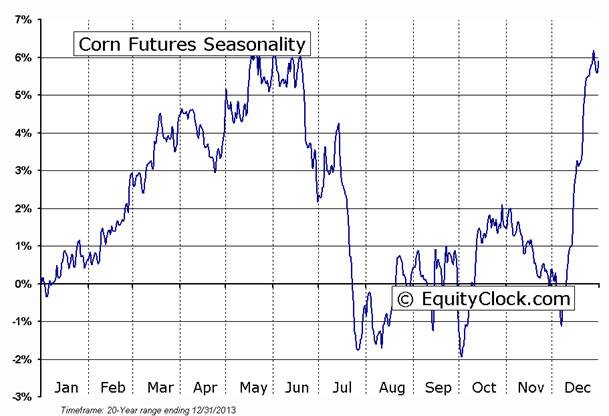
seasonals say buy corn and beans all of the bearish news is in the Market.
If the farmers can figure out how to get this bean crop in a bin. -- and they have in the past given the kind of incentive they have today to be able to do just that.
we should see a $1.25 to 1.75 rally in beans and a .45-.70 rally in corn.
the lack of anything to fear from the shorts may dampen those levels.
Thanks for your thoughts!
Seasonals, as seen below don't usually bottom until early October, when harvest has progressed quickly but each year is different.
This one is alot different.
We have a record smashing crop/new crop supply. We spiked to new lows in a typical time frame(but a couple of weeks early) last week. But the weather has turned horrible for harvesting and instead of the harvest pressure coming all at once, it will be staggered out.
Wet weather during harvest, usually only delays the harvest and does not effect the size of the crop. If we suddenly cleared out and the market felt that widespread harvesting would resume, I feel that we would get an increase in selling pressure.
With regards to your predictions:
"we should see a $1.25 to 1.75 rally in beans and a .45-.70 rally in corn."
+70c for corn would be higher than the highs of late May......in fact, highest price in a couple of years and outside of a couple of Summer weather scares, the highest in 4 years.
+1.75 would be above $10 for beans...........and with South America planting a record crop that seems almost impossible with the most bearish fundamantals in over a decade.
The good news about the beans is that South America will run out of them before their new crop is harvested if China only buys SA beans. So our beans will have to make it to China somehow.
Whether SA buys our beans and sells them to China or some other deal is worked out, I don't know but it's a global market and China needs more beans then SA can supply. Maybe China can cut back?
Of course SA will be planting more beans with expectations of this increasing demand and higher prices for them. In fact, early planting of beans in Brazil was off to a very fast start because of this. Those early beans, if harvested when SA is running out will fetch a nice premium.
corn seasonal lows were 330.25 on 9-18 so .75 leaves us at 405.00 with falling ending stock it maybe to the top end but not Impossible IMO
beans low at 812.25 on same date add 1.75 leaves on at 985 ish area most certainly not impossible when considered against a high of 10.80 ish the 67% retracement from high to low would be $1.79 HMMMM
Makes sense from the spike low and good reasoning.
High in beans was 10.60
I know seasonally, if we haven't bottomed, we have to be close, but unless something drastic happens, selling beans at the $10 mark would have to be the trade of a lifetime.
If we don't start burning through bean ES, we could be looking at $6 beans in the next year.
correct on this years high being 10.60 - the contract high 10.80 ish
Yes Jim,
Soybean fundamentals are extraordinarily bearish.
https://www.agmanager.info/grain-marketing/grain-supply-and-demand-wasde
US Monthly Average Soybeans Price Received |
| Year | Jan | Feb | Mar | Apr | May | Jun | Jul | Aug | Sep | Oct | Nov | Dec | Avg* |
|---|---|---|---|---|---|---|---|---|---|---|---|---|---|
| $/bu. | |||||||||||||
| 1960 | 2.01 | 1.99 | 1.99 | 2.02 | 2.00 | 1.97 | 1.97 | 1.99 | 1.97 | 1.94 | 1.96 | 1.99 | 1.98 |
| 1961 | 2.23 | 2.48 | 2.68 | 3.02 | 2.96 | 2.60 | 2.48 | 2.49 | 2.34 | 2.20 | 2.27 | 2.30 | 2.50 |
| 1962 | 2.32 | 2.32 | 2.34 | 2.38 | 2.36 | 2.34 | 2.35 | 2.33 | 2.25 | 2.23 | 2.30 | 2.35 | 2.32 |
| 1963 | 2.41 | 2.50 | 2.51 | 2.45 | 2.47 | 2.48 | 2.44 | 2.45 | 2.44 | 2.56 | 2.66 | 2.58 | 2.50 |
| 1964 | 2.65 | 2.57 | 2.55 | 2.45 | 2.36 | 2.35 | 2.34 | 2.35 | 2.51 | 2.55 | 2.57 | 2.71 | 2.50 |
| 1965 | 2.73 | 2.81 | 2.85 | 2.85 | 2.72 | 2.74 | 2.69 | 2.53 | 2.35 | 2.31 | 2.36 | 2.48 | 2.62 |
| 1966 | 2.67 | 2.77 | 2.71 | 2.78 | 2.90 | 3.04 | 3.37 | 3.49 | 2.97 | 2.78 | 2.80 | 2.82 | 2.93 |
| 1967 | 2.77 | 2.71 | 2.74 | 2.71 | 2.69 | 2.71 | 2.66 | 2.56 | 2.53 | 2.44 | 2.43 | 2.48 | 2.62 |
| 1968 | 2.53 | 2.57 | 2.57 | 2.56 | 2.58 | 2.54 | 2.52 | 2.51 | 2.40 | 2.32 | 2.40 | 2.42 | 2.49 |
| 1969 | 2.46 | 2.48 | 2.48 | 2.51 | 2.56 | 2.52 | 2.52 | 2.51 | 2.28 | 2.23 | 2.30 | 2.30 | 2.43 |
| 1970 | 2.36 | 2.40 | 2.42 | 2.48 | 2.52 | 2.60 | 2.72 | 2.65 | 2.66 | 2.77 | 2.86 | 2.77 | 2.60 |
| 1971 | 2.86 | 2.92 | 2.91 | 2.80 | 2.85 | 2.98 | 3.18 | 3.09 | 2.95 | 2.96 | 2.84 | 2.93 | 2.94 |
| 1972 | 2.92 | 3.00 | 3.20 | 3.37 | 3.35 | 3.32 | 3.34 | 3.36 | 3.26 | 3.13 | 3.38 | 3.95 | 3.30 |
| 1973 | 4.11 | 5.49 | 6.04 | 6.14 | 8.27 | 10.00 | 6.69 | 8.99 | 5.81 | 5.63 | 5.14 | 5.65 | 6.50 |
| 1974 | 5.87 | 6.07 | 5.96 | 5.15 | 5.21 | 5.13 | 6.11 | 7.55 | 7.32 | 8.17 | 7.44 | 7.03 | 6.42 |
| 1975 | 6.30 | 5.72 | 5.31 | 5.60 | 5.00 | 4.90 | 5.28 | 5.80 | 5.32 | 4.92 | 4.45 | 4.28 | 5.24 |
| 1976 | 4.46 | 4.50 | 4.46 | 4.52 | 4.87 | 6.16 | 6.73 | 6.07 | 6.65 | 5.90 | 6.11 | 6.56 | 5.58 |
| 1977 | 6.81 | 7.06 | 7.83 | 9.05 | 9.24 | 8.13 | 6.52 | 5.48 | 5.17 | 5.28 | 5.61 | 5.68 | 6.82 |
| 1978 | 5.75 | 5.53 | 6.20 | 6.49 | 6.77 | 6.69 | 6.40 | 6.21 | 6.20 | 6.26 | 6.41 | 6.49 | 6.28 |
| 1979 | 6.58 | 6.99 | 7.16 | 7.06 | 7.06 | 7.36 | 7.36 | 7.07 | 6.81 | 6.35 | 6.30 | 6.27 | 6.86 |
| 1980 | 6.39 | 6.20 | 5.94 | 5.63 | 5.76 | 5.91 | 6.75 | 7.18 | 7.59 | 7.68 | 8.18 | 7.80 | 6.75 |
| 1981 | 7.80 | 7.50 | 7.59 | 7.60 | 7.40 | 7.05 | 7.13 | 6.71 | 6.21 | 6.06 | 6.04 | 6.00 | 6.92 |
| 1982 | 6.13 | 6.04 | 5.99 | 6.17 | 6.27 | 6.12 | 5.99 | 5.59 | 5.22 | 5.06 | 5.34 | 5.46 | 5.78 |
| 1983 | 5.56 | 5.66 | 5.82 | 6.09 | 6.06 | 5.90 | 6.27 | 7.57 | 8.28 | 7.96 | 7.81 | 7.75 | 6.73 |
| 1984 | 7.85 | 7.28 | 7.68 | 7.83 | 8.12 | 7.99 | 6.95 | 6.50 | 6.09 | 6.07 | 6.01 | 5.82 | 7.02 |
| 1985 | 5.91 | 5.77 | 5.88 | 5.88 | 5.70 | 5.62 | 5.42 | 5.10 | 4.99 | 4.85 | 4.92 | 5.01 | 5.42 |
| 1986 | 5.16 | 5.18 | 5.23 | 5.23 | 5.25 | 5.19 | 5.11 | 4.99 | 4.85 | 4.55 | 4.64 | 4.67 | 5.00 |
| 1987 | 4.70 | 4.69 | 4.73 | 4.90 | 5.20 | 5.36 | 5.25 | 5.02 | 5.02 | 5.04 | 5.36 | 5.63 | 5.08 |
| 1988 | 5.73 | 5.96 | 6.05 | 6.39 | 6.98 | 8.18 | 8.50 | 8.33 | 7.93 | 7.53 | 7.43 | 7.53 | 7.21 |
| 1989 | 7.69 | 7.41 | 7.51 | 7.29 | 7.20 | 7.05 | 6.83 | 6.07 | 5.70 | 5.55 | 5.66 | 5.64 | 6.63 |
| 1990 | 5.65 | 5.56 | 5.65 | 5.82 | 5.97 | 5.88 | 5.97 | 6.00 | 5.99 | 5.88 | 5.78 | 5.72 | 5.82 |
| 1991 | 5.71 | 5.65 | 5.76 | 5.77 | 5.67 | 5.56 | 5.36 | 5.66 | 5.64 | 5.48 | 5.48 | 5.45 | 5.60 |
| 1992 | 5.54 | 5.59 | 5.67 | 5.66 | 5.87 | 5.94 | 5.59 | 5.40 | 5.36 | 5.26 | 5.36 | 5.61 | 5.57 |
| 1993 | 5.58 | 5.56 | 5.65 | 5.73 | 5.81 | 5.90 | 6.56 | 6.56 | 6.21 | 6.01 | 6.32 | 6.64 | 6.04 |
| 1994 | 6.72 | 6.71 | 6.73 | 6.57 | 6.77 | 6.72 | 5.92 | 5.58 | 5.47 | 5.30 | 5.36 | 5.41 | 6.11 |
| 1995 | 5.47 | 5.40 | 5.51 | 5.55 | 5.56 | 5.68 | 5.90 | 5.83 | 5.98 | 6.16 | 6.40 | 6.76 | 5.85 |
| 1996 | 6.78 | 7.00 | 7.00 | 7.43 | 7.69 | 7.41 | 7.62 | 7.82 | 7.79 | 6.94 | 6.90 | 6.91 | 7.27 |
| 1997 | 7.13 | 7.38 | 7.97 | 8.23 | 8.40 | 8.16 | 7.52 | 7.25 | 6.72 | 6.49 | 6.86 | 6.72 | 7.40 |
| 1998 | 6.69 | 6.57 | 6.40 | 6.26 | 6.26 | 6.16 | 6.14 | 5.43 | 5.25 | 5.18 | 5.39 | 5.37 | 5.93 |
| 1999 | 5.32 | 4.80 | 4.61 | 4.63 | 4.50 | 4.44 | 4.19 | 4.39 | 4.57 | 4.48 | 4.45 | 4.43 | 4.57 |
| 2000 | 4.62 | 4.79 | 4.91 | 5.00 | 5.19 | 4.93 | 4.53 | 4.45 | 4.59 | 4.45 | 4.55 | 4.78 | 4.73 |
| 2001 | 4.68 | 4.46 | 4.39 | 4.22 | 4.33 | 4.46 | 4.79 | 4.85 | 4.53 | 4.09 | 4.16 | 4.20 | 4.43 |
| 2002 | 4.22 | 4.22 | 4.38 | 4.47 | 4.64 | 4.88 | 5.35 | 5.53 | 5.39 | 5.20 | 5.46 | 5.46 | 4.93 |
| 2003 | 5.51 | 5.55 | 5.59 | 5.82 | 6.07 | 6.09 | 5.82 | 5.68 | 6.06 | 6.60 | 7.05 | 7.17 | 6.08 |
| 2004 | 7.35 | 8.28 | 9.28 | 9.62 | 9.56 | 9.08 | 8.46 | 6.83 | 5.84 | 5.56 | 5.36 | 5.45 | 7.56 |
| 2005 | 5.57 | 5.42 | 5.95 | 6.03 | 6.20 | 6.58 | 6.84 | 6.15 | 5.77 | 5.67 | 5.62 | 5.77 | 5.96 |
| 2006 | 5.88 | 5.67 | 5.57 | 5.52 | 5.68 | 5.61 | 5.61 | 5.23 | 5.24 | 5.52 | 6.07 | 6.18 | 5.65 |
| 2007 | 6.38 | 6.87 | 6.95 | 6.88 | 7.13 | 7.51 | 7.56 | 7.72 | 8.18 | 8.36 | 9.41 | 10.00 | 7.75 |
| 2008 | 9.96 | 11.70 | 11.50 | 12.00 | 12.10 | 13.20 | 13.30 | 12.80 | 10.70 | 9.94 | 9.38 | 9.24 | 11.32 |
| 2009 | 9.97 | 9.55 | 9.12 | 9.79 | 10.70 | 11.40 | 10.80 | 10.80 | 9.75 | 9.44 | 9.53 | 9.80 | 10.05 |
| 2010 | 9.79 | 9.41 | 9.39 | 9.47 | 9.41 | 9.45 | 9.79 | 10.10 | 9.98 | 10.20 | 11.10 | 11.60 | 9.97 |
| 2011 | 11.60 | 12.70 | 12.70 | 13.10 | 13.20 | 13.20 | 13.20 | 13.40 | 12.20 | 11.80 | 11.70 | 11.50 | 12.53 |
| 2012 | 11.90 | 12.20 | 13.00 | 13.80 | 14.00 | 13.90 | 15.40 | 16.20 | 14.30 | 14.20 | 14.30 | 14.30 | 13.96 |
| 2013 | 14.30 | 14.60 | 14.60 | 14.40 | 14.90 | 15.10 | 15.30 | 14.10 | 13.30 | 12.50 | 12.70 | 13.00 | 14.07 |
| 2014 | 12.90 | 13.20 | 13.70 | 14.30 | 14.40 | 14.30 | 13.10 | 12.40 | 10.90 | 9.97 | 10.20 | 10.30 | 12.47 |
| 2015 | 10.30 | 9.91 | 9.85 | 9.69 | 9.58 | 9.58 | 9.95 | 9.71 | 9.05 | 8.81 | 8.68 | 8.76 | 9.49 |
| 2016 | 8.71 | 8.51 | 8.56 | 9.04 | 9.76 | 10.20 | 10.20 | 9.93 | 9.43 | 9.30 | 9.46 | 9.64 | 9.40 |
| 2017 | 9.71 | 9.86 | 9.69 | 9.32 | 9.26 | 9.10 | 9.42 | 9.24 | 9.35 | 9.18 | 9.22 | 9.30 | 9.39 |
| 2018 | 9.30 | 9.49 | 9.81 |