
Hello November! Just another new month? Do something special for somebody this month! Seriously, don't just think about it for a moment......plan it now.
Scroll down and enjoy the latest comprehensive weather to the max!!
The latest rain forecasts for the next week are below.
Rains shift east with the current soaker. New rains emerge over the weekend in the Western Belt and increase eastward, with the next big one. Heaviest in the eastern and southern Cornbelt again.
Day 1 below:
http://www.wpc.ncep.noaa.gov/qpf/fill_94qwbg.gif?1526306199054

Day 2 below:
http://www.wpc.ncep.noaa.gov/qpf/fill_98qwbg.gif?1528293750112

Day 3 below:
http://www.wpc.ncep.noaa.gov/qpf/fill_99qwbg.gif?1528293842764

Days 4-5 below:
http://www.wpc.ncep.noaa.gov/qpf/95ep48iwbg_fill.gif?1526306162

Days 6-7 below:
http://www.wpc.ncep.noaa.gov/qpf/97ep48iwbg_fill.gif?1526306162

7 Day Total precipitation below:
http://www.wpc.ncep.noaa.govcdx /qpf/p168i.gif?1530796126

Excessive Rain threat
Shifting east.
Day 1 Threat Area in Text Format
Current Day 2 Forecast |
Day 3 forecast below
Severe Storm Risk.
Southeast.
https://www.spc.noaa.gov/products/outlook/
Current Day 1 Outlook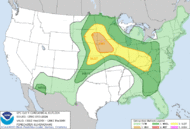 | |
Current Day 2 Outlook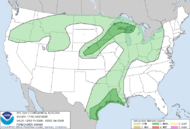 | |
Current Day 3 Outlook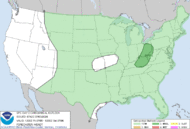 | |
Current Day 4-8 Outlook |
Here are the latest hazards across the country. Green is flooding. Brown is wind, Gray is fog. Reddish is a red flag advisory. Purple/Pink is cold/Winter weather.
See the rest at the link below.
https://www.spc.noaa.gov/ Go to "hazards"


| Low Temperatures Thursday Morning |

High Temperatures today and Friday.
Warm air in the far Southeast today. Warm in the West. Near average in the Center.


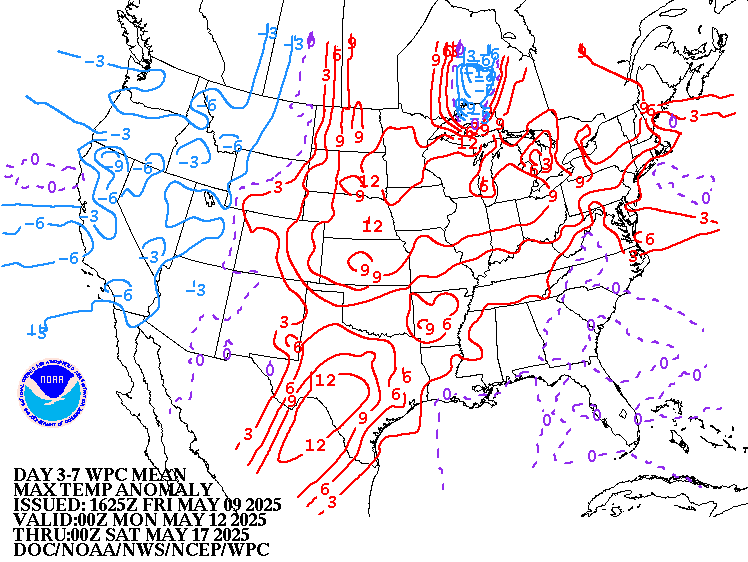
Highs for days 3-7:
Mild initially, COLD BLAST Northcentral hits early next week and spreads east/southeast.

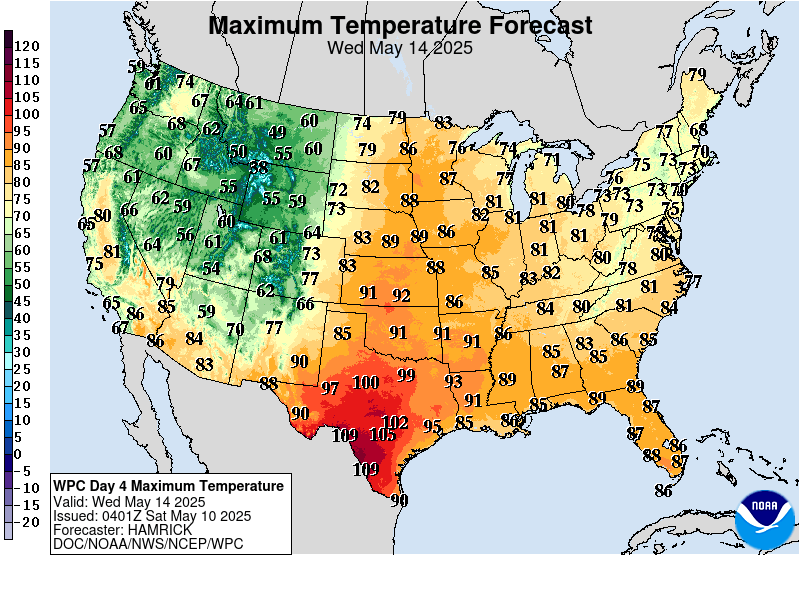


How do these days 3-7 temperatures compare to average at this time of year?
Not too far from average initially.
Cold blast in the Plains/Midwest late in this period will result in the area and magnitude of blue's increasing tomorrow and for numerous days ahead!
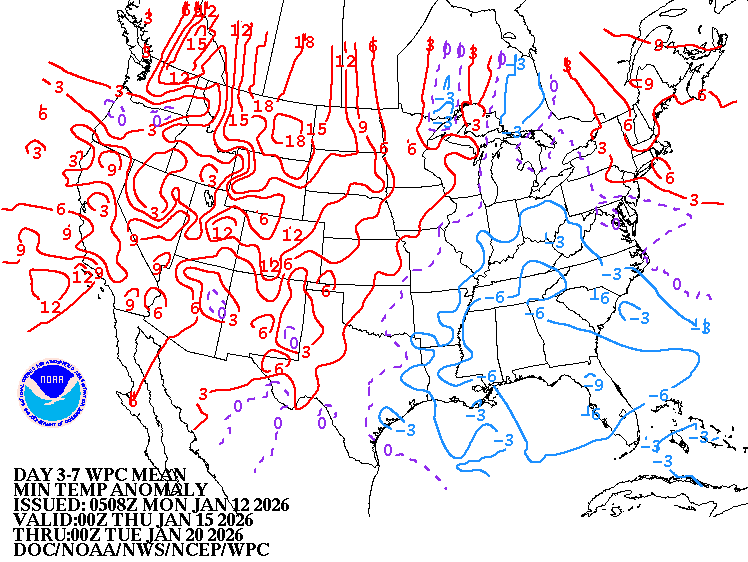
Low Temperature Departures:
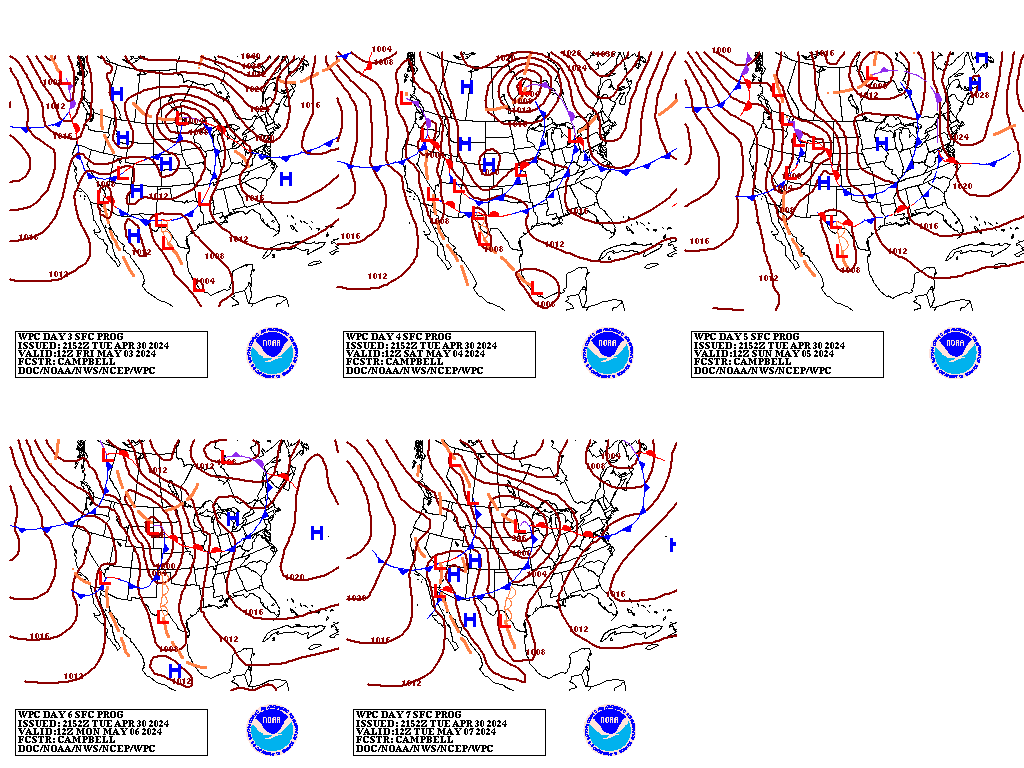
Surface features for the same 3-7 day period:
Very active. Major cold air intrusion early next week with reinforcing cold fronts later in the week...high confidence!!!
Current Dew Points
Moisture being ushered east. Dry air in the Plains/Western/Upper Midwest pouring in temporarily!!!

Latest radar loop
Heavy showers moving east now.
http://www.nws.noaa.gov/radar_tab.php

| Full resolution version loop (3400x1700 pixels - 2.2mb) |

Rains the past 24 hours
Some very heavy amounts along and Southwest of the Ohio River.
![]()
You can go to this link to see rain totals from recent time periods:
https://water.weather.gov/precip/
Go to precipitation, then scroll down to pick a time frame. Hit states to get the borders to see locations better. Under products, you can hit "observed" or "Percent of normal"
+++++++++++++++++++++++++++++++++++++++++++++++
Soil moisture anomaly:
Still wet on this particular metric in an enormous area. Getting MUCH wetter in the East this week and next week. Rain in the forecast in the WCB this weekend.
+++++++++++++++++++++++++++++++++++++
Rains compared to average for the last 7, 14, 30 and 60 days.
Usually not updated for previous day until late the next day.
Note how incredibly wet it's been over the past 60 days over eastern 2/3rds of the country! It's going to get even wetter!
Texas has been the wet state the past 30 days.
https://www.atmos.illinois.edu/~snodgrss/Ag_Wx.html


The top map is the Canadian ensemble average, the maps below are the individual members that make up the average
End of week 2....................0Z ensembles from Thursday. MUCH different today. This is just one model and others disagree but we have the cold completely cut off from the US and very mild temperatures spreading across the country on the vast majority of members.
++++++++++++++++++++++++++++++++++++++++++++++++++++++++++++++
Each member is like the parent, Canadian model operational model.......with a slight tweek/variation in parameters. Since we know the equations to represent the physics of the atmosphere in the models are not perfect, its useful to vary some of the equations that are uncertain(can make a difference) to see if it effects the outcome and how.
The average of all these variations(ensembles) often yields a better tool for forecasting. It's always more consistent. The individual operational model, like each individual ensemble member can vary greatly from run to run.........and represent an extreme end of the spectrum at times. The ensemble average of all the members, because it averages the extremes.............from opposite ends of the spectrum.........changes much less from run to run.
360h GZ 500 forecast valid on Nov 16, 2018 00 UTC
Here are the 0Z GFS ensemble, individual solutions at 360 hours(2 weeks).
This model is colder than the Canadian ensembles because it has northern stream energy aimed at the US on several member solutions.
Still significant disagreement in a key area. How pronounced will an upper level ridge in the vicinity of Western Canada be/and where will it be located?
If it does amplify greatly, then downstream troughing will lead to cold air intrusions. If it doesn't, then a strong Pacific jet stream blows zonally and keeps the US mild. ...........like the Canadian ensembles think.

Latest, updated graph/forecast for AO and NAO here, including an explanation of how to interpret them.
The AO is no longer dipping strongly negative like yesterday. This lowers the risk of Arctic blasts in mid November.......less extreme cold risks today. There is still alot of spread in the forecast, so great uncertainty also continues.
The NAO is also predicted to be around 0 at the end of 2 weeks..........so not a strong consideration in the forecast.
Just like weather maps having less skill in the later periods, the same is the case with the AO/NAO.
https://www.marketforum.com/forum/topic/15793/
National Weather Service 6-10 day, 8-14 day outlooks.
Updated early this afternoon.
Temperature Probability | |
Precipitation Probability | |
| the 8-14 day outlooks ArchivesAnalogsLines-Only FormatGIS Data | |
Temperature Probability | |
 | |
The Madden Julian Oscillator(MJO), which is in phase 8 right now, will be strengthening a bit(very weak right now) and going thru phases 1-2-3, then be at phase 4 at the end of 2 weeks.
This would cause an increase in chances for warm weather in the US, especially the Central part of the country.
However, the MJO is a measurement in the southern stream. If the northern stream, dominated and the AO and NAO is much stronger than the southern stream, it doesn't matter what phase the MJO is in because the MJO signal will be diverted to the south(stay closer to the tropics).
The AO and NAO are near 0 at 2 weeks, which is neutral but models disagree tremendously.
http://www.cpc.ncep.noaa.gov/products/precip/CWlink/MJO/mjoupdate.pdf
12z GFS is much milder again in the later period.........like the run 12 hours ago and similar to the warmest model, the Canadian.
The ones 6, 18 and 24 hours ago were much colder.
My forecast philosophy from earlier lines up better with the mild solution but with low confidence.
edit: I was in the hospital with my wife having an endoscopy earlier, looking at just several GFS maps when making the above comments. On closer inspection, that last GFS was not as mild as I originally thought...........with 2 intrusions of Arctic air(that are very shallow and short lasting and mainly the northern states on the 2nd one) but the upper level pattern itself, does not look nearly as cold as the colder ones listed above because we don't have an upper level low anchored in SE Canada on this solution...........in fact, we just have fast moving upper level troughs that capture/tap into brief shots of Arctic cold that pools in Canada that are quickly blown out by the mild, west to east blowing southern/Pacific stream.
But this is just one solution and the analysis is going to be something different next time for the week 2 period of this individual solution.......so take it with a grain of salt.
Maybe I'm wrong and I've mentioned it before, but the warm start to November is pushing out to maybe a warmer end of month. The colder weather just keeps hanging around.
This is just anecdotal, but it always seems to me that when we have a chilly October, that usually portends what we are going to get for the rest of the winter.
No correlation to October weather and Winter weather.
The just updated 12z European model is light years different early in week 2. It's been leading the charge with cold crashing into the Northeast early in week 2.
Now, it has the complete opposite with an impressive upper level low in sw Canada, with a southern jet stream blowing under it across the country and building upper level ridging along the East Coast/off the East Coast, where is will warm way up early in week 2 with strong south winds.
Some cold will get down into the Western and Central US with this pattern.
The last run of the GFS ensembles is the opposite of this, with a ridge west, trough east couplet during week 2, which would cause it to be warm West, cold East.
The warmest model by far later in week 2 was the Canadian model overnight, which now, it not as warm.
Geeeesh, I give up (-:
I'll still go with the decreasing risk of cold outbreaks in mid November that looked more impressive yesterday. .............until the next model updates muddy the weather waters again.