Happy November 28th. Just another day? Do something nice for somebody. Seriously, don't just think about it for a moment......do it now.
Scroll down and enjoy the latest comprehensive weather to the max.
Warming up later this week in many places with heavy rains. More cold and even snow in other places.
Here are the latest hazards across the country. Settling down.
Purple/Pink/blue is cold/Winter weather. Brown is wind, Green is flooding. Gray is fog. Reddish is a red flag advisory.
Go to the link below, then hit the location/county on the map for details.
https://www.spc.noaa.gov/ Go to "hazards"

Winter Weather
https://www.wpc.ncep.noaa.gov/wwd/winter_wx.shtml

Snowfall forecast for the next 3 days below:
Forecast Hour: 084
Image URL: http://mag.ncep.noaa.gov/data/nam/12/nam_namer_084_snodpth_chng.gif

| Low Temperatures Tomorrow Morning |

High Temperatures today and tomorrow.
Cold recedes!


Highs for days 3-7:
Warming up south and east. New blast of cold Rockies/NorthCentral this weekend that shifts southeast next week.
Increasing temperature gradient.


How do these days 3-7 temperatures compare to average at this time of year?
Warm red anomalies increasing this week in the South and East. Cold West to Plains.

Low Temperature Departures:

Surface features for the same 3-7 day period:
HUGE storm late this week with widespread precip..........mostly rain(heavy in places, especially east and south) but some snow in the cold northwest sector of the Winter Storm. Big warm up east, ahead of the storm, then sharply colder next week behind the storm.

The latest liquid equivalent precip forecasts for the next week are below.
Mostly Quiet midweek.
New storm late week. HEAVY Widespread precip! Most of it should be rain.
However, Snow gets back into the picture as the storm tracks north into the colder air.
Day 1 below:
http://www.wpc.ncep.noaa.gov/qpf/fill_94qwbg.gif?1526306199054

Day 2 below:
http://www.wpc.ncep.noaa.gov/qpf/fill_98qwbg.gif?1528293750112

Day 3 below
http://www.wpc.ncep.noaa.gov/qpf/fill_99qwbg.gif?1528293842764

Days 4-5 below:
http://www.wpc.ncep.noaa.gov/qpf/95ep48iwbg_fill.gif?1526306162

Days 6-7 below:
http://www.wpc.ncep.noaa.gov/qpf/97ep48iwbg_fill.gif?1526306162

7 Day Total precipitation below:
http://www.wpc.ncep.noaa.govcdx /qpf/p168i.gif?1530796126

Now from this storm.
Forecast Hour: 084
Image URL: http://mag.ncep.noaa.gov/data/nam/12/nam_namer_084_snodpth_chng.gif
Current Dew Points
Bone dry air everywhere.

Latest radar loop
http://www.nws.noaa.gov/radar_tab.php

| Full resolution version loop (3400x1700 pixels - 2.2mb) |

Go to: Most Recent Image
Precipitation the past 24 hours
![]()
You can go to this link to see precipitation totals from recent time periods:
https://water.weather.gov/precip/
Go to precipitation, then scroll down to pick a time frame. Hit states to get the borders to see locations better. Under products, you can hit "observed" or "Percent of normal"
+++++++++++++++++++++++++++++++++++++++++++++++
Soil moisture anomaly:
Still wet on this particular metric in an enormous area.

+++++++++++++++++++++++++++++++++++++
Precipitation compared to average for the last 7, 14, 30 and 60 days.
Been pretty dry the last few weeks.............that will change late this week.
Usually not updated for previous day until late the next day.
https://www.atmos.illinois.edu/~snodgrss/Ag_Wx.html


The top map is the Canadian ensemble average, the maps below are the individual members that make up the average
End of week 2....................0Z ensembles from Wednesday:
From Friday: Big disparity still. Some are very cold with northern stream a major player. Along with that, is the risk that part of the polar vortex will take another excursion unusually far south. This would replenish the frigid weather reservoir to Canada, that gets depleted leading up to this period.
Some have mild/zonal flow that cuts off the cold.
Saturday: Big change, actually huge change. The vast majority now are milder. Very few show the threat for the polar vortex to shift south
.
Sunday: The average, deceptively looks zonal. Numerous members look colder than yesterday, with some now back to featuring the polar vortex shifting south again. However, the disparity is huge. I am very low confidence for this time frame. It could be mild or morph back to extreme cold.
Monday: This particular model looks pretty mild late in week 2.
Tuesday: This model and almost all the solutions are looking VERY mild
Wednesday: Several solutions now plunge the polar vortex and northern stream south. Intense cold risks elevated vs the past few days. No strong agreement.
++++++++++++++++++++++++++++++++++++++++++++++++++++++++++++++
Each member is like the parent, Canadian model operational model.......with a slight tweek/variation in parameters. Since we know the equations to represent the physics of the atmosphere in the models are not perfect, its useful to vary some of the equations that are uncertain(can make a difference) to see if it effects the outcome and how.
The average of all these variations(ensembles) often yields a better tool for forecasting. It's always more consistent. The individual operational model, like each individual ensemble member can vary greatly from run to run.........and represent an extreme end of the spectrum at times. The ensemble average of all the members, because it averages the extremes.............from opposite ends of the spectrum.........changes much less from run to run.
360h GZ 500 forecast valid on Dec 13, 2018 00 UTC


0Z GFS Ensembles
Friday: A great deal of uncertainty at this time frame but still leaning strongly to cold for this model! Threat for polar vortex to start moving south again is elevated today.
Upper level trough somewhere.
Saturday: This model hasn't changed that much since Friday(but less threat for polar vortex shifting south). Looks like alot of widespread precip with an upper level trough and coldest temps west(possibly milder east of the Upper trough)
Sunday: This model has done best for week 2 recently. It looks even a bit colder in the East now. It also looks MUCH drier, with the northern stream dominating and southern stream out of the picture.
Canada's supply of frigid air will be replenished so cold fronts could pack some punch.
Monday: This model continues to be the coldest solution. A ridge west(mild)/trough east(cold) couplet can be seen on the majority of solutions.
Tuesday: Forget the ridge west/trough east solutions from yesterday, much milder flow with the cold air cut off.
Wednesday: This model still looks mostly mild.

Latest, updated graph/forecast for AO and NAO here, including an explanation of how to interpret them.
Friday: Huge change late in the period. Negative AO and NAO, after bouncing back, on all members crash to extremely low values and the end of 2 weeks...............on a slight majority, while on a minority, keep going higher and even poke above zero.The spread/disparity is "off the charts" especially with the AO but the average is MUCH colder than yesterday/Thursday.
Saturday: Not nearly as cold as Friday. AO and NAO still negative but closer to 0 as week 2 goes on(especially the NAO).
NAO close to 0 vs strongly negative reduces cold risks in the East.
Sunday: Similar to Saturday. Both the AO and NAO increase to just sub zero at the end of 2 weeks. Massive disparity on the AO with a few strongly positive now for the first time in awhile, while others are solidly negative.The average is often not the best indicator in this case because there are too many that disagree with the average. Great uncertainty with the potential for either extreme almost as high as something in the middle.
Monday: AO and NAO bounce back near 0 quicker, during week 2. Then they stay around zero(NAO) to just below zero(AO) in week 2.
The spread is also less than recent solutions. But it will change tomorrow (-:
Tuesday: NAO gets to, and stays around 0, so not a big deal without alot of spread. AO is much more uncertain. A very wide spread in solutions, some around 0 but now, several in deep negative territory as week 2 progresses.
Wednesday: Very wide spread and uncertainty. The NAO is close to zero, however, the AO is solidly negative which increases cold risks..........for now.
National Weather Service 6-10 day, 8-14 day outlooks.
Updated early this afternoon.
Temperature Probability | |
Precipitation Probability | |
| the 8-14 day outlooks ArchivesAnalogsLines-Only FormatGIS Data | |
Temperature Probability | |
 | |
By WxFollower - Nov. 24, 2018, 10:59 p.m.
Mike,
Per history, with El Niño likely not getting any stronger than low end moderate, that is actually often a cold rather than warm signal for at least much of the eastern half of the US. I wasn’t sure if you realized this. Many of the coldest winters in the E US were actually weak to low end moderate El Niño’s: 1884-5, 1885-6, 1904-5. 1911-12, 1939-40, 1963-4. 1968-9, 1969-70, 1976-7, and 1977-8.
Then again, we still have -AAM, which is most often associated with La Nina and usually not as cold for much of the E US. Having the -AAM in combo with El Nino is quite unusual from what I learned from Radiant though I wonder if it will hang on through winter.
Does anyone have a link to an historical monthly AAM table?
++++++++++++++++++++++++++++++++++++++++++++
By metmike - Nov. 25, 2018, 2:10 p.m.
Good points on the weak El Nino correlating with more colder than average Winters in the East.
Maybe it's because the southern stream generated from El Nino was not strong enough to have an impact far enough downstream to deflect the northern stream, so the northern stream dominated:
https://www.climate.gov/news-features/featured-images/us-winter-temperatures-every-el-ni%C3%B1o-1950

+++++++++++++++++++++++++++++++++++++++
years ago, I don't put alot of stock in the accuracy of the magnitude since there were no widespread accurate measurements from that time frame.
No doubt they had trade winds recorded and barometric pressures (and differences) at some locations that would be useful in getting a ball park type figure, maybe even a guess but the actual sea surface temp data needed to assess this metric was not there.
+++++++++++++++++++++++++++++++++++
By metmike - Nov. 25, 2018, 2:43 p.m.
"Then again, we still have -AAM, which is most often associated with La Nina and usually not as cold for much of the E US."
My first thought was that La Nina's are cold in the East and memory tells me that some very strong La Nina's have featured extreme cold in the Midwest and East, however I checked and what you stated, not as cold in the East seems to be what's out there on the internet. I am skeptical.
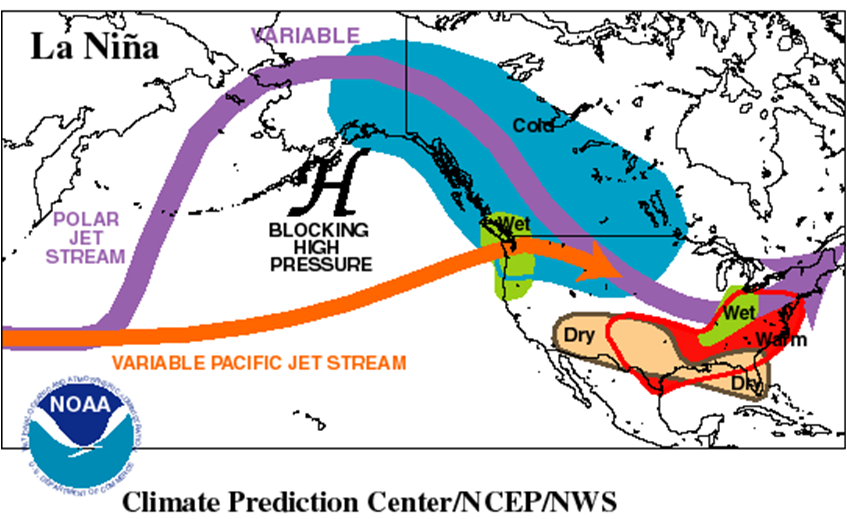
To me, this flow diagram does not make sense meteorologically..........unless you shifted the weather to the east/right several hundred miles.
A high pressure ridge to Alaska and Western Canada will feature mild Winter conditions there, not cold.
The blue cold, would be escorted south, much farther east INTO the deep trough from the Midwest to the East Coast.
+++++++++++++++++++++++++++++++++++++++++++
By metmike - Nov. 25, 2018, 2:46 p.m.
I don't have any AAM historical data and have not studied this a great deal.
Thanks for bringing this up though Larry so that I can learn more about it.
++++++++++++++++++++++++++++++++
By WxFollower - Nov. 25, 2018, 4:30 p.m.
1. I just found out I was wrong about there still being -AAM. It was that way in Sep. but it turned to +AAM in Oct and has become strongly +AAM this month. So, disregard my concern about how El Nino tends to be with -AAM.
2. Looking at records, the SE US and Mid Atlantic (I think to at least NYC) has averaged colder during weak to moderate El Nino than all La Nina's averaged out. I think the upper Midwest and most of the plains has averaged colder in La Nina. I'm not sure about the lower Midwest though I lean toward warmer in La Nina for Cincinatti.
3. IMO, there is plenty of data to suggest what years were El Nino and what were La Nina including SOI and various SST data. I've been using this for ~15 years.
+++++++++++++++++++++++++++++++++++++++
By Jim_M - Nov. 26, 2018, 10:22 a.m.
Back in October, the NWS 3-4 week experimental forecast was predicting a warmer second half of November. Obviously that didn't happen. The cold keeps rolling, and it looks like we will have 2 more withdrawals now. This week and next.
NG has been dropping the last week or 2, but the potential for those spikes is very intimidating, no matter what direction you are trading. And with the chilly weather, those spikes are a very real possibility. I read that some trading firms went belly up with that last spike.