Not Trading,just posting my system .
.
MINE ....
MINE ....
MINE ....


... this is the best "Accumulate"
trades I have seen in quite a while
... DEFINATELY... the best long term trend on the Commodities ticker-boards as we speak ......
=======================
... look at all of the
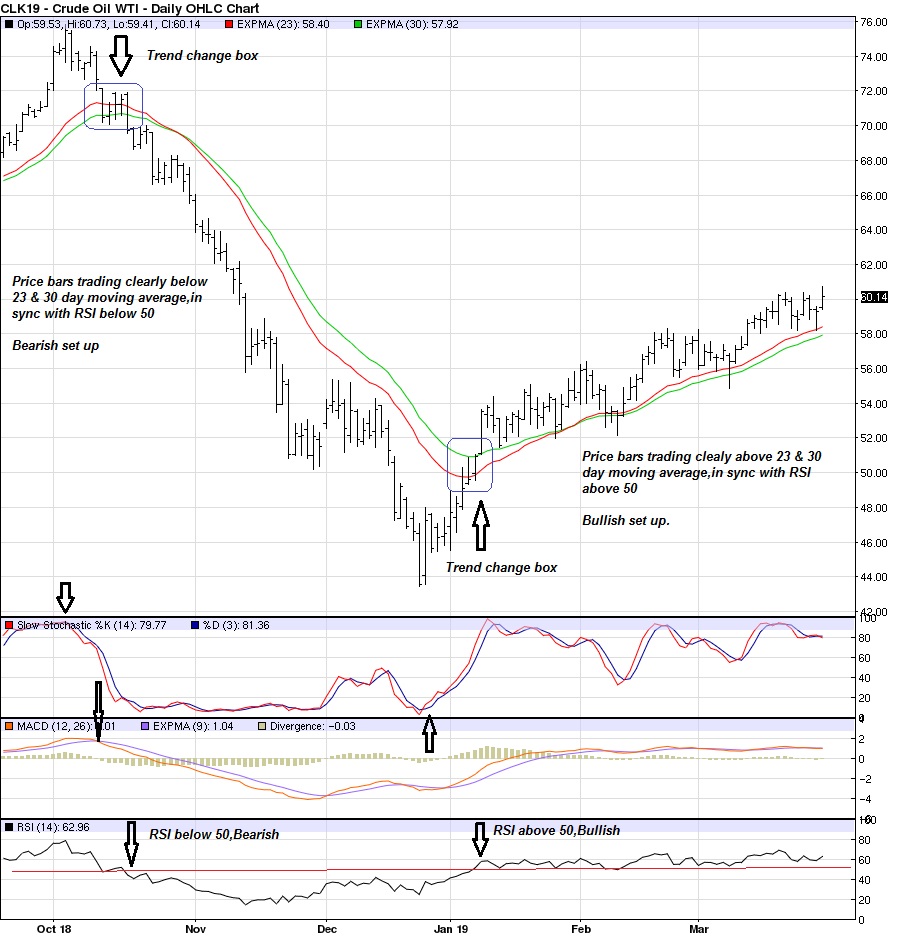
"SPIDER LEGS" to the downside @ 58.81 on a Daily K-May Chart (*highlighted with the "greene ray @ 58.81 horizontally*)....
.... that was some serious "HOOVER' sucking/BUYING Black Hole..... yep .... 45 degree angle... TIME & PRICE are both in perfect syncopation to escalte the herd of elephants that are chargin up a 45 degree angle of formulated "STEPPING STONES"....
IT IS "GO=TIME" DUDE !!!


..... this trade is like a herd of elephants climbing the stepping stones of a 45 degree angle where "TIME AND PRICE"
are both in SYNCOPATION !!!!
... by some weird chance .....59.32 on a tweet ...lmfao ...
... by some weird chance .....59.32 on a tweet ...lmfao ...
.... do you know what this trade reeks of ... ?!?!??!??!
59.32 and ganja X 32 contracts of WTI .... everybody back off .....


Crude chart and S&P chart look the same, except S&Ps are near all time highs on the long term chart and crude isn't.
Even the intraday charts are tracking together.