
Wheat weather:
Sunday Weather: Warmer!
https://www.marketforum.com/forum/topic/29970/
Monday Weather:
https://www.marketforum.com/forum/topic/30066/
Tuesday Weather: Heat ridge more impressive-storms/rain late week bullish
https://www.marketforum.com/forum/topic/30177/
Wednesday: Heat ridge breaks down towards the end of week 2-heavy rain forecasts late this week into early/mid next week.
https://www.marketforum.com/forum/topic/30239/
Weather Thursday:
https://www.marketforum.com/forum/topic/30279/
Friday Weather: Heavy rains next week around a big Heat ridge in the Southeast.
https://www.marketforum.com/forum/topic/30354/
Saturday Weather:
https://www.marketforum.com/forum/topic/30434/
Sunday Weather: Excessive rains still coming
https://www.marketforum.com/forum/topic/30501/
Monday Weather: Excessive rains this week(Plains/WCB but changes down the road.........maybe
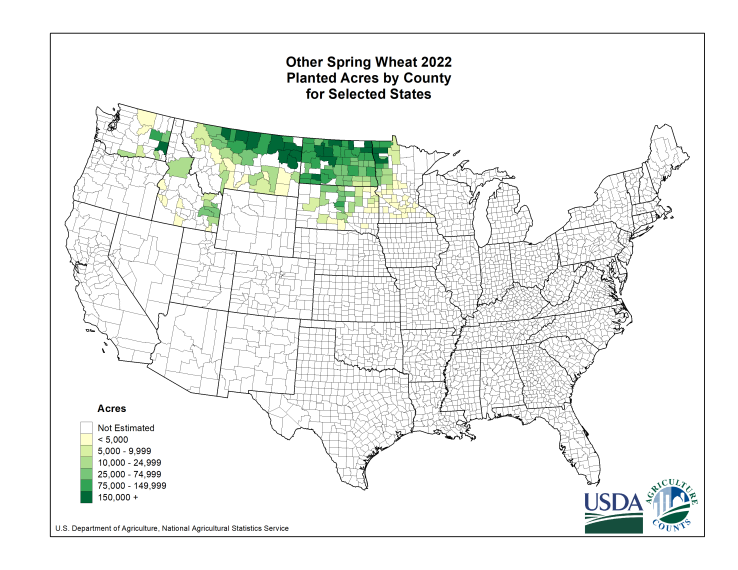
Areas of the country that grow Winter wheat:


https://www.cmegroup.com/trading/agricultural/files/ht_charts/snd_cbt.pdf
WHEAT: The May USDA Supply & Demand and Production report for wheat was considered bearish with 2018-19 US wheat ending stocks coming in at 1.127 billion bushels versus the average estimate of 1.096 billion bushels (1.038-1.187 billion range) and compared to 1.087 billion in April. 2018-19 World ending stocks came in at 274.98 million tonnes versus the average estimate of 276.2 million tonnes (274.1-282.9 million range) and compared to 275.6 million in April. The 2019-20 US ending stocks came in at 1.141 million bushels versus the average estimate at 940 million bushels from a range of 881 to 1.173 billion bushels. The 2019-20 World ending stocks came in at 293.01 million tonnes versus the average estimate of 277.2 million tonnes from a range of 265.0 to 285.0 million tonnes. The US All Wheat production came in at 1.897 versus the average estimate 1.911 billion bushels (range 1.779-2.044 billion) and compared to last year's 1.884 billion. Total Winter wheat came in at 1.268 billion bushels versus the average estimate at 1.282 billion (1.116-1.406 range) and compared to 1.184 billion last year. The Hard Red wheat came in at 780 million bushels versus the average estimate at 766 million and compared to 662 million last year. Soft Red wheat came in at 265 million bushels versus the average estimate at 280 million bushels and compared to 286 million last year. White winter wheat came in at 224 million bushels versus the average estimate at 235 million bushels and compared to 236 million last year. PRICE OUTLOOK: Both old crop and new crop US ending stocks figures were above the average estimates. The USDA cut 2018-19 exports another 20 million bushels. The USDA also increased Russia's production to 77.0 million tonnes and the EU's to 153.8 million tonnes pushing 2019-20 world ending stocks to 293 million tonnes well above the estimates. July wheat next downside target is at 417 1/2 with resistance at 432. July KC wheat next downside swing target is at 383.5 with resistance at 399.5.
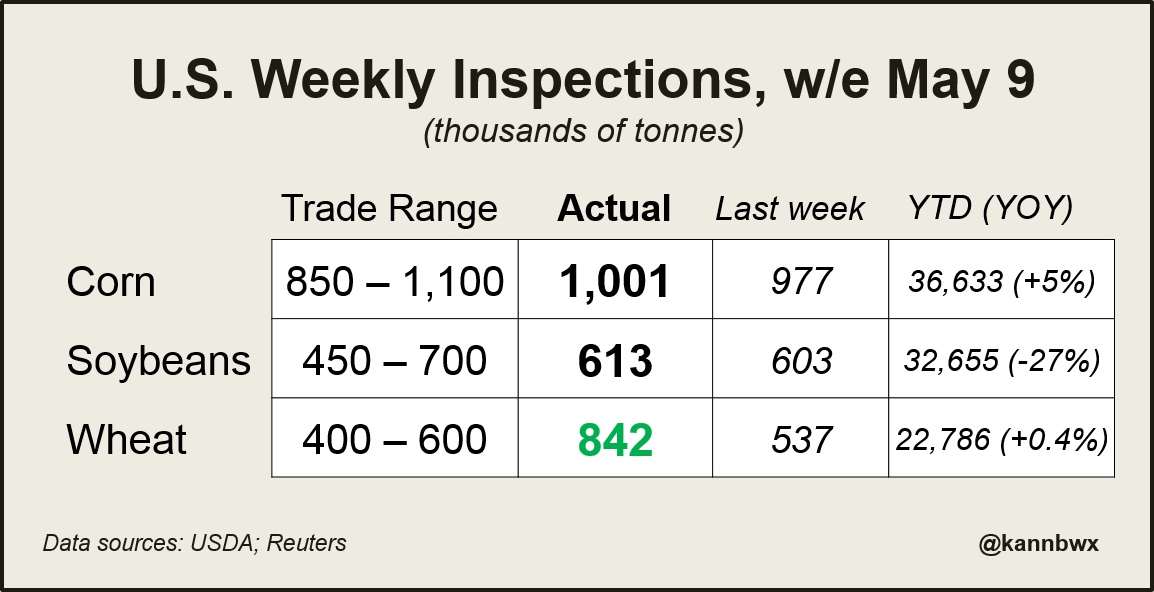
Export inspections. Corn and beans not so good. Wheat was excellent.
Karen BraunVerified account @kannbwx
Last week's U.S. #wheat inspections were the largest since Sept. 2016 and incl. 399k tonnes HRW and 210kt HRS. Some 272k tonnes of #soybeans were shipped to #China. #Corn inspections are now up 5% over last year, but they were up 7% last week (gap is closing).

Karen BraunVerified account @kannbwx
U.S. #wheat shipments certainly picked up in the 2nd half of 2018-19. Total shipments through May 9 were finally up fractionally over the previous year. USDA has 18/19 exports at 925 mbu versus 901 mbu in 17/18. The 19/20 forecast is 900 mbu.

Karen BraunVerified account @kannbwx
But for #wheat, production is seen outpacing consumption after crops rebound in Russia, EU, and others. The one that I would put in question is Australia, which often has droughts during El Nino, and that pattern is seen lingering potentially into 2020.

Karen BraunVerified account @kannbwx
Money managers hit an all-time combined grains & oilseeds net short of 700,460 fut+opt contracts in week ended May 7. April 30  May 7, # fut+opt contracts:
#Corn -306,699  -282,327
#Soybeans -148,526  -160,553 (record)
CBOT #wheat -83,502  -82,146
Meal -15,599  -33,135

Crop progress numbers:
https://release.nass.usda.gov/reports/prog2019.txt
Less planted corn than expected(by the market). Almost tied with 2013 as the slowest planting in the last 2 decades. More Spring Wheat planted than expected though. 45% done vs 35% expected.
U.S. planting progress, May 12:
#Corn 30% (23% last week, 66% average, trade guess 35%)
#Soybeans 9% (6% last week, 29% avg, trade guess 15%)
Spring #wheat 45% (22% last week, 67% avg, trade guess 35%)
Trade expectations for Crop Progress. Last year on May 12, #corn was 59% planted, #soybeans 32%, spring #wheat 54%. Five-year average for corn is 66%, soybeans 29%, spring wheat 67%.

mon wx updated
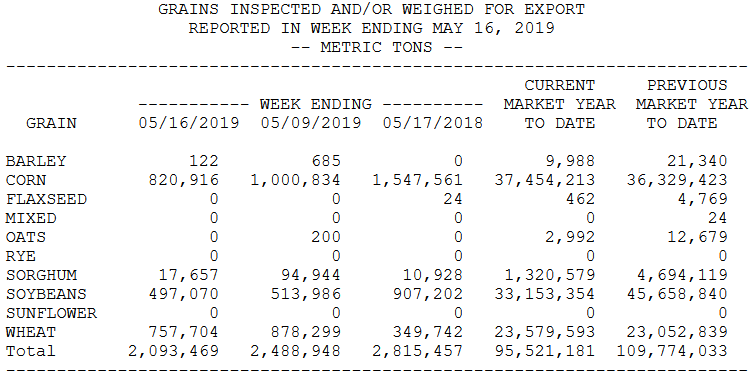
https://www.ams.usda.gov/mnreports/wa_gr101.txt
metmike: Exports good wheat, not so good S and C:
Darin D. Fessler @DDFalpha 21m21 minutes ago
Export Inspections (TMT):#corn#soybeans#wheat#sorghum#barley

Karen BraunVerified account @kannbwx 21m21 minutes ago
Table: Crop Progress Expectations 5 yr planting averages, May 19: #Corn 80%, #soybeans 47%, spring #wheat 80%. Slowest-ever May 19: corn 50% 1995; soy 12% 1983 Slowest May 19 post-2000: corn 68% 2009; soy 24% 2013#plant19

Karen BraunVerified account @kannbwx 1h1 hour ago
Here's what those weekly #wheat inspections look like with 2 weeks and 1 day left in 2018/19. The second half of the marketing year definitely trended upward.
