I had double posted this data below on the same thread yesterday and while trying to edit that today, accidentally deleted your post cliff-e. Sorry about that.
Can you please repost it(it was a good post actually thanking me). I switched the location of the graphs to put US sales to China at the top instead of the bottom)
Thx
Mike
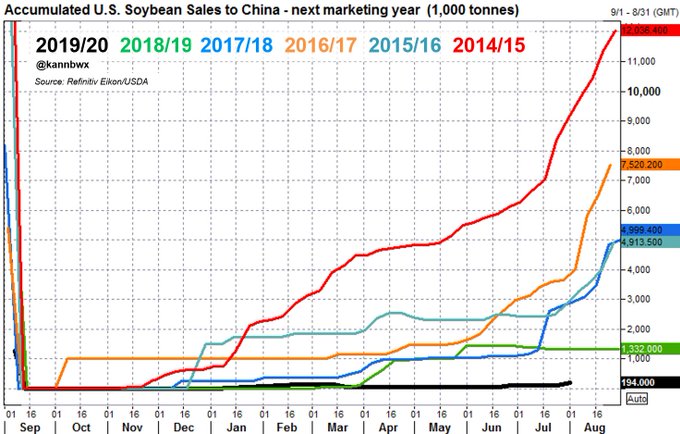
But don't forget, the U.S. imports are old sales made during the truce, not indicative of new demand. This chart is from July (sales thru 8/29 rose to 260,000 tonnes), but shows the same thing. #China basically hasn't bought any 19/20 U.S. #soybeans (~4 cargoes).
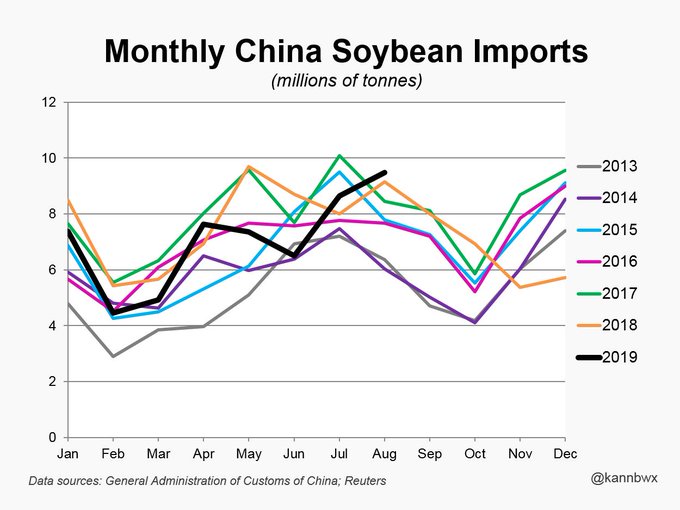
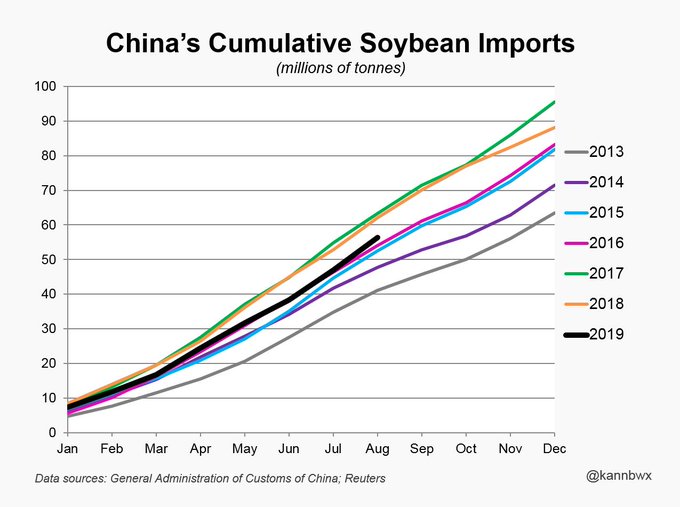
#China imported 9.48 mmt of #soybeans in August (looks like record for the month). That is the highest monthly total since May 2018. YTD imports = 56.4 mmt, down 9% YOY. China brought in 912kt of U.S. beans in July, and the Aug & Sep volumes should be higher.
if cliff does not see your question MM his post was thanking you for the last graph which was the more flat line
Thanks mcfarm!
I didn't want to lose that one, with him showing what a nice guy that we know he is.
Well I also commented that perhaps they were also getting a handle on asv as evidenced by increased soy demand (albeit from elsewhere).