Hi there November 6th! Smile and say hello to some real people today. Then think about how lucky you are to be living in this era of plenty in human history!
Scroll down and enjoy the latest comprehensive weather to the max...... occurring because of the natural physical laws in our atmosphere as life on this greening planet continues to enjoy the best weather/climate in at least 1,000 years(the last time that it was this warm) with the added bonus of extra beneficial CO2.
Quiet but very chilly weather now( even more (slight)colder changes from last Friday have continued overnight). Detailed analysis on weather indice page and GFS ensemble page regarding negative AO and changes late in week 2.
Winter Weather Forecasts
https://www.wpc.ncep.noaa.gov/wwd/winter_wx.shtml
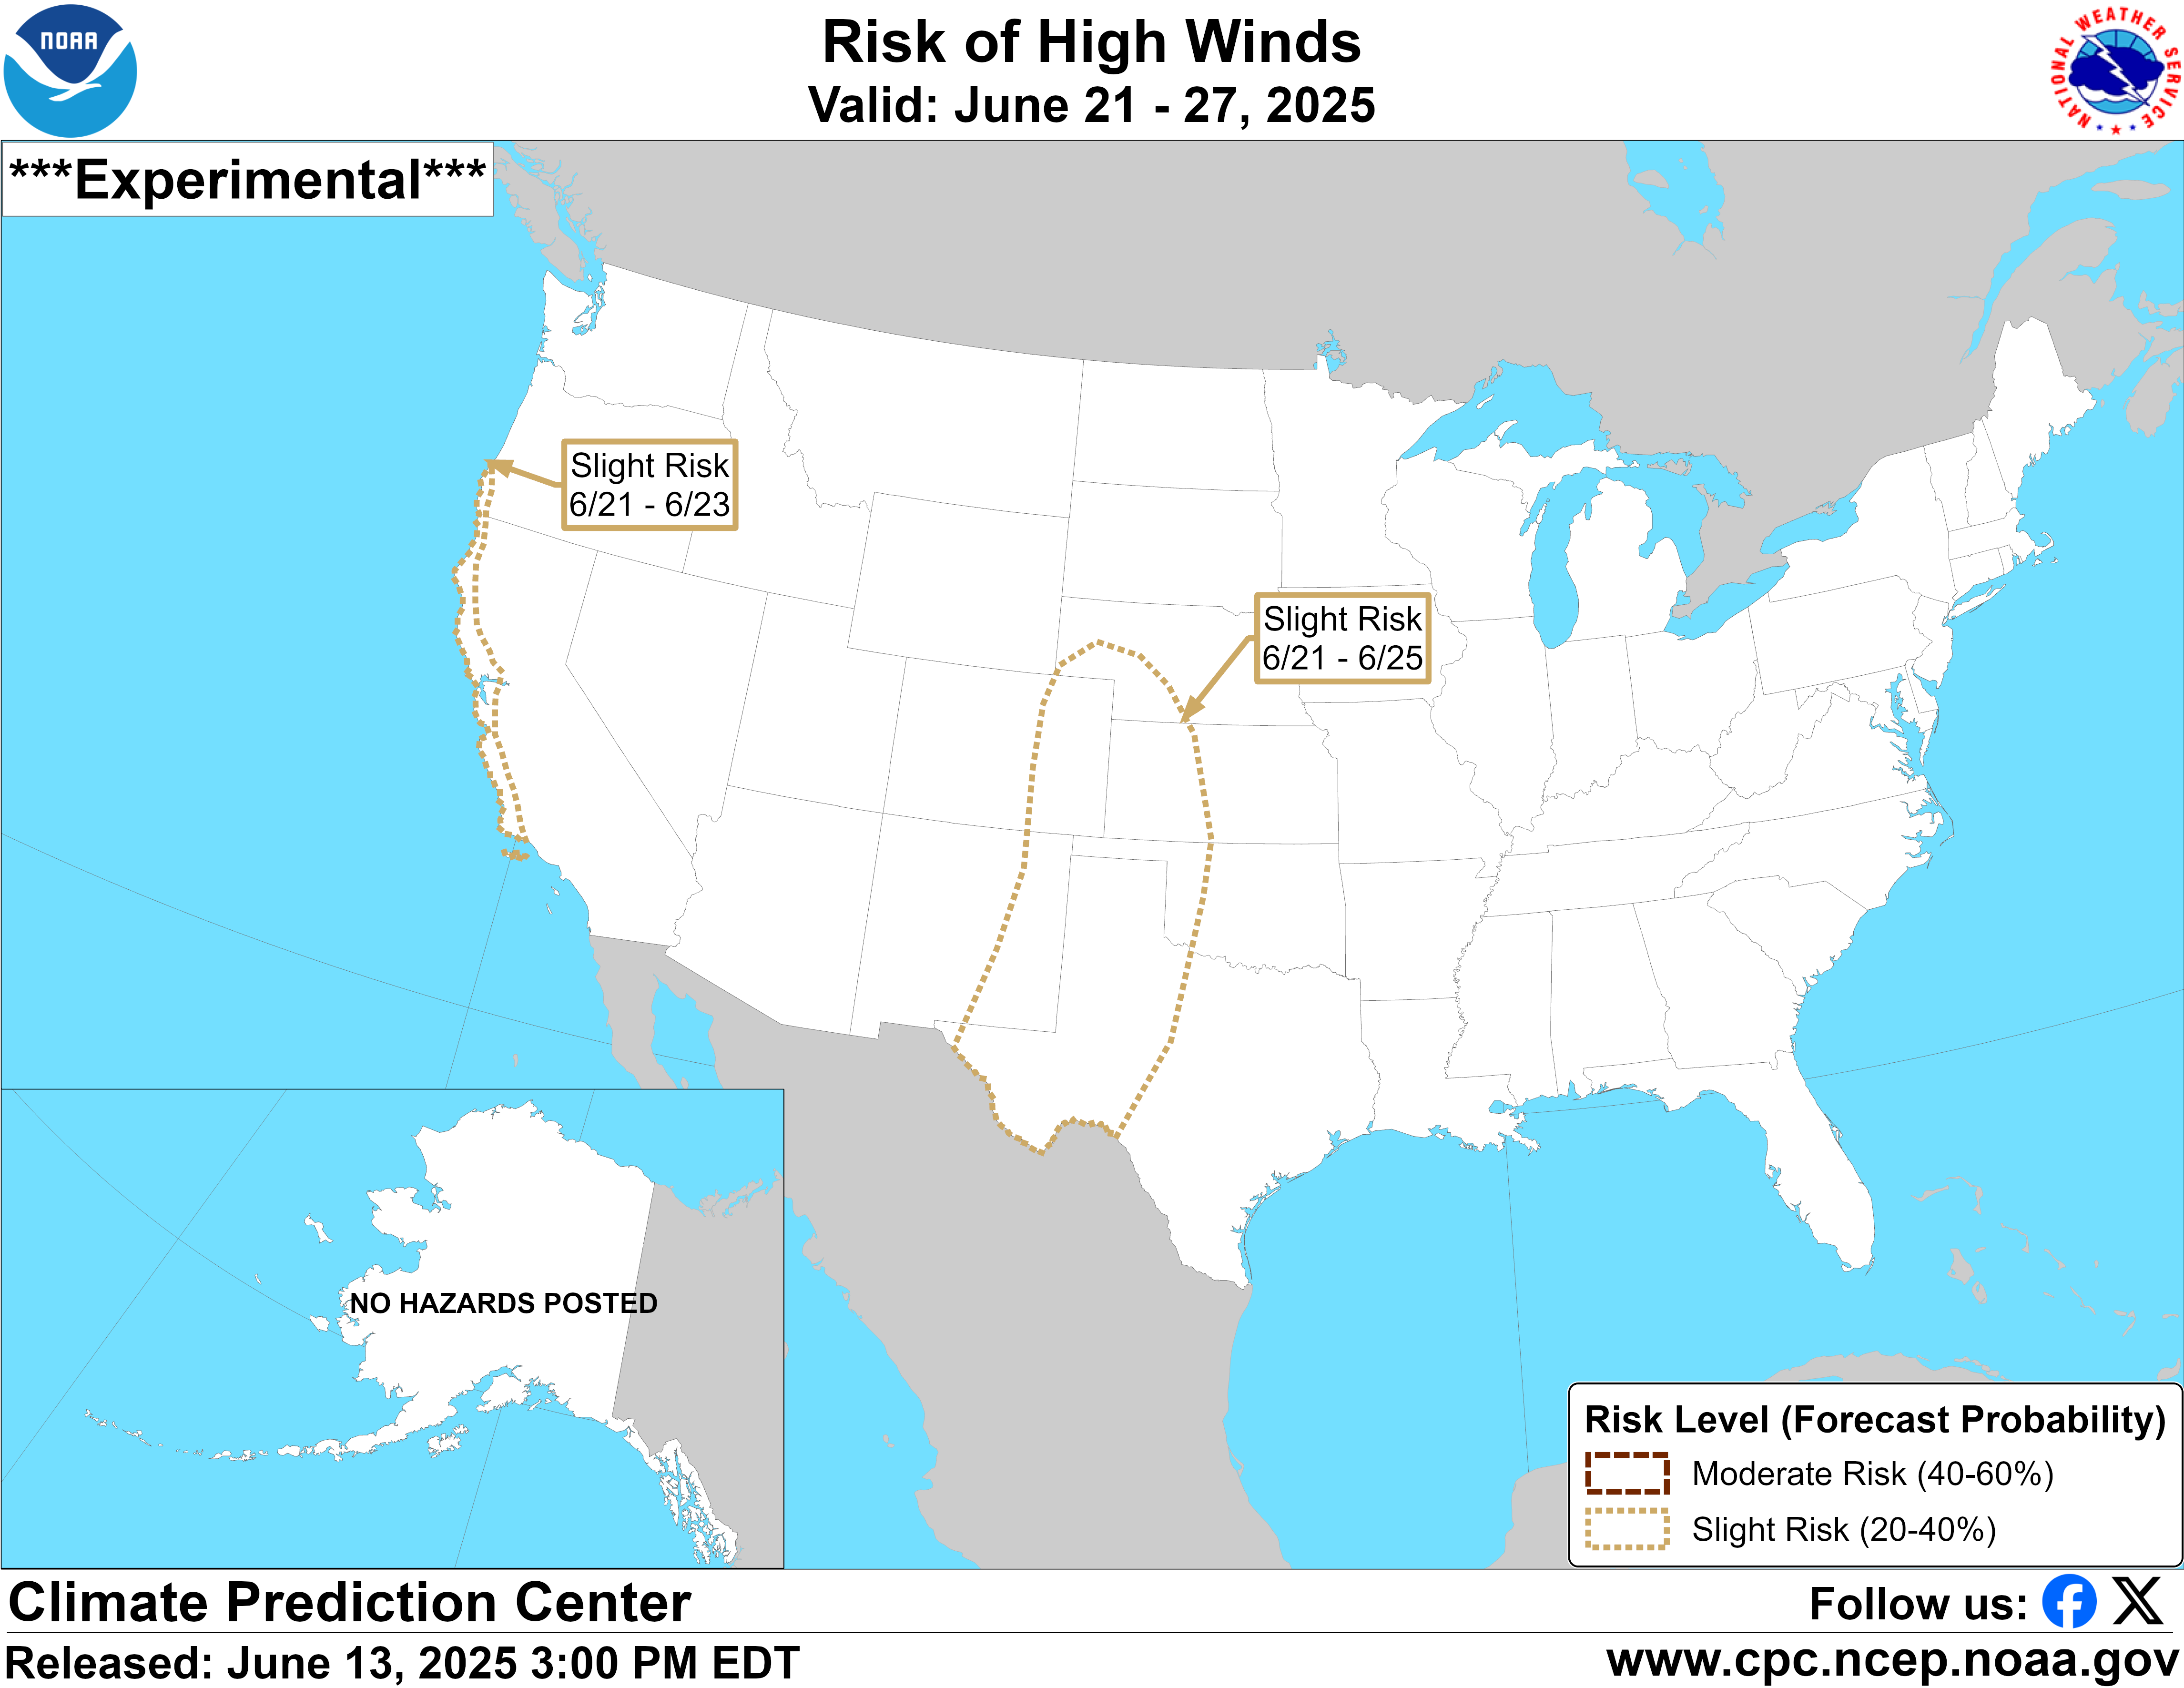
Here are the latest hazards across the country.
Purple/Pink/blue on land is cold/Winter weather. Brown is wind, Green is flooding. Gray is fog. Reddish is a red flag advisory.
Go to the link below, then hit the location/county on the map for details.
https://www.spc.noaa.gov/ Go to "hazards"

Current Weather Map
| NCEP Days 0-7 Forecast Loop | NCEP Short-Range Model Discussion | NCEP Day 3-7 Discussion |


Wind map Press down on this on the left with your cursor!


Current Jet Stream

| Low Temperatures Tomorrow Morning |

Highs today and tomorrow.


Highs for days 3-7:
New blast of mid Winter type cold, especially northcentral to Northeast!!!!


Temperatures vs average for days 3-7.
BIG Blues dominate. Reds in the West.
https://www.wpc.ncep.noaa.gov/medr/medr_mean.shtml


Weather maps for days 3-7 below
Quiet with Cold, Arctic high pressure and reinforcing cold fronts under a ridge west, trough east couplet aloft.

Liquid equivalent precip forecasts for the next 7 days are below.
Mostly dry pattern for the Midwest.
Day 1 below:
http://www.wpc.ncep.noaa.gov/qpf/fill_94qwbg.gif?1526306199054

Day 2 below:
http://www.wpc.ncep.noaa.gov/qpf/fill_98qwbg.gif?1528293750112

Day 3 below
http://www.wpc.ncep.noaa.gov/qpf/fill_99qwbg.gif?1528293842764

Days 4-5 below:
http://www.wpc.ncep.noaa.gov/qpf/95ep48iwbg_fill.gif?1526306162

Days 6-7 below:
http://www.wpc.ncep.noaa.gov/qpf/97ep48iwbg_fill.gif?1526306162

7 Day Total precipitation below:
https://www.wpc.ncep.noaa.gov/qpf/p168i.gif?1566925971

Excessive rain potential
Mesoscale Precipitation Discussions
Current Day 1 Forecast Valid 16Z 08/30/19 - 12Z 08/31/19 |
Day 1 Threat Area in Text Format
| Day 2 and Day 3 Forecasts |
Current Day 2 Forecast Valid 12Z 08/31/19 - 12Z 09/01/19 |
Day 2 Threat Area in Text Format
Current Day 3 Forecast |
Severe Storm Risk the next 8 days:
Current Day 1 Outlook | Forecaster: Grams/Leitman Issued: 30/1238Z Valid: 30/1300Z - 31/1200Z Forecast Risk of Severe Storms: Marginal Risk |
Current Day 2 Outlook | Forecaster: Mosier Issued: 30/0537Z Valid: 31/1200Z - 01/1200Z Forecast Risk of Severe Storms: No Svr Tstms |
Current Day 3 Outlook | Forecaster: Mosier Issued: 30/0725Z Valid: 01/1200Z - 02/1200Z Forecast Risk of Severe Storms: No Svr Tstms |
Current Day 4-8 Outlook |
Last 24 hour precip top map
Last 7 day precip below that
Current Dew Points

Latest radar loop
http://www.nws.noaa.gov/radar_tab.php


| (3400x1700 pixels - 2.2mb) Go to: Most Recent Image |

Go to: Most Recent Image
You can go to this link to see precipitation totals from recent time periods:
https://water.weather.gov/precip/
Go to precipitation, then scroll down to pick a time frame. Hit states to get the borders to see locations better. Under products, you can hit "observed" or "Percent of normal"
+++++++++++++++++++++++++++++++++++++++++++++++
Precipitation compared to average for the last 7, 14, 30 and 60 days.
Some spots in Iowa and especially N/C Illinois have dried out!
Usually not updated for previous day until late the next day.
Soilmoisture anomaly:
These maps sometimes take a day to catch up to incorporate the latest data(the bottom map is only updated once a week).
https://www.cpc.ncep.noaa.gov/products/Soilmst_Monitoring/US/Soilmst/Soilmst.shtml#
![]()


Latest: The first map below is the latest. The 2nd one is from last week.
In july/August/Sept/Oct, it's typical to see some increase in drought because of evaporation, seasonally exceeding low rainfall during those months. However, this year saw a HUGE increase in the Southeast!
Oct.31: TOP MAP SHOWS DROUGHT DECREASED in the Eastern Cornbelt and a bit in the Southeast thanks to some very welcome rains but much more is needed.
The maps below are updated on Thursdays.


The top map is the Canadian ensemble average, the maps below are the individual members that make up the average at the end of week 2.
+++++++++++++++++++++++++++++++++++++++++
Each member is like the parent, Canadian model operational model.......with a slight tweek/variation in parameters. Since we know the equations to represent the physics of the atmosphere in the models are not perfect, its useful to vary some of the equations that are uncertain(can make a difference) to see if it effects the outcome and how.
The average of all these variations(ensembles) often yields a better tool for forecasting. It's always more consistent. The individual operational model, like each individual ensemble member can vary greatly from run to run.........and represent an extreme end of the spectrum at times. The ensemble average of all the members, because it averages the extremes.............from opposite ends of the spectrum.........changes much less from run to run.
End of week 2....................0z Canadian ensembles:
360h GZ 500 forecast valid on Nov 21, 2019 00 UTC


Forecasts for the control (GEM 0) and the 20 ensemble members (global
0Z GFS(American model) Ensembles at 2 weeks:

GFS Ensemble mean(average of all the individual solutions above). The first map is a mid/upper level map. The 2nd one is a temperatures map at around 1 mile above the surface. These are anomalies(difference compared to average).
NCEP Ensemble t = 360 hour forecast
Wednesday: Extreme -AO continues. However, the high latitude upper level high pressure system responsible for this cold dynamic is reforming on the other side of the North Pole late in week 2. This will cause the coldest air in the high latitudes to be aimed towards N.Asia vs North America. It's still a cold pattern here but just doesn't have the COLDEST air any more.........if these models verify.

Latest, updated graph/forecast for AO and NAO here, including an explanation of how to interpret them...............mainly where they stand at the end of 2 weeks.
Previous analysis, with the latest day at the bottom for late week 2 period.
https://www.marketforum.com/forum/t
Saturday: the big player is the solidly negative AO. This is resulting in cold surges dropping from high latitudes Across Canada aimed at the US. With a near zero NAO and Near zero PNA, the push deeply south may not be completely maximized but cold blasts will be crossing the northern border and effecting the northern half. This will be seen with an active northern stream with periodic perturbations that dig strongly south in the flow and amplify The models have had an impossible time forecasting these entities recently.....usually under predicting them but the model to model changes have been enormous in both directions. The northern stream is in fact tougher to forecast historically. A competing, milder southern branch of the jet with mild , dried out oceanic air is trying to exert its influence pushing from west to east.
At times, the models think that this feature will warm up much of the country, possibly even defining a new pattern.......then surprise! Another chunk of northern stream energy shows up dropping south thru Canada which quickly replaces any warmth along the northern stream.
Additionally a ridge west, weakening trough east couplet is favorable for air masses to have a southern component in movement which gives the northern stream more power to intercept air masses coming from the west, trying to push east....and failing
I’ve been expecting a milder pattern in week 2 now for a week but until the AO increases more, cold surprises on week 2 models could continue.
What is most likely is that the West will warm up. How Far East the warmth can go is in question. Maybe in mid november it will finally be able to do that more....if the -AO lets
Sunday: Forecast philosophy is unchanged from yesterday.
Monday: Extreme negative values of AO going forward.......some members have it bouncing higher at the end of 2 weeks. High latitude upper level high pressure which is part of this may be shifting to the other side of the North Pole. That could mark a pattern change to milder with more zonal flow but the models have been wrong about this for the last 10 days or so when they showed a moderation.
Wednesday: Extreme -AO continues. However, the high latitude upper level high pressure system responsible for this cold dynamic is reforming on the other side of the North Pole late in week 2. This will cause the coldest air in the high latitudes to be aimed towards N.Asia vs North America. It's still a cold pattern here but just doesn't have the COLDEST air any more.........if these models verify.
National Weather Service 6-10 day, 8-14 day outlooks.
Updated daily just after 2pm Central.
Temperature Probability
 Precipitation Probability

| the 8-14 day outlooks ArchivesAnalogsLines-Only FormatGIS Data | |
Temperature Probability | |
 | |
The EURO Ensembles show a classic cross polar flow next week. If this were late December or early January many areas would flirt with all time record lows. What you are seeing in this 500mb heights compared to average. Heights are well above average into eastern Russia and that sends the jet stream from Siberia straight down into the Ohio Valley. This set up usually produces extreme cold. So Monday through Wednesday of next week looks very cold for many. I expect numerous record lows with a few all time record low temps for November, which is very impressive for it being the first half of the month.
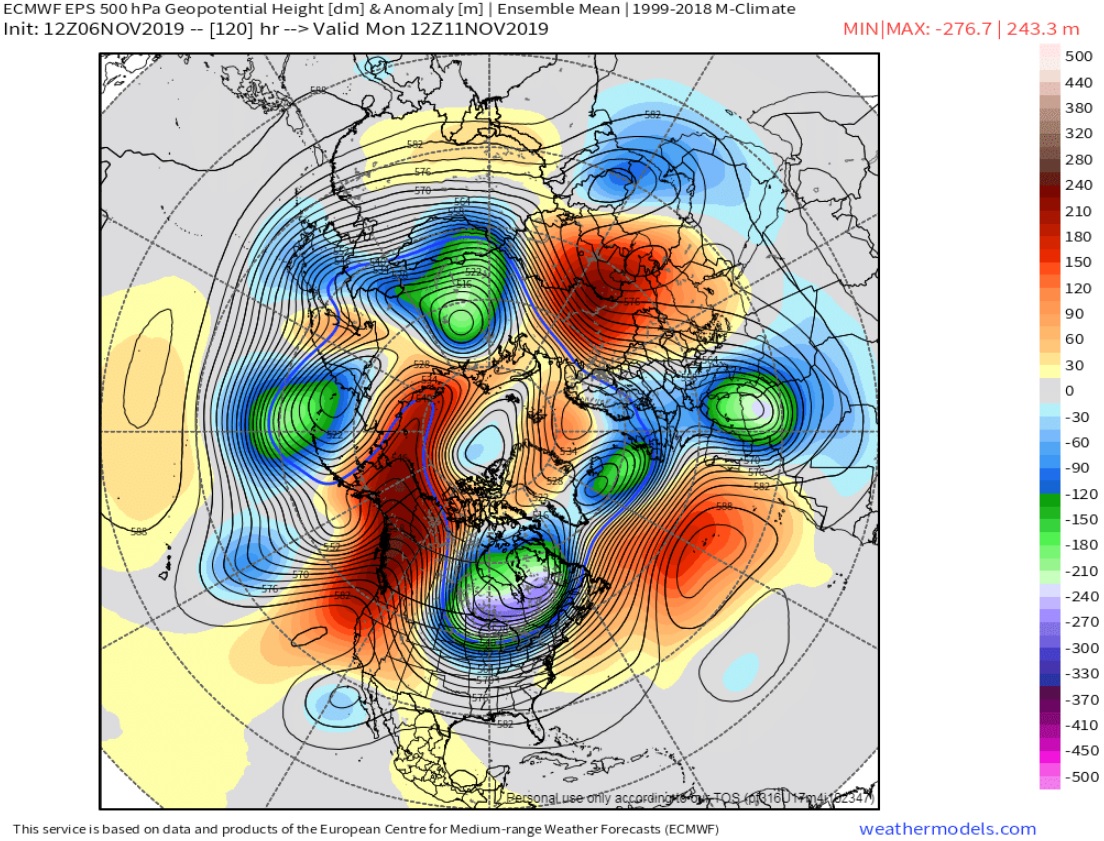
It really is amazing Grant. Thanks for the map.
My thinking is that the target for this extreme cold will be shifting to the other side of the N. Hemisphere in week 2.
It's still a chilly pattern but the connection with the coldest air in the highest latitudes will be disrupted on this side of the North Pole as that coldest air goes the other way to N.Asia. .............if the model solution below (0z GFS Ensemble mean anamoly) is on the right track.
The first map is the upper level heights, 2nd one is temperatures at around 1 mile above the surface. The time frame, 360 hours is the end of 2 weeks.
Here are those same 2 maps in 5 days, at the time frame you referenced.
Look at the huge difference. The top map shows the solid/unbroken positive anomaly going up the entire West Coast of North America and all the way up to Siberia as you noted, on the front side of that we have a deep, cut off Polar Vortex low that has plunged to a center just north of the Great Lakes.
That massive ridge west, trough east couplet is maximizing the cross polar flow originating from Siberia that is continuing south, crossing all of Canada with north to south steering currents, then diving deeply into the US, thanks to the upper level low position. This is the Polar Vortex displaced unusually far south.
The previous page which is day 14, shows that has shifted to the other side of the North Pole with no extension/connection from south to north like we have now.
Here are the maps again for the end of week 2 to help visualize the big changes, especially for the top-500 mb maps.
Note below, the separation between the big yellow/orange anomaly on the other side of the North Pole and the very weak one along the West Coast. The Siberian express connection is broken!
The Polar Vortex low has been replaced with a weak upper level trough in the Midwest.
For the US, this is still a ridge/west, trough east couplet which often means below normal temperatures but the magnitude of the cold will be modest compared to the brand we see in several days.
Actually, looking closer at this pattern from doing the current analysis, I think that it could flush out much of the cold in Canada and Canada may have MUCH above temperatures, starting late in week 2.
So there will still be cold fronts in week 2 and beyond with this pattern but they will not have major cold with just slightly below average temperatures when the Canadian air gets here.


