Climate Realists@ClimateRealists
December 2nd, 2019 by Roy W. Spencer, Ph. D.
The Version 6.0 global average lower tropospheric temperature (LT) anomaly for November, 2019 was +0.55 deg. C, up from the October value of +0.46 deg. C.
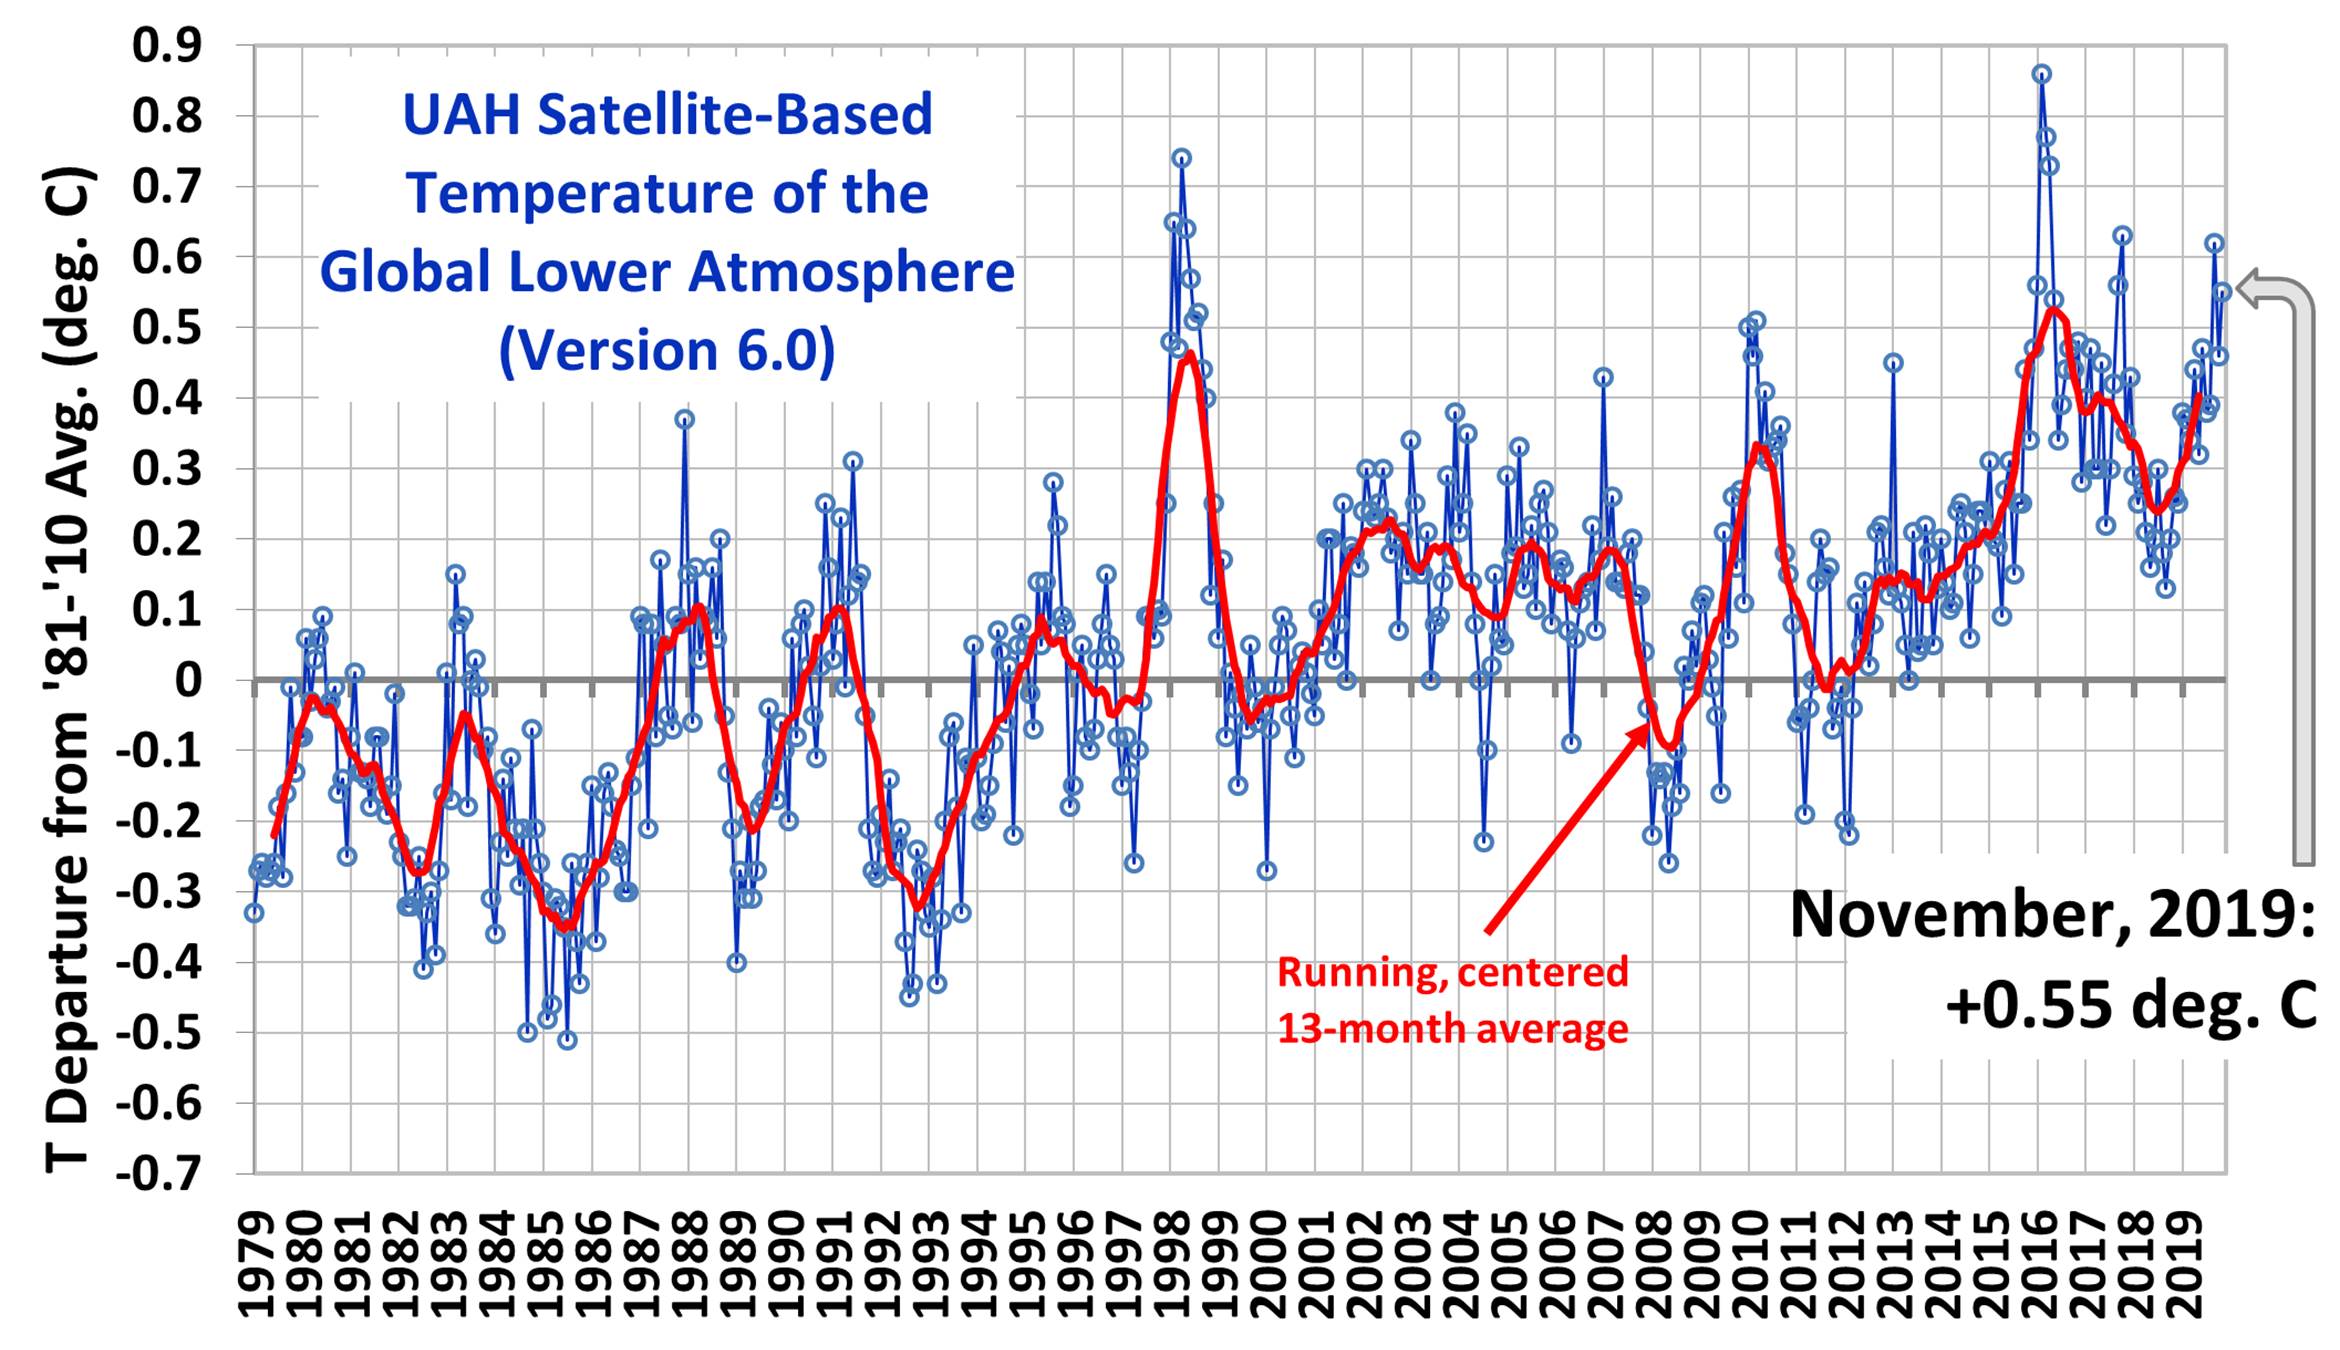
The linear warming trend since January, 1979 remains at +0.13 C/decade (+0.11 C/decade over the global-averaged oceans, and +0.18 C/decade over global-averaged land).
metmike: The slow beneficial warming during this climate optima continues.
Snow cover over Lower 48 most extensive on record for early December (going back to 2003). At least a foot of snow has fallen in 25 different states over last few days. And snow has fallen as far south as Southern California, Tennessee, and Northern Georgia.
Snow covered the ground on nearly half of the real estate in the Lower 48 — 46.2 percent of land area — on Monday morning, the largest area on Dec. 2 since snow cover records from the National Oceanic and Atmospheric Administration began in 2003. Normally, a little more than a quarter of the nation has snow on the ground at this time of year.
– Source: Jason Samenow, Capital Weather Gang
This graphic from NOAA

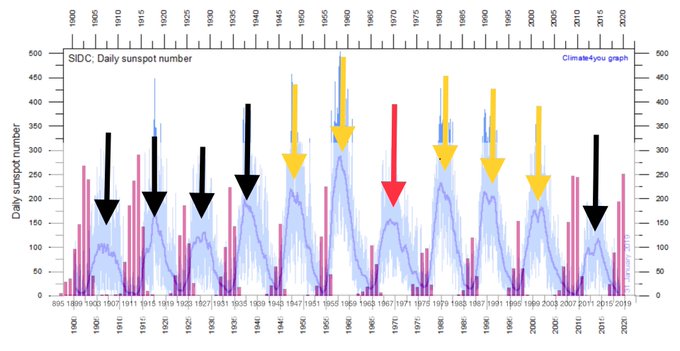
Climate Realists@ClimateRealistsThe 1970’s Cooling period (red arrow) was unusual in as much it didnt follow the sequence of high Spotless days and low Solar Activity (black). The Warming period (yellow) was consistently High SA & Low Spotless periods/years. We are now back to Low SA/High Spotless periods/years
Climate Realists@ClimateRealists
I can only add that the changes to the Jet Stream was the key to dramatic changes to the 1970’s Climate and not the temporary halt to High Level Solar Activity... just an educated guess on my part. So a footnote to the a 1970’s Cooling would be regarded as a temporary situation
Very entertaining and enlightening video(although obviously biased and misleading on some points)
https://www.youtube.com/watch?v=KQgsmTZYmsk&feature=youtu.be
Mike,
This is a bit disconcerting from another BB:
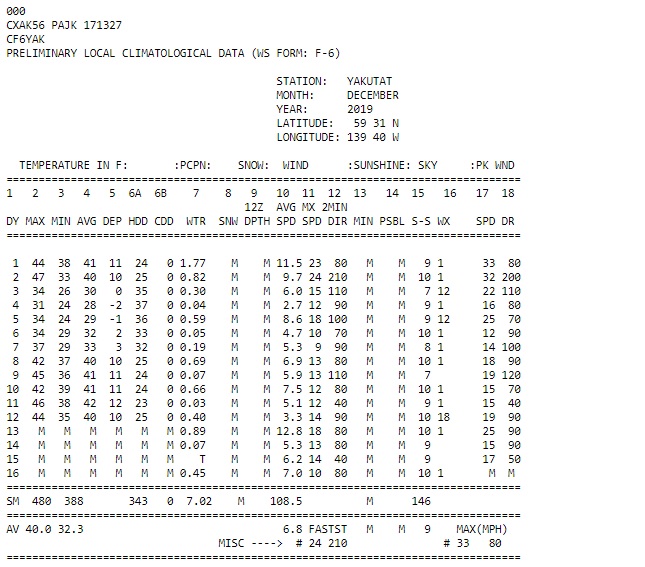
"The high temperatures at Yakutat, Alaska for the past three days and for today (preliminary value) were:
December 13: 56° (old record: 49°, 2017)
December 14: 58° (old record: 49°, 2017)
December 15: 61° (old record: 48°, 2005)
December 16: 57° (old record: 50°, 2005)
All four days exceeded the previous December record high temperature of 52°, which had been set on December 8, 1960. The 61° temperature yesterday broke the meteorological winter record of 58°, which was set on January 19, 1930 and tied on December 14, 2019 and was also above the November monthly record of 59°, which was set on November 1, 1947. Prior to yesterday, the latest 60° temperature on record occurred on October 13, 1969 when the temperature reached 60°. Daily records go back to May 1, 1917."
------------------------------------------------------------------------------------------------------------------
So, a whopping four days exceeded the prior record high for all of Dec by a range of 4-9 F! And amazingly, the new latest 60 on record is Dec 15th, when the 30 year normal is only 35 vs the old record latest of Oct 13, when the 30 year normal is a much higher ~49!! Keep in mind that this is a coastal location with heavy marine influence and small diurnal ranges. The new 61 record for 12/15 is a whopping 26 warmer than normal, which is amazing for a coastal location with heavy ocean influence and compares to the old latest 60 being on Oct 13, which is only about 11 warmer than normal! Is it possible the globe is warming faster now?
When you look at the history for those record days for Yakutat, AK you see the temperatures were all over the place. All the surrounding stations in that area had highs in the upper 30s and lower 40s, still above average but by only 3 to 5 degrees. There is no official temperatures data for Yakutat those days which tells me the sensor is broken. With current sea surface temperatures and winds, there is no way those temperatures were accurate. Officially for Yakutat there is no low or high temperatures for the dates Dec 13th trough the 16th. Based on surrounding observations and sea surface temps, they were likely between 42 and 47 those days, which is still well above average for them.
Hope that helps.
Thanks Grant. I would have never known what you just posted. I had noticed it being very mild for this time of year in that area but did not notice mega extreme anomalies that one would associate with such extreme records.
Larry, what was the source for that information?
Yakutat is off/along the Gulf of Alaska in southeast Alaska and as Grant mentioned, winds from the Gulf of Alaska would tend to bring in an air mass that has a temperature that is close to the water temperature, which is just under 47 Deg F right now:
Regarding record warmth in Alaska and other places in higher latitudes.
This is a hallmark trait to all global warming periods during the last 10,000 years at least.
The coldest places, during the coldest times of year are warming the most(by most objective standards, this is a good thing). This is also decreasing the north to south temperature gradient.
The map below is for Canada during the past 70 years. I don't have one for Alaska but we can assume that they would be in the red shades in the upper left corner of the screen.

Holocene climate optimum
https://en.wikipedia.org/wiki/Holocene_climatic_optimum
The Holocene Climate Optimum warm event consisted of increases of up to 4 °C near the North Pole (in one study, winter warming of 3 to 9 °C and summer of 2 to 6 °C in northern central Siberia).
Out of 140 sites across the western Arctic, there is clear evidence for conditions warmer than now at 120 sites. At 16 sites, where quantitative estimates have been obtained, local HTM temperatures were on average 1.6±0.8 °C higher than now. Northwestern North America had peak warmth first, from 11,000 to 9,000 years ago, and the Laurentide Ice Sheet still chilled the continent. Northeastern North America experienced peak warming 4,000 years later. Along the Arctic Coastal Plain in Alaska, there are indications of summer temperatures 2–3 °C warmer than present.[5] Research indicates that the Arctic had less sea ice than the present." So the main point is not that it was warmer than this at the higher latitudes but when the planet warms up, the frigid, very dry air masses in the highest latitudes of the Northern Hemisphere are the ones that benefit the most.
There isn't much sun in the Winter at the highest latitudes(so its not because of the affect of lower albedo associated with less ice) but maybe there is more open water from less ice...causing moderation of the air masses with more low level moisture?
One could speculate that it is related to the actual CO2 absorption of radiation in the colder air if past warmings were more evenly distributed but they were all like this and humans were not burning fossil fuels thousands of years ago.
Are there more clouds in the higher latitudes in the Winter?
What's causing the poles to warm faster than the rest of Earth?
https://www.nasa.gov/topics/earth/features/warmingpoles.html
Actually, this affect is not just at the high latitudes.
Global warming is affecting low temperatures much more than high temperatures.
This suggests the possibility of the cause being from more water vapor in the air.
The more moisture that you have in the air, the more heat capacity that air mass has and so its harder to heat and harder to cool.
H2O is also the main greenhouse gas, something like 90% of the affect comes from H2O.
During the day, the greenhouse gas warming affect is still the same rate as at night but the suns power to heat is so overwhelming that it dominates.
At night, we take out the sun and only have the greenhouse gas affect, so it can dominate more.
Thanks, Grant and Mike.
This came from a poster at AmericanWx Forums, donsutherland, who has a lot of credibility as an objective poster and is super smart: Go to the 3rd post down in this link:
This agrees with Don: also, note the E winds, which are preventing the ocean from having much influence
https://w1.weather.gov/data/obhistory/PAYA.html
| Temperature (ºF) | Pressure | Precipitation (in.) | |||||||||||||||
|---|---|---|---|---|---|---|---|---|---|---|---|---|---|---|---|---|---|
| 6 hour | |||||||||||||||||
| D a t e | Time (akst) | Wind (mph) | Vis. (mi.) | Weather | Sky Cond. | Air | Dwpt | Max. | Min. | Relative Humidity | Wind Chill (°F) | Heat Index (°F) | altimeter (in.) | sea level (mb) | 1 hr | 3 hr | 6 hr |
| Max. | Min. | ||||||||||||||||
| Air | Dwpt | 6 hour | altimeter (in) | sea level (mb) | 1 hr | 3 hr | 6 hr | ||||||||||
a t e | Time (akst) | Wind (mph) | Vis. (mi.) | Weather | Sky Cond. | Temperature (ºF) | Relative Humidity | Wind Chill (°F) | Heat Index (°F) | Pressure | Precipitation (in.) | ||||||
| 17 | 15:53 | E 3 | 10.00 | Mostly Cloudy | SCT030 SCT040 BKN050 | 36 | 30 | 79% | NA | NA | 29.35 | 993.8 | |||||
| 17 | 14:53 | E 9 | 10.00 | Overcast | OVC036 | 36 | 30 | 79% | 29 | NA | 29.36 | 994.2 | |||||
| 17 | 13:53 | E 8 | 10.00 | Light Rain | OVC040 | 36 | 30 | 79% | 30 | NA | 29.37 | 994.6 | |||||
| 17 | 12:53 | E 6 | 10.00 | Light Rain | FEW027 BKN040 OVC055 | 35 | 32 | 89% | 30 | NA | 29.37 | 994.5 | |||||
| 17 | 11:53 | Calm | 10.00 | Light Rain | BKN038 OVC045 | NA | NA | NA | NA | NA | 29.36 | 994.4 | |||||
| 17 | 10:53 | Calm | 10.00 | Mostly Cloudy | SCT046 BKN055 | NA | NA | NA | NA | NA | 29.35 | 994.1 | |||||
| 17 | 09:53 | NE 3 | 10.00 | Mostly Cloudy | BKN050 | NA | NA | NA | NA | NA | 29.35 | 994.1 | |||||
| 17 | 08:53 | Calm | 10.00 | Partly Cloudy | SCT085 | NA | NA | NA | NA | NA | 29.33 | 993.4 | |||||
| 17 | 07:53 | Calm | 10.00 | Partly Cloudy | SCT120 | NA | NA | NA | NA | NA | 29.33 | 993.4 | |||||
| 17 | 06:53 | Calm | 10.00 | Mostly Cloudy | BKN110 | NA | NA | NA | NA | NA | 29.34 | 993.7 | |||||
| 17 | 05:53 | Calm | 10.00 | Partly Cloudy | SCT110 | NA | NA | NA | NA | NA | 29.36 | 994.4 | |||||
| 17 | 04:53 | Calm | 10.00 | Partly Cloudy | SCT100 | NA | NA | NA | NA | NA | 29.38 | 995.1 | |||||
| 17 | 03:53 | NE 5 | 10.00 | A Few Clouds | FEW038 | NA | NA | NA | -11 | NA | 29.41 | 996.1 | |||||
| 17 | 02:53 | E 3 | 10.00 | Mostly Cloudy | BKN044 | NA | NA | NA | NA | NA | 29.44 | 997.1 | 0.01 | ||||
| 17 | 01:53 | NE 5 | 10.00 | Overcast | SCT034 OVC042 | NA | NA | NA | -11 | NA | 29.47 | 998.1 | |||||
| 17 | 00:53 | E 5 | 10.00 | Mostly Cloudy | BKN028 | NA | NA | NA | -11 | NA | 29.50 | 999.1 | |||||
| 16 | 23:53 | NE 7 | 10.00 | Overcast | BKN026 OVC033 | NA | NA | NA | -13 | NA | 29.54 | 1000.5 | 0.01 | 0.01 | |||
| 16 | 22:53 | NE 8 | 10.00 | Overcast | BKN023 BKN036 OVC044 | NA | NA | NA | -14 | NA | 29.57 | 1001.5 | |||||
| 16 | 21:53 | E 9 | 10.00 | Overcast | OVC021 | NA | NA | NA | -15 | NA | 29.58 | 1001.8 | |||||
| 16 | 20:53 | E 8 | 10.00 | Overcast | BKN020 BKN025 OVC033 | NA | NA | NA | -14 | NA | 29.60 | 1002.5 | 0.07 | ||||
| 16 | 19:53 | NE 7 | 10.00 | Mostly Cloudy | FEW018 SCT025 BKN120 | NA | NA | NA | -13 | NA | 29.61 | 1002.9 | |||||
| 16 | 18:53 | NE 7 | 10.00 | Overcast | FEW021 BKN055 OVC110 | NA | NA | NA | -13 | NA | 29.62 | 1003.2 | |||||
| 16 | 17:53 | E 6 | 10.00 | Overcast | SCT018 OVC120 | NA | NA | NA | -12 | NA | 29.64 | 1003.9 | 0.01 | 0.07 | |||
| 16 | 16:53 | Calm | 5.00 | Light Rain | BKN017 OVC023 | NA | NA | NA | NA | NA | 29.65 | 1004.2 | 0.04 | ||||
| 16 | 15:53 | E 7 | 10.00 | Overcast | OVC011 | NA | NA | NA | -13 | NA | 29.66 | 1004.6 | 0.02 | ||||
| 16 | 14:53 | E 5 | 4.00 | Rain | BKN009 OVC013 | NA | NA | NA | -11 | NA | 29.67 | 1004.9 | 0.08 | 0.24 | |||
| 16 | 13:53 | E 10 | 8.00 | Light Rain | OVC008 | NA | NA | NA | -16 | NA | 29.66 | 1004.6 | |||||
| 16 | 12:53 | E 8 | 10.00 | Overcast | OVC006 | NA | NA | NA | -14 | NA | 29.66 | 1004.6 | 0.07 | ||||
| 16 | 11:53 | E 9 | 3.00 | Light Rain | FEW008 BKN013 OVC023 | 48 | 38 | 68% | 44 | NA | 29.64 | 1003.7 | 0.06 | 0.09 | |||
| 16 | 10:53 | E 9 | 3.00 | Light Rain | OVC012 | 52 | 37 | 57% | NA | NA | 29.63 | 1003.3 | 0.03 | ||||
| 16 | 09:53 | E 8 | 3.00 | Light Rain Fog/Mist | OVC016 | 37 | 36 | 96% | 31 | NA | 29.61 | 1002.7 | |||||
| 16 | 08:53 | E 10 | 10.00 | Light Rain | OVC033 | 37 | 35 | 57 | 37 | 93% | 30 | NA | 29.59 | 1002.1 | 0.04 | 0.13 | |
| 16 | 07:53 | E 8 | 9.00 | Light Rain | OVC027 | 37 | 35 | 93% | 31 | NA | 29.58 | 1001.8 | 0.04 | ||||
| 16 | 06:53 | E 5 | 10.00 | Light Rain | OVC026 | 48 | 35 | 61% | 46 | NA | 29.58 | 1001.8 | 0.02 | ||||
| 16 | 05:53 | SE 3 | 10.00 | Light Rain | OVC030 | 51 | 33 | 50% | NA | NA | 29.58 | 1001.5 | 0.01 | 0.03 | |||
| 16 | 04:53 | SE 7 | 10.00 | Light Rain | OVC034 | 55 | 32 | 42% | NA | NA | 29.57 | 1001.3 | 0.01 | ||||
| 16 | 03:53 | SE 7 | 10.00 | Light Rain | OVC034 | 55 | 34 | 45% | NA | NA | 29.55 | 1000.7 | 0.01 | ||||
| 16 | 02:53 | E 9 | 10.00 | Light Rain | OVC048 | 56 | 33 | 61 | 42 | 42% | NA | NA | 29.52 | 999.8 | |||
| 16 | 01:53 | E 5 | 10.00 | Overcast | OVC046 | 50 | 28 | 43% | 48 | NA | 29.53 | 1000.0 | |||||
| 16 | 00:53 | NE 6 | 10.00 | Light Rain | OVC050 | 55 | 27 | 34% | NA | NA | 29.53 | 1000.0 | |||||
| 15 | 23:53 | E 5 | 10.00 | Overcast | OVC050 | 53 | 27 | 37% | NA | NA | 29.54 | 1000.4 | |||||
| 15 | 22:53 | E 6 | 10.00 | Overcast | OVC060 | 53 | 25 | 34% | NA | NA | 29.55 | 1000.7 | |||||
| 15 | 21:53 | E 7 | 10.00 | Overcast | OVC060 | 49 | 25 | 39% | 46 | NA | 29.56 | 1001.0 | |||||
| 15 | 20:53 | NE 12 | 10.00 | Overcast | BKN070 OVC090 | 51 | 24 | 60 | 36 | 35% | NA | NA | 29.58 | 1001.6 | |||
| 15 | 19:53 | E 6 | 10.00 | Overcast | FEW055 BKN070 OVC100 | 58 | 26 | 29% | NA | NA | 29.61 | 1002.8 | |||||
| 15 | 18:53 | E 6 | 10.00 | Overcast | OVC055 | 51 | 27 | 39% | NA | NA | 29.64 | 1003.6 | |||||
| 15 | 17:53 | E 5 | 10.00 | Mostly Cloudy | BKN055 | 49 | 28 | 44% | 47 | NA | 29.65 | 1004.2 | |||||
| 15 | 16:53 | SE 5 | 10.00 | Overcast | OVC055 | 54 | 29 | 38% | NA | NA | 29.68 | 1005.0 | |||||
| 15 | 15:53 | E 3 | 10.00 | Mostly Cloudy | FEW050 BKN060 BKN075 | 37 | 30 | 76% | NA | NA | 29.70 | 1005.9 | |||||
| 15 | 14:53 | Calm | 10.00 | Partly Cloudy | SCT046 | 40 | 29 | 56 | 40 | 65% | NA | NA | 29.73 | 1006.7 | |||
| 15 | 13:53 | E 6 | 10.00 | Overcast | FEW049 OVC065 | 49 | 30 | 48% | 46 | NA | 29.76 | 1007.8 | |||||
| 15 | 12:53 | NE 8 | 10.00 | Mostly Cloudy | BKN035 BKN046 | 43 | 30 | 60% | 38 | NA | 29.78 | 1008.5 | |||||
| 15 | 11:53 | NE 8 | 10.00 | Overcast | SCT033 BKN040 OVC047 | 52 | 31 | 45% | NA | NA | 29.81 | 1009.4 | |||||
| 15 | 10:53 | E 9 | 10.00 | Overcast | BKN040 OVC048 | 56 | 29 | 36% | NA | NA | 29.83 | 1010.0 | |||||
| 15 | 09:53 | E 6 | 10.00 | Light Rain | OVC041 | 54 | 29 | 38% | NA | NA | 29.84 | 1010.4 | |||||
| 15 | 08:53 | E 6 | 10.00 | Overcast | FEW033 BKN046 OVC060 | 51 | 30 | 54 | 41 | 45% | NA | NA | 29.84 | 1010.4 | |||
| 15 | 07:53 | E 6 | 10.00 | Mostly Cloudy | BKN048 BKN065 | 51 | 30 | 45% | NA | NA | 29.84 | 1010.6 | |||||
| 15 | 06:53 | NE 8 | 10.00 | Overcast | OVC048 | 46 | 30 | 54% | 42 | NA | 29.86 | 1011.0 | |||||
| 15 | 05:53 | NE 9 | 10.00 | Overcast | OVC046 | 47 | 31 | 54% | 43 | NA | 29.87 | 1011.6 | |||||
| 15 | 04:53 | NE 7 | 10.00 | Overcast | OVC044 | 47 | 31 | 54% | 44 | NA | 29.89 | 1012.1 | |||||
| 15 | 03:53 | NE 6 | 10.00 | Overcast | OVC043 | 47 | 31 | 54% | 44 | NA | 29.90 | 1012.5 | |||||
| 15 | 02:53 | NE 7 | 10.00 | Overcast | OVC046 | 49 | 31 | 51 | 38 | 50% | 46 | NA | 29.91 | 1012.7 | |||
| 15 | 01:53 | E 5 | 10.00 | Overcast | OVC048 | 43 | 31 | 63% | 40 | NA | 29.92 | 1013.3 | |||||
| 15 | 00:53 | NE 6 | 10.00 | Overcast | OVC048 | 46 | 31 | 56% | 43 | NA | 29.93 | 1013.6 | |||||
| 14 | 23:53 | E 5 | 10.00 | Overcast | OVC047 | 46 | 32 | 58% | 44 | NA | 29.94 | 1013.7 | |||||
| 14 | 22:53 | E 3 | 10.00 | Overcast | FEW024 BKN039 OVC049 | 46 | 32 | 58% | NA | NA | 29.94 | 1013.7 | |||||
| 14 | 21:53 | E 6 | 10.00 | Overcast | FEW026 SCT037 OVC047 | 50 | 32 | 50% | 48 | NA | 29.94 | 1013.7 | |||||
| 14 | 20:53 | E 3 | 10.00 | Overcast | OVC034 | 50 | 32 | 55 | 39 | 50% | NA | NA | 29.94 | 1013.9 | |||
| 14 | 19:53 | E 3 | 10.00 | Mostly Cloudy | BKN120 | 55 | 32 | 42% | NA | NA | 29.94 | 1014.0 | |||||
| 14 | 18:53 | NE 6 | 10.00 | Mostly Cloudy | BKN038 | 46 | 34 | 63% | 43 | NA | 29.95 | 1014.3 | |||||
| 14 | 17:53 | NE 6 | 10.00 | Overcast | FEW017 OVC110 | 46 | 34 | 63% | 43 | NA | 29.96 | 1014.6 | |||||
| 14 | 16:53 | NE 6 | 10.00 | Light Rain | SCT030 BKN034 OVC110 | 52 | 35 | 53% | NA | NA | 29.98 | 1015.1 | |||||
| National Weather Service Southern Region Headquarters Fort Worth, Texas Disclaimer | ||
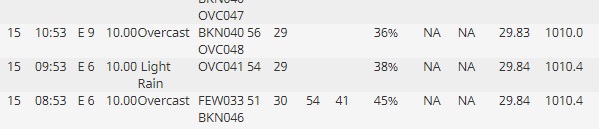
And now that I look at the hourly temps more closely, there indeed looks to be a problem!! Holy cow! Details shortly. I may be posting at American for the first time in several years to note that there appears to be a problem with the temperature sensor. OMG!
Edit: I know there’s a problem because of these two hourlies:
1. 16:53 on 12/15 is at 54 F, a rise of a whopping 17 in one hour while overcast??? That can’t be. And the winds didn’t change much. Light E to light SE. So, no major warm front it would appear. This has to be bogus.
2. At 9:53 on Dec 16th it was 37 and it then rose a whopping 15 in one hour under light rain to 52 with continued light E winds. No way, right?
Grant and Mike, please look at this and see what I’m referring to. Those are just two examples of overall suspiciously jumpy temperatures.
I’m going to find it difficult to not go to Don, who I respect immensely, and tell him there’s a serious problem with the sensor.
Below is the monthly climate data so far for Yakutat. The M For MAX MIN AVG DEP HDD and CDD is because the data is missing, or in this case thrown out because of a broken thermometer on the METAR. But those highs are above average the 8th through the 12th. SST as Mike showed being around 47°F would make it very hard for that site to get much above 50 with the extreme low sun angle this time of the year. But through the 12th of the month temperatures are running 6.25°F above average, which is fairly high for a coastal climate this time of the year in my opinion.
Here is another hint the thermometer is broken. Notice the observation at 9:53 showing light rain with a temp of 54 and a dew point of 29. The next hour the temp is higher with the dew point staying the same. Winds are out of the same direction meaning the same air mass. This is impossible as the wet bulb process would drop the temperature if the air mass is the same, 54 over 29 is fairly dry air 38% RH. But hey, this was a fun subject. Made me look it up! Thanks
Thanks, Grant. I just replied to Don about those two hourlies that look bogus:
Thanks Larry!
There is one possible explanation for these numbers to be legit.
There could have been a chinook, downsloping wind coming off the high mountain range just to the east.
The east wind at these times would be favorable for the air masses to be coming from the other side of the mountain ranges to the east, lifted up and over and on the downwind side, they would be downsloping and being heated adiabatically just before arriving at this location.
The mountain range to the east has some mountains over 10,000 feet, with Mt. Elias not far away at 18,000 feet.
Chinook winds cause huge upward temperature spikes like the one that you noted, sometimes in just an hour.
On the map below, which you can see much better if you go to the link, the numbers are in meters, not feet. A meter is more than 3 feet, so those mountains over 5,000 meters that are just east of this location are over 15,000 feet high.
https://www.britannica.com/place/Alaskan-Mountains#ref469163
Yukutat is just west of Mt. St. Elias below.
Here's a good article about chinook winds in Alaska, specifically Anchorage, which is up the coast a bit but has similar weather.
https://www.theweatherprediction.com/weatherpapers/014/index.html
| CHINOOK WIND FORECASTING Living with, and forecasting for Snow Eaters |
SCOTT ELNES
(written about Anchorage, AK, with invaluable assistance from Charles Bell at the National Weather Service in Las Vegas, NV)
metmike: If this was driven by a Chinook wind, then one would think that it would NOT be raining as reported at the times of the strange temp spike higher. A chinook wind is usually pretty dry and its downsloping/decending air which would defeat the rain making process that needs air to be lifted, then cooled down near the dew point for moisture to condense out aloft.
So it probably is just bad data/busted thermometer as Grant stated.
That was the first thing I checked Mike. Was there downslope? The streamlines showed wind originating over the Gulf of Alaska shoreline. The winds did go over and down a ridge but nowhere near a downslope you would need to get that warm. As you said, if the winds would have come down from those very high elevations you could warm up.
Don responded with this:
"Thanks for this information. The 12/13-16 data has now been pulled and replaced by "M." Given the temperatures at Sitka, I suspect based on what you found and the lower temperatures there than a few days ago, the sensor was, in fact, malfunctioning."
Grant,
Great analysis and detective work. Very impressive.
You are right too on the strength of the winds. Below 10 mph would have been too weak to create a chinook.
Thanks Larry for making this an interesting and learning evening. I learned a great deal about chinook winds in Alaska.
Here's a wonderful discussion about the greatest chinook wind in Alaska history.
Objective Comments and Analysis - All Science, No Politics
Contributions by Richard James and Rick Thoman
http://ak-wx.blogspot.com/2015/12/december-1934-chinook.html
A few weeks ago reader Mike suggested that we take a look at the great chinook event of December 1934, which brought record-breaking warmth to interior Alaska and led to the only "brown" Christmas in Fairbanks history. The magnitude of the warm anomaly was so extreme that nothing really comparable has happened in the 8 decades since.

The highest temperatures observed during the period December 1-10 are shown in the map below. The interior Alaska "winner" was Nenana, with 61°F on December 8. Fairbanks reached 58°F on the 5th, but even more remarkably exceeded 50°F for 5 consecutive days from the 4th through the 8th. These are the only December days in Fairbanks history to have reached 50°F, and only a couple of other days have exceeded 50°F from November through February (November 25, 1936 and January 16, 2009). The highest temperature observed statewide was 64°F at Sitka Magnetic Observatory on the 8th.
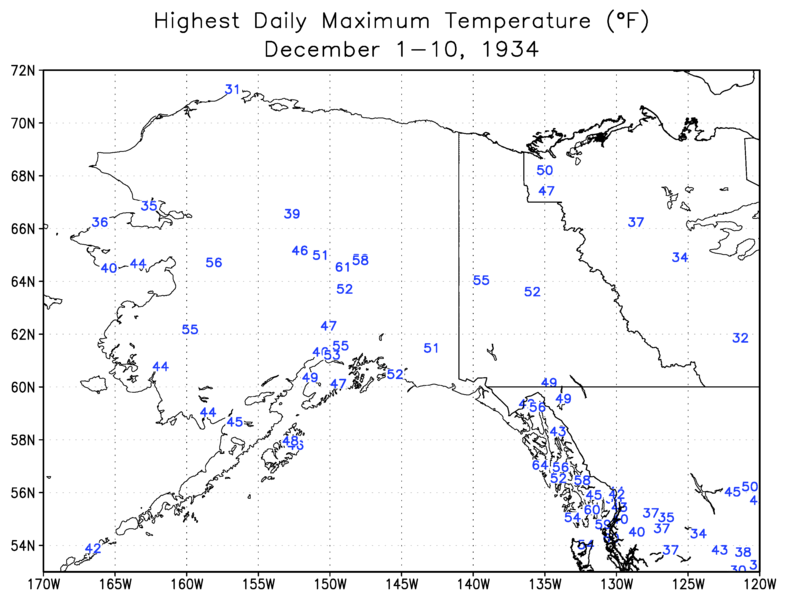
Conclusions on this mind boggling event in Alaska in 1934:
http://ak-wx.blogspot.com/2015/12/december-1934-chinook.html
"For the week ending December 9, 1934, the weekly mean temperature was 41.4°F above the 1981-2010 normal; the next warmest week was in January 1981 (37.8°F above normal).
Reader Mike speculated that such an anomalous event might occur about once every 200 years. If we assume the true peak daily anomaly was +55°F, and if we assume the variance is unchanged over time, then the December 5 anomaly was a little less than +4 standard deviations. In a Gaussian distribution, a +4 SD anomaly would occur once every 31574 days on average, or once every 86 years; so the chance of this happening in any one winter (November-March) might be about 1 in 200. Good guess, Mike! The only additional comment I would make is that this is just a rough estimate, because the temperature variance is unlikely to be stable over time; it is subject to long-term trends and also probably depends on multi-decadal or longer timescale behavior of major climate phenomena like the PDO or ENSO. As I suggested here, it seems that the climate regime of the 1930s may have favored high-amplitude circulation anomalies near Alaska, and of course it may not be a coincidence that the Dust Bowl occurred in the same decade."
metmike: When something like that happens today(extremes like this have always happened on this planet............it's part of the normal weather and this one happened to be in Alaska and in December 1934) we hear that the climate emergency caused it or made it much worse.
This might be true for heavy rain events(with 6% more moisture in the slightly warmer atmosphere) and Summer heat waves(that can be slightly hotter-though the warming is happening most in the coldest places at the coldest times of year-beneficial by most standards) but it's NOT true looking at the objective big picture.
Actually, based on the global warming happening more at the coldest places in the coldest times of year, we can say with high confidence, if an event like this happened today that climate change (not a climate emergency) likely enhanced it.
Maybe not "caused" the event but added a few degrees to the extreme warmth it was able to generate in the (beneficially) warmer Winters up there.
https://www.businessinsider.com/extreme-weather-australia-records-hottest-day-in-history-2019-12


That Alaska Chinook of 1934 very interesting. I never knew of that event. Thanks for sharing. God help us if it happens again. Oh the headlines!
Brian Brettschneider@Climatologist49
As I suspected, presidential impeachments typically occur at the bottom of 11-year solar cycles. #analysis
Now that's funny!
My youngest sister has lived in Anchorage, AK for 37 years. The weather up there has been pretty crazy lately. Going from the mild temps earlier this month, that Larry brought to our attention in this thread, to some extreme cold and very heavy snows expected from a stormy weather pattern the next week:
Grant and I wish that we were living up there right now!!!
Mike's email to Mariann:
Wed 12/25/2019 1:12 AM
Lots of snow coming for Anchorage the next week!
It looked colder a couple of days ago but now, one it looks like one of the most active /snowiest periods since you moved up there Mariann!
4 separate storms coming from the Gulf of Alaska in the next week, each of them dumping several inches of snow.
Your snow totals so far this cold season have been meager but now you will catch up fast.
Looks like normal for the entire month of December is around 15 inches and you will get much more than that in just a week!
2 feet of snow in a week for some of the favored areas??
Last December also featured almost double the normal snow but this will be way up there for most snow in just a week.
https://forecast.weather.gov/MapClick.php?lon=-149.56&lat=61.13#.XgMIDxt7nX5
| National Weather Service A 30 percent chance of snow after 3pm. Increasing clouds, with a high near 13. Southeast wind 5 to 10 mph increasing to 15 to 20 mph in the afternoon. forecast.weather.gov |
Tonight
Snow, mainly before 3am. Low around 12. Calm wind becoming southeast around 5 mph after midnight. Chance of precipitation is 90%. Total nighttime snow accumulation of 2 to 4 inches possible.
Christmas Day
Snow likely, mainly after noon. Cloudy, with a high near 22. East wind 25 to 35 mph decreasing to 15 to 25 mph. Chance of precipitation is 60%. New snow accumulation of less than one inch possible.
Wednesday Night
Snow. Low around 6. North wind around 5 mph. Chance of precipitation is 80%. New snow accumulation of 1 to 2 inches possible.
Thursday
Snow likely, mainly before 9am. Mostly cloudy, with a high near 17. North wind 5 to 10 mph. Chance of precipitation is 60%.
Thursday Night
Mostly cloudy, with a low around -1. North wind around 10 mph.
Friday
A 40 percent chance of snow after 9am. Partly sunny, with a high near 4. North wind 5 to 10 mph becoming northeast in the afternoon.
Friday Night
A 50 percent chance of snow. Mostly cloudy, with a low around 0.
Saturday
A chance of snow. Mostly cloudy, with a high near 16.
Saturday Night
A chance of snow. Mostly cloudy, with a low around 9.
Sunday
A chance of snow. Mostly cloudy, with a high near 18.
Sunday Night
A chance of snow. Mostly cloudy, with a low around 8.
Monday
A chance of snow. Mostly cloudy, with a high near 19.
Monday Night
A chance of snow. Mostly cloudy, with a low around 5.
Tuesday
A chance of snow. Mostly cloudy, with a high near 19.
++++++++++++++++++++++++++++++++++++++
Mike: It was very mild there in Alaska earlier this month, which led to a discussion about your weather on the forum that you might be interested in reading:
Scroll down several pages to get to the Alaska stuff.
https://www.marketforum.com/forum/topic/43837/
+++++++++++++++++++++++++++++++++++
Mariann:
Yes, finally snow but it is going to get in the negatives too. I like snow to cross country in but once it gets to the single digits... I don’t. And below zero... I don’t even want to go out to get the mail.
NWS Anchorage technical discussion from early this morning:
It may not copy right, so use the link:
.LONG TERM FORECAST (Days 3 through 7)... (Friday through Monday)
...Southcentral...
This looks to be possibly one of the most active pattern in many years for the region, as the current model suite shows several storms affecting the region in the extended period, and that`s on top of the first two moving through before it. These all will bring multiple rounds of accumulating snowfall to all of Southcentral, with some pretty impressive totals possible for some coastal locations if the current model projections don`t change (we all know they usually do, as the further you go out in time, the more the model variability increases).
An important feature to watch in later model runs is an unusually strong mid-level polar low off the North Slope, that just sits there while deepening to 477 dm. That in turn allows for a second strong mid-level low on the order of 495 dm to take up residence in the Bristol Bay region. These two systems then act in concert to funnel very cold air from the Arctic into southwest Alaska, with the Alaska Range keeping it just north and west of Southcentral. This in turn allows for a third trough further south in the north Pacific to feed off this funneling of colder air aloft to help induce cyclogenesis (low pressure development), with these storms intensifying as they track just along the baroclinic zone aloft (just east of the trough axis), while the degree of the cold air poised just north and west of the Alaska Range prevents the storm track from moving further west or ingesting warmer air from regions further south. This is because as the low approaches, it does ingest colder air on the backside of each low, as the air will be -30 deg. C at 850 mb (~4400 feet) across southwest Alaska. This air modifies some, but stays cold enough to allow any over-running precipitation to remain as snow.
So now on to the details. Our first storm (for the extended period) moves from the north Pacific on Friday, to western Prince William Sound Saturday morning. This storm will be in a deepening
phase, helping to draw abundant moisture northward.
Quickly on its heels is a second storm that moves from the southwestern Gulf Saturday morning, to western Prince William by late Saturday evening, with more abundant moisture spreading northward.
Then on Sunday, another fairly strong low moves from Kodiak Island, to yep...you guessed it...western Prince William Sound with a more pronounced precipitation shield ahead of it, due to a stronger warm front aloft.
A fourth storm in a deepening phase will then track into the Alaska Peninsula on Monday, with more over-running precipitation moving into the region.