
Eric Snodgrass discusses posibilities of drought in the corn belt.
Thanks very much cutworm!
I love listening/watching Eric's videos.
There is no 89 year drought cycle. He confirms that.
Another thing that he illustrates/emphasizes is the increase in precip in the Midwest over the last several decades, which is making droughts harder and harder to come by.
Our last widespread, major drought was in 2012. The one previous to that was 1988.
So, since 1988, over 3 decades have passed and only 1 major drought in the Midwest. Too much rain and wet soils during the Spring has been more of an issue. The Spring of 2019 was one of the wettest with the worst planting in history for some key locations, especially the Eastern belt.
Soil moisture right now is pretty full. This increases the chances of having planting delays this Spring and decreases the chances of drought but there is plenty of time for that to change:
You can find the maps below on my daily weather summary.https://www.marketforum.com/forum/topic/46689/
It shows how wet that we are. Things are not looking very wet in the Midwest the next 2 weeks.
I think that when we get into March, if we start having some huge precip making storms it will become bullish for the corn...........just because fear of a repeat of last year will be greatly enhanced and the market will be overly sensitive to any signs of it moving in that direction again.
Soilmoisture anomaly:
These maps sometimes take a day to catch up to incorporate the latest data(the bottom map is only updated once a week).
https://www.cpc.ncep.noaa.gov/products/Soilmst_Monitoring/US/Soilmst/Soilmst.shtml#
![]()


Last year.....the spring was historically wet. The crop went in historically late and against all odds, came in just about normal.
If we learned anything last year, the only historically bad weather than will kill a crop is historically dry weather.
2 myths died last year...1.plant in the mud, the crop is a dud. 2. Farmers I’ll switch crops because of late planting. Maybe...but nothing to move prices enough to matter.
Jim M, pretty much true but do not tempt mother nature. She can disguise crop damage and ease crop damage with her weather patterns. Then when least expected last year she could of easily killed that late wet planted crop. We got away with one that was nearly a "hail marry"...not going to happen multiple times.
I’m not sure how I am tempting Mother Nature. If we don’t learn from past experiences, we will fall for the same thing over and over again. I think we all bought into the crop switching mantra and my goodness the crop is so late it will never grow. Neither happened. If anyone falls for that again, they deserve to lose their money.
I’ll go long corn sometime this spring (probably after the planting intentions report) because it is a seasonal trend. But short of a VERY intense drought, I’ll be shorting in mid June to early July.
Seasonal trends seem far more consistent and extremely easy to trade. Set it and forget it. You get away from those wild weather gyrations and getting stopped out only to have the market come back like a yo-yo.
What everybody continues to overlook on better than expected crop yields is that the increase in CO2. by itself is increasing yields by 25%( more than that for beans) compared to what yields would be if we were 100+ parts per million lower, like a century ago.
Also, after the wet Spring, we had wonderful weather in the Cornbelt that helped offset the affects of the horrible, wet start. We also had a late freeze. These are all part of the climate change in the Midwest.
1 widespread severe drought in the last 31 growing seasons in the Midwest when the historical average should have been around 4 droughts during that period. .......more beneficial climate change.
We are experiencing the best weather/climate on this greening planet for most life and growing crops in over 1,000 years and it will be even better in 10 years and the planet will be even greener in 2030 because of the current climate optimum that is being sold fraudulently as a climate crisis/emergency.
Previous to last year's average crop, beans had experienced the 6 highest yielding years in a row.................when we are being told that climate change is going to increase drought and cut crop yields/production.
The is the complete opposite of what its doing. They are using words to try to scare you.
I use graphs of the real data to prove they are wrong. It is very difficult to hurt the crop with these enriched CO2 levels and weather. Higher CO2 also makes plants more water efficient and drought tolerant.
Drought 2012 yields from the natural drought would have been MUCH lower without the extra beneficial CO2!
Haven't use these graphs for awhile..........here goes:
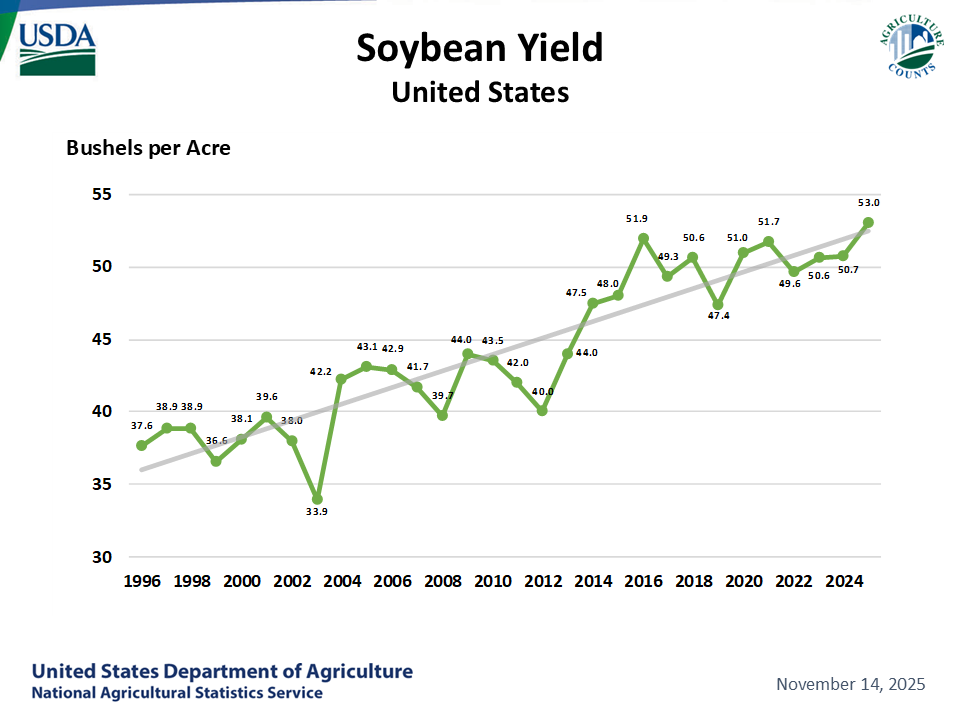
Let's take soybeans for instance. Yields have doubled in the last 30 years:
https://www.nass.usda.gov/Charts_and_Maps/Field_Crops/soyyld.php
There obviously are other contributing factors with genetics and farming technology but the +CO2 and weather have been a big plus.
With Corn, it's a different picture because of the introduction of nitrogen fertilizer causing corn yields to triple real fast and nothing to do with CO2 or weather during that initial tripling. However, recent decades have featured a steady increase, along with a steady increase in CO2 and beneficial weather.
http://crazyeddiethemotie.blogspot.com/2014/10/corn-questions-from-food-inc-worksheet.html

Here is irrefutable evidence using empirical data to show that the increase in CO2 is causing a huge increase in crop yields/world food production.
We can separate the CO2 effect out from other factors effecting crops and plants with many thousands of studies that hold everything else constant, except CO2.
Observing and documenting the results of experiments with elevated CO2 levels, tell us what increasing CO2 does to many hundreds of plants.
Here's how to access the empirical evidence/data from the site that has more of it than any other. Please go to this link:
http://www.co2science.org/data/data.php
Go to plant growth data base:
http://www.co2science.org/data/plant_growth/plantgrowth.php
Go to plant dry weight(biomass):
http://www.co2science.org/data/plant_growth/dry/dry_subject.php
Pick the name of a plant, any plant and go to it based on its starting letter. Let's pick soybeans. Go to the letter S,http://www.co2science.org/data/plant_growth/dry/dry_subject_s.php
Then scroll down and hit soybeans. This is what you get:
http://www.co2science.org/data/plant_growth/dry/g/glycinem.php
Glycine max (L.) Merr. [Soybean]
Statistics
| 300 ppm | 600 ppm | 900 ppm | |
| Number of Results | 238 | 25 | 3 |
| Arithmetic Mean | 48.3% | 71.2% | 61% |
| Standard Error | 2.4% | 7.9 | 11.3% |
This tells us that there were 238 studies with the CO2 elevated by 300 ppm. The mean increase in plant biomass was 48.3% from all those studies.
The individual studies are listed below that.
In the earlier post above that showed soybean yields since 1988 doubling while CO2 increased by 75 ppm, we have strong corroborating evidence.
Here is another piece of powerful corroborating evidence that the increase in CO2 is increasing crop yields. Crop yields are effected by technology and other factors that help boost them in addition to the CO2 and climate.
However, the rest of the plant world on this planet is not:
https://www.nasa.gov/feature/goddard/2016/carbon-dioxide-fertilization-greening-earth
"An international team of 32 authors from 24 institutions in eight countries led the effort, which involved using satellite data from NASA’s Moderate Resolution Imaging Spectrometer and the National Oceanic and Atmospheric Administration’s Advanced Very High Resolution Radiometer instruments to help determine the leaf area index, or amount of leaf cover, over the planet’s vegetated regions. The greening represents an increase in leaves on plants and trees equivalent in area to two times the continental United States."

In findings based on satellite observations, CSIRO, in collaboration with the Australian National University (ANU), found that this CO2 fertilisation correlated with an 11 per cent increase in foliage cover from 1982-2010 across parts of the arid areas studied in Australia, North America, the Middle East and Africa
But each plant/crop is different:
Corn is only benefiting by around half as much as soybeans:
http://www.co2science.org/data/plant_growth/dry/z/zeam.php
Wheat is in the middle:
http://www.co2science.org/data/plant_growth/dry/t/triticuma.php
Cotton is even higher than soybeans, which is expected. Woody stemmed plants benefit the most from increasing CO2. That's not one or 2 studies..........but the empirical data from 43 separate objective scientific studies on just cotton.
http://www.co2science.org/data/plant_growth/dry/g/gossypiumh.php
Gossypium hirsutum L. [Cotton]
Statistics
| 300 ppm | 600 ppm | 900 ppm | |
| Number of Results | 43 | 1 | |
| Arithmetic Mean | 56.5% | 27% | |
| Standard Error | 7.5% | 0 |
frey,
After seeing all the data/evidence, it really is silly to have any other view.
Here's rice with 281 studies:
http://www.co2science.org/data/plant_growth/dry/o/oryzas.php
Barley with 76 studies:
http://www.co2science.org/data/plant_growth/dry/h/hordeumv.php
The effect on beans of CO2 is almost double that of corn because soybeans are a C3 plant and corn is a C4. C3 plants benefit much more. Bean yields would drop over 30% if we went back to levels of 150 years ago.
https://biologydictionary.net/c3-c4-cam-plants/
| Plant Characteristic | C3 Pathway | C4 Pathway | CAM Pathway |
|---|---|---|---|
| Photorespiration Rate | High | Low / Negligible | Very Low / Negligible |
| Leaf Anatomy | Typical | Kranz | Xeromorphic |
| Typical Environments | All | Tropical, elevated daytime temperatures, drought | Dry, arid |
| Stoma Open During the Day? | Yes | Yes | No |
| Number of Steps in Pathway | 1 | 2 | 2 |
| First Molecule Produced in Pathway | 3-phophoglyceric acid | Malic acid or aspartic acid | Mal |
I'm not referring to you guys but most people just have no idea of what the real climate is doing and the massive benefits PROVEN above.
Then, whenever I get into a discussion with somebody that I try to enlighten with authentic data, fact, graphs/charts...........they usually will not believe it.
Cognitive bias...............they have decided they know something(s) and will only believe things that line up with what they think they know and reject things that contradict what they think they know.
It's not that I am much smarter than people that disagree..
The data is the data. If you are basing your position on science..........the data decides, not scary threats that we are in a climate crisis and will have a climate apocalypse by 2030 if we don't stop using fossil fuels.
This is made up! There is no data anywhere that shows anything like that.
In 2030, the planet will likely be even greener! Why wouldn't it based on the DATA you just looked at?