Welcome! March (8) coming in like a LAMB!
Keep giving thanks to be living in the best time of human history!
Scroll down and enjoy the latest comprehensive weather to the max...... occurring because of the natural physical laws in our atmosphere as life on this greening planet continues to enjoy the best weather/climate in at least 1,000 years(the last time that it was this warm) with the added bonus of extra beneficial CO2.
Potential change to much colder during the 2nd half of March. Still thinking this......which is pushing ng higher today.
Never too old: Reasons to be thankful here in 2020!
https://www.marketforum.com/forum/topic/45623/
Winter Weather Forecasts
https://www.wpc.ncep.noaa.gov/wwd/winter_wx.shtml
Here are the latest hazards across the country.
 |
Purple/Pink/blue on land is cold/Winter weather. Brown is wind, Green is flooding. Gray is fog. Reddish is a red flag advisory.
Go to the link below, then hit the location/county on the map for details.
https://www.spc.noaa.gov/ Go to "hazards"
https://www.mesonet.org/index.php/weather/map/us_air_temperature/air_temperature

https://www.mesonet.org/index.php/weather/map/wind_chill_heat_index1/air_temperature

Current Weather Map
| NCEP Days 0-7 Forecast Loop | NCEP Short-Range Model Discussion | NCEP Day 3-7 Discussion |


Current Jet Stream

| Low Temperatures Tomorrow Morning |

Highs today and tomorrow.


On the mild side but turning colder N.Rockies/Plains.
Colder changes early week 2 though.
Highs for days 3-7:


Reds shrinking, new blues making the scene to the northwest.
https://www.wpc.ncep.noaa.gov/medr/medr_mean.shtml


Surface Weather features day 3-7:
Very active.......especially southern stream. Turning Much colder Northcentral

Liquid equivalent precip forecasts for the next 7 days are below.
Heavy rains up to the S.Midwest(flooding south of that) with a couple of events.
Day 1 below:
http://www.wpc.ncep.noaa.gov/qpf/fill_94qwbg.gif?1526306199054

Day 2 below:
http://www.wpc.ncep.noaa.gov/qpf/fill_98qwbg.gif?1528293750112

Day 3 below
http://www.wpc.ncep.noaa.gov/qpf/fill_99qwbg.gif?1528293842764

Days 4-5 below:
http://www.wpc.ncep.noaa.gov/qpf/95ep48iwbg_fill.gif?1526306162

Days 6-7 below:
http://www.wpc.ncep.noaa.gov/qpf/97ep48iwbg_fill.gif?1526306162

7 Day Total precipitation below:
https://www.wpc.ncep.noaa.gov/qpf/p168i.gif?1566925971

Excessive rain potential.............increasing this week!
Mesoscale Precipitation Discussions
Current Day 1 Forecast Valid 16Z 08/30/19 - 12Z 08/31/19 |
Day 1 Threat Area in Text Format
| Day 2 and Day 3 Forecasts |
Current Day 2 Forecast Valid 12Z 08/31/19 - 12Z 09/01/19 |
Day 2 Threat Area in Text Format
Current Day 3 Forecast |
Severe Storm Risk the next 8 days:
Increasing this week, mainly in the south.
Current Day 1 Outlook | Forecaster: Grams/Leitman Issued: 30/1238Z Valid: 30/1300Z - 31/1200Z Forecast Risk of Severe Storms: Marginal Risk |
Current Day 2 Outlook | Forecaster: Mosier Issued: 30/0537Z Valid: 31/1200Z - 01/1200Z Forecast Risk of Severe Storms: No Svr Tstms |
Current Day 3 Outlook | Forecaster: Mosier Issued: 30/0725Z Valid: 01/1200Z - 02/1200Z Forecast Risk of Severe Storms: No Svr Tstms |
Current Day 4-8 Outlook |
Last 24 hour precip top map
Last 7 day precip below that
https://www.wunderground.com/maps/precipitation/daily


Current Dew Points

Latest radar loop
http://www.nws.noaa.gov/radar_tab.php


| (3400x1700 pixels - 2.2mb) Go to: Most Recent Image |

Go to: Most Recent Image
You can go to this link to see precipitation totals from recent time periods:
https://water.weather.gov/precip/
Go to precipitation, then scroll down to pick a time frame. Hit states to get the borders to see locations better. Under products, you can hit "observed" or "Percent of
Soilmoisture anomaly:
These maps sometimes take a day to catch up to incorporate the latest data(the bottom map is only updated once a week).
Wet soils in the Midwest with planting starting in 2 months. Plenty of time to dry out but Spring Storms with heavy precip will be bullish for corn.
https://www.cpc.ncep.noaa.gov/products/Soilmst_Monitoring/US/Soilmst/Soilmst.shtml#
![]()


Drought Monitor maps:
Latest: The first map below is the latest. The 2nd one is from last week.
February March 5: No drought anywhere in the Midwest.
The maps below are updated on Thursdays.
https://droughtmonitor.unl.edu/


The top map is the Canadian ensemble average, the maps below are the individual members that make up the average at the end of week 2.
+++++++++++++++++++++++++++++++++++++++++
Each member is like the parent, Canadian model operational model.......with a slight tweek/variation in parameters. Since we know the equations to represent the physics of the atmosphere in the models are not perfect, its useful to vary some of the equations that are uncertain(can make a difference) to see if it effects the outcome and how.
The average of all these variations(ensembles) often yields a better tool for forecasting. It's always more consistent. The individual operational model, like each individual ensemble member can vary greatly from run to run.........and represent an extreme end of the spectrum at times. The ensemble average of all the members, because it averages the extremes.............from opposite ends of the spectrum.........changes much less from run to run.
End of week 2....................0z Canadian ensembles:
Updated 12z maps available this late...........turning colder late week 2 vs previous solutions. Potential for another polar vortex incursion south...on some solutions, mainly this particular model!
Starting with last week below:
Last Friday: 12z run. Much milder and looky here, the big upper ridge in the Southeast is making a come back after taking a break for a couple of weeks. Deep trough backs up/retrogrades west. Heavy precip midsection!
Sunday: Average is very mild, zonal, west to east flow, although some individual members have an amplified trough in the middle to Rockies. Some have upper level ridge rebuilding in the Southeast. Not too many have much northern stream influence.
Monday: It's all southern stream dominated and an upper level ridge building in the South. The trough out west keeps retrograding/backing up farther west each run. Extremely mild eastern 2/3rds.
Tuesday: Mild. All southern stream. Zonal average but some individual solutions are amplified. Probably not a stable pattern...........it will morph to something else.
Thursday: VERY MILD. All southern stream. Universal agreement by every member. How long will this last beyond 2 weeks? Upper trough now just off the West Coast and mild Pacific air spreading across the entire country from west to east.
Saturday: VERY MILD
Sunday: VERY MILD!
Monday: Very mild, zonal flow. All the cold is locked up by the North Pole.
Tuesday: The average is still mild and zonal but many to most individual solutions do NOT look like the average. A few are trying to bring the northern stream and cold air in. Some have an upper level ridge in the Southeast. Vast majority are active with southern stream and WET. Snow in the far north?
Wednesday: MUCH deeper trough West and stronger ridge in the Southeast. VERY WET!
Thursday: Ridge in the Southeast is back. Deep trough West. Warm and VERY wet!
Saturday: Colder, especially north! At a chess tournament today. More on Sunday.
Sunday: Here comes more (-: Northern stream with cold air is coming alive! Ridge in the East is obliterated. Still some hold outs. However, ridging from Northeast Pacific to Alaska is connecting nicely with downstream troughing which will provide a good coupled to usher cold air masses south thru Canada. How this interacts with the southern stream remains to be seen. Will the southern stream just be suppressed much farther south or will there be a big battle in the center of the country that gradually sinks southward?
Monday: Upper level Ridge in Alaska and downstream trough in Canada is a favorable couplet for cold air to track south.
360h GZ 500 forecast valid on Mar 24, 2020 12 UTC


Forecasts for the control (GEM 0) and the 20 ensemble members (global model not available)
Individual GFS ensemble solutions for the latest 0z run:

We were able to put on anhydrous ammonia and chisel plow the last 2 days in west central Illinois. Rain all day today put an end to fieldwork !
GFS Ensemble mean(average of all the individual solutions above). The first map is a mid/upper level map. The 2nd one is a temperatures map at around 1 mile above the surface. These are anomalies(difference compared to average).
NCEP Ensemble t = 360 hour forecast
Last Sunday: Massive positive anomaly in the N.Pacific has backed up a bit with downstream negative anomaly in the West, especially W. Canada to Alaska.........where the coldest air is most likely to be aimed. Is the upper level ridge in the Southeast going to rebuild?
Monday: Even more massive positive anomaly in the N.Pacific. Downstream neg anomaly West Coast. Upper level ridge rebuilding downstream of that, in the Southeast. WARM, especially Southeast.
Tuesday: Huge positive anomaly in the N.Pacific continues to retrograde, forcing all the features to its east, to also back up west. Will this allow a new negative anomaly and cool air develop in the Northeast? The last few maps suggest that but thats an unreliable period. Positive anomalies over Greenland/N. Atlantic would favor that.
Thursday: Huge positive anomaly in the N.Pacific still there. Downstream trough along the West coast, then modest positive anomalies from the Plains eastward........the recipe for very mild temps.
Saturday: Massive positive Anomaly in N.Pacific..........modest positive Eastern North America. Growing negative anomaly north of Alaska. Cold air cut off.
Sunday: Huge positive anomaly in N.Pacific.......large area of positive anomalies across much of the US to Eastern Canada. Negative anomaly north of Alaska........where the cold will be LOCKED UP.
Monday: Same huge positive anomaly in N.Pacific. Center of growing large positive anomaly in far Eastern Canada with positive anomalies extending back across much of the USA. Just 1 modest negative anomaly , still north of Alaska.
Tuesday: Huge positive anomaly N.Pacific.
Wednesday: Just like yesterday.
Thursday: Huge positive anomaly N.Pacific.....been on the maps for weeks. Pretty large positive anomaly Southeast Canada extending well south into the US. Modest negative anomaly north of Alaska. This is almost the opposite of what is needed for cold air outbreaks in the East.........which is why it will be very mild. Strong signal for HEAVY precip. Potential for excessive rain event(s).
Sunday: Potential pattern change. Massive positive anomaly N.Pacific may be building.............across Alaska and points eastward in the higher latitudes. Downstream, with a trough/weak negative anomaly, this sets up a much more favorable couplet for cold air masses to move south, across Canada, aimed at the US. Positive anomaly(s) that have dominated for weeks in the US are shifting east, with modest negative anomalies coming in from the west, already in the Plains here at the 2 week time frame.
Monday: Huge positive anomaly N. Pacific extending north of Alaska connects to negative anomalies downstream in Canada that will usher cold air southward. Positive anomalies trying to hang on' along and off the East Coast.

Latest, updated graph/forecast for AO and NAO and PNA here, including an explanation of how to interpret them...............mainly where they stand at the end of 2 weeks.
https://www.marketforum.com/forum/t
Previous analysis, with the latest day at the bottom for late week 2 period.
Discussions, starting with the oldest below.
Last Friday: ++AO stays positive. NAO drops to 0, might mean some cool shots along the East Coast.
Sunday: AO and NAO stay solidly positive and PNA solidly negative. The recipe for widespread warm weather in the middle latitudes and frigid weather being bottled up in the high latitudes(Arctic). Which will be seeing some its coldest temperatures of the Winter.
Monday: AO stays positive but a few members are close to 0 at the end of 2 weeks. NAO a bit above 0. -PNA increases to near 0 at the end of 2 weeks. Nothing to write home about except the potential is a tad higher for cold today for the 2nd half of March........just a tad!
Tuesday: For the first time in ages, the AO actually drops down near 0 at the end of 2 weeks after being incredibly positive in February. This at least means that there is a better chance than before for late March can turn colder(vs average). NAO drops to just above 0. PNA increases but stays just below 0. Will have to see if these changes lead to something but they are late week 2, a low skill time frame.
Wednesday: AO and NAO drop down lose to 0 but still slight +. PNA still a bit negative. Nothing to write home about.........or significant to note on a forum (-:
Thursday: AO drops close to 0, NAO stays just above 0. PNA stays negative. Nothing that interesting.
Sunday: AO has a wide spread at 2 weeks with potential pattern change to colder. Several members dip below 0 but the majority stay positive. NAO stays positive and PNA negative which still favor a milder pattern at weeks(cold in the West). But the outlook at 2 weeks is changing with the northern stream strengthening. Question is how far south will it send cold air to.
Monday: AO drops to near 0 with several below 0 at 2 weeks. Over the last month+, the amazingly +AO has made it impossible for cold from high latitudes to be transported south into the mid latitudes other than brief incursions. The AO is changing and becoming more favorable for the cold to push south. Ideally, it would become solidly negative but that is NOT there yet. NAO a bit positive and PNA still negative will try to limit how deeply south the cold from Canada penetrates once it gets transported down here.
National Weather Service 6-10 day, 8-14 day outlooks.
Updated daily just after 2pm Central.
Temperature Probability
 Precipitation Probability

| the 8-14 day outlooks ArchivesAnalogsLines-Only FormatGIS Data | |
Temperature Probability | |
 | |
Previous posts:
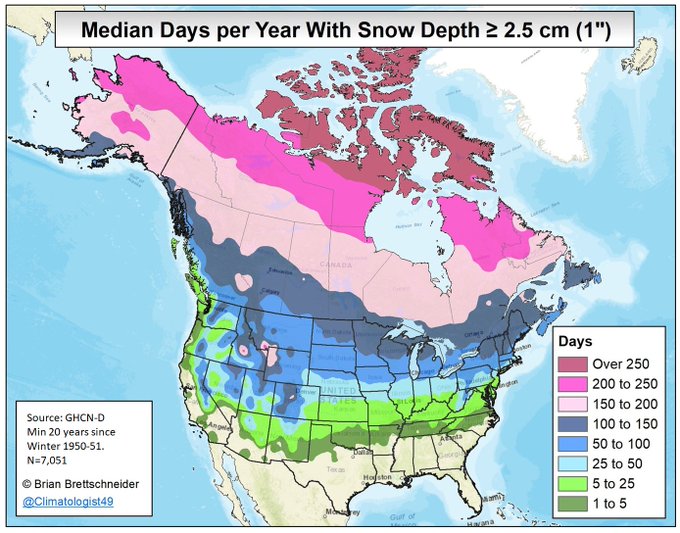
Long-term median number of days per year with snow depth of 1"+ on the ground.
++++++++++++++++++++++++++++++++++++
By metmike - Feb. 11, 2020, 3:33 p.m.
NEW: The long lived upper level ridge in the Southeast US will be breaking down during week 2! This will allow cooler air to affect the East/Southeast. However, air masses will not be very cold coming from the Pacific or from Canada in week 2.
+++++++++++++++++++++++++++
By WxFollower - Feb. 12, 2020, 3:33 p.m.
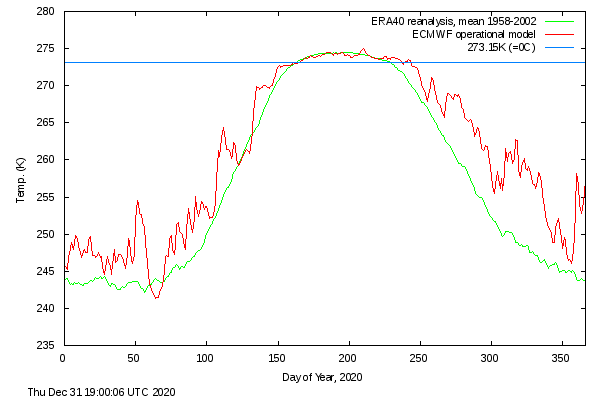
The Arctic (80N to 90N) is cooling down again (see image below). Will it finally get to below normal/colder than 245 K (-28 C) with the extreme and long-lasting +AO?? I'm still hoping.
Note on the image that the coldest day's normal there (per green line) still isn't til ~2/26, when it drops briefly to 242 K (-31 C or -24 F). Also, note that the normal for exactly one month from today (3/12) is still about the same as today's 244 K. So, the point is that the Arctic can still churn out very cold air through about a month from now. That's why if the delivery/upper winds are just right and it is fast enough, it can still get mighty cold even down into the southern US into mid March despite a good bit higher sun by then. March is rarely dull from many perspectives and this is one of the reasons, the battle of the lingering very cold Arctic and the warming in the temperate regions from a higher sun. March, the weather enthusiast's dream month!
Arctic daily mean temps through today, 2/12/2020:
+++++++++++++++++++++++++++++++
By metmike - Feb. 12, 2020, 7:43 p.m.
Great points and graph Larry!
This also illustrates the fact that global warming/climate change is warming the coldest places, during the coldest times of year the most.
Since your graph shows this year, Winter only , I provided a year round temp profile for 2016-2018 below as an example of temperatures in the Arctic for the entire year.................staying milder/less harsh in the normally frigid environment of Winter but then every Summer, temperatures are very close to and sometimes BELOW average.
The graph below this one shows each year going back over 45 years. You may need to wait a couple of seconds for it to load. What is amazing is that during the "cold" season, temperatures are consistently above to much above average(less harsh) but every Summer they get back to average(and much of the time, even a bit below average.
So most people may think that its warmer temperatures during the melt season that is melting all the ice but temperatures have frequently been a bit BELOW average during the melt season, which melts less ice.
What is actually happening is that during the rest of the year, during the freeze season temperatures are well above average so not as much of the ice that melted the prior Summer freezes as deeply. This thinner ice, is then easier to melt the next Summer, even with temperatures that are average or even a tad below average(but above freezing and with the sun shining 24 hours a day.
The ice loss was pretty great up until 2012. Since then it has (temporarily) stabilized.
We should note too, that SEA ice is already floating in the sea. Melting it does not add much to sea levels(like an ice cube melting in your drink). This is a big reason for why all that melting Arctic sea ice prior to 2012 did NOT cause an acceleration of the rate of sea level increase.
https://wattsupwiththat.com/2018/11/10/uah-arctic-temperature-profile/

This (painstakingly created) animation shows the DMI above 80N from 1970 thru Oct 2018. Images sourced from DMI’s Arctic Temperatures page.

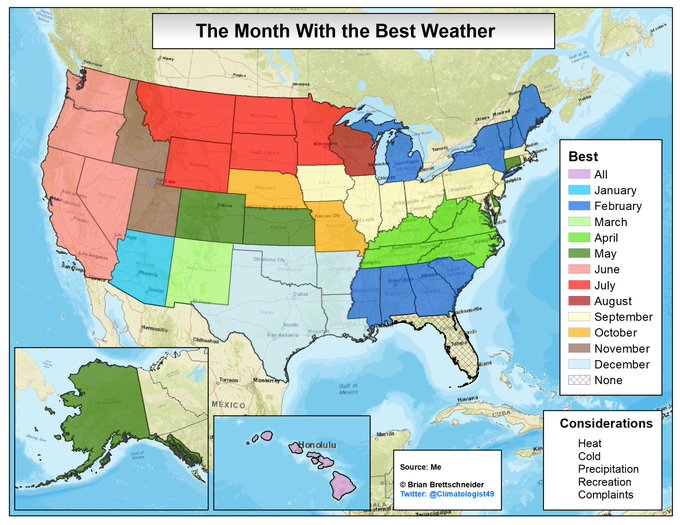
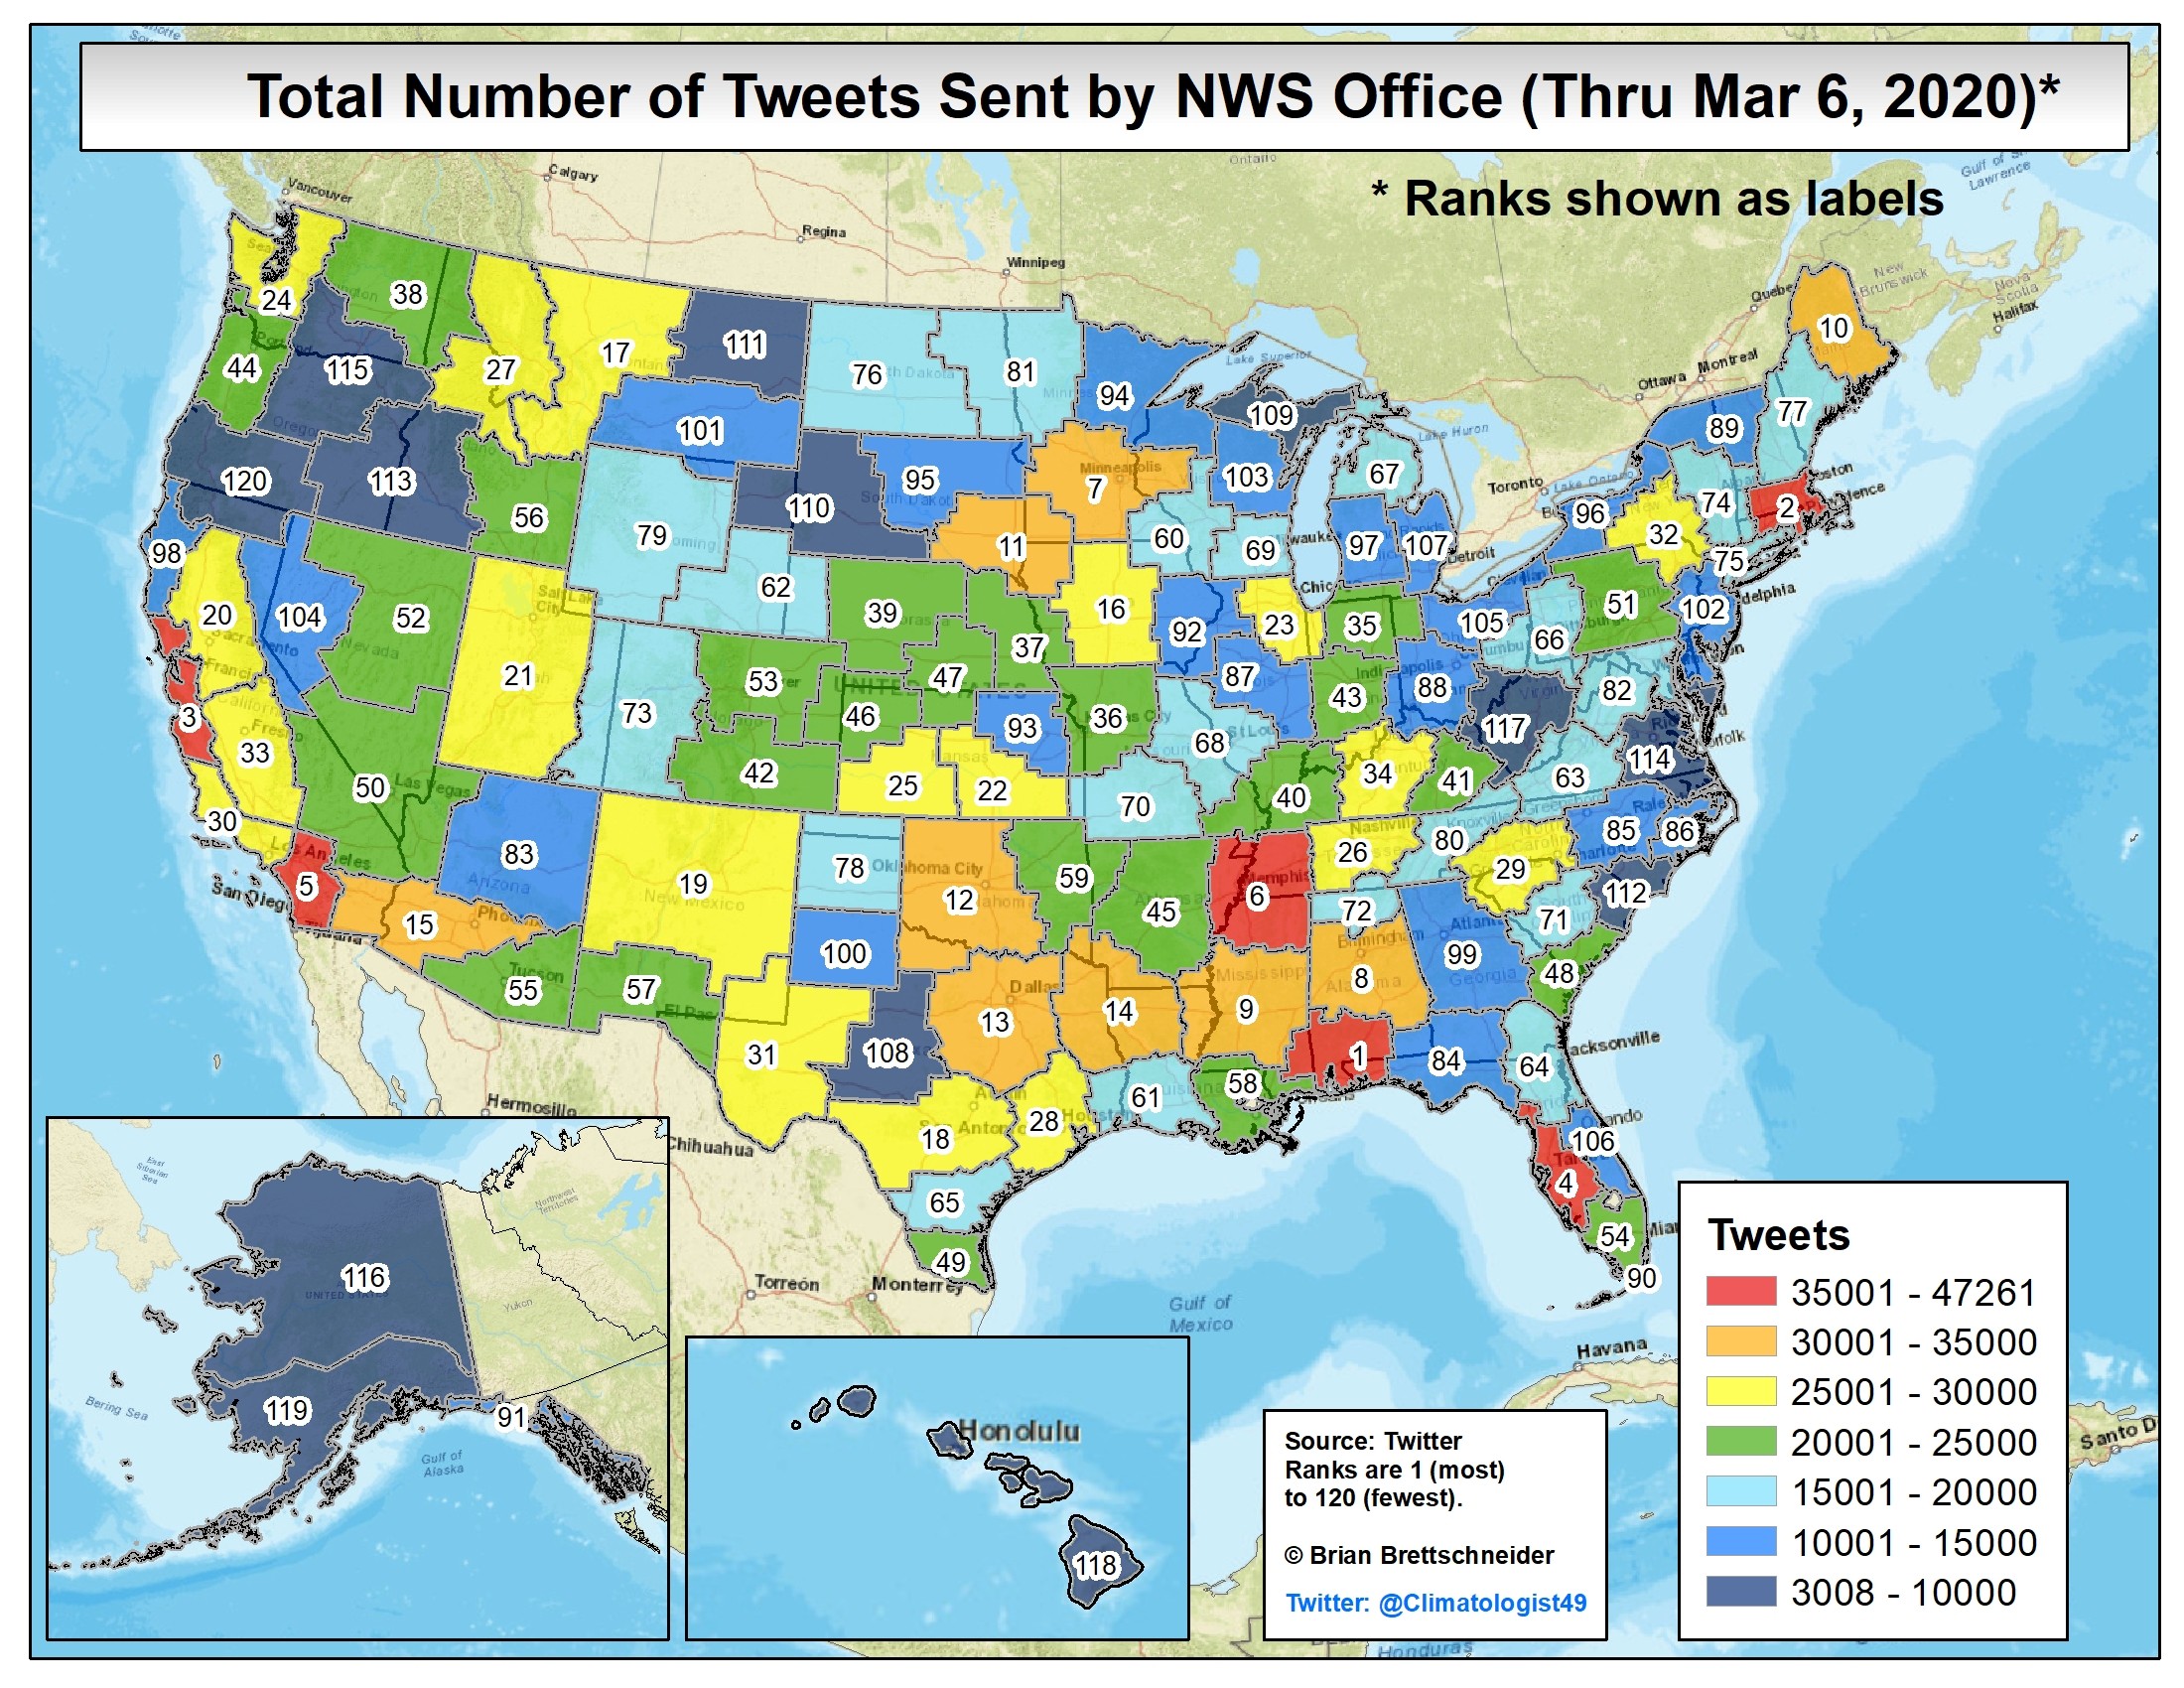
Brian Brettschneider@Climatologist49
·
Which month of the year has the Best Weather™?
++++++++++++++++++++++++++++++
If you are wondering why it’s been such a mild winter in the US and many other areas in the mid latitudes look no further. The vigorous polar vortex has all the cold air corraled!
·
Near perfect circular symmetry in the strong #PolarVortex right now and very close to being centered right over the North Pole. About as far as you can get from any sort of disruption or split.
++++++++++++++++++++++++++++++++
https://twitter.com/i/status/1229431021457702912
By metmike - Feb. 27, 2020, 11:59 a.m.
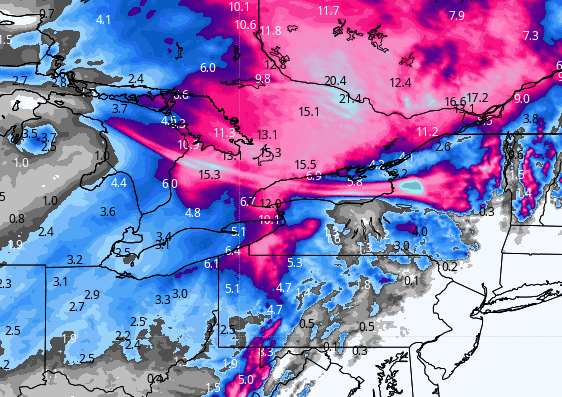
Can you say #fetch? Amazing "fetch" from Lake Huron across Ontario. Note sure I've ever seen a Lake Effect fetch that focused and defined over such a long distance on the models before. NAM snowfall.
+++++++++++++++++++++++
By WxFollower - Feb. 29, 2020, 10:41 p.m.
The Arctic’s coldest so far this winter was today at 243K. Models suggest further drops to possibly as low as 240K over the next 3-5 days.
+++++++++++++++++++++++++++++++++++++
By WxFollower - March 4, 2020, 2:18 a.m.
The Arctic says "what spring?"
Re: Re: Re: Weather Thursday March 5, 2020
By metmike - March 5, 2020, 1:34 p.m.
Thanks Larry, the longer the cold stays bottled up in the high latitudes, the longer we stay mild here in the middle latitudes.
Email: meteormike@msn.com | IP Address: None | Cookie ID: None
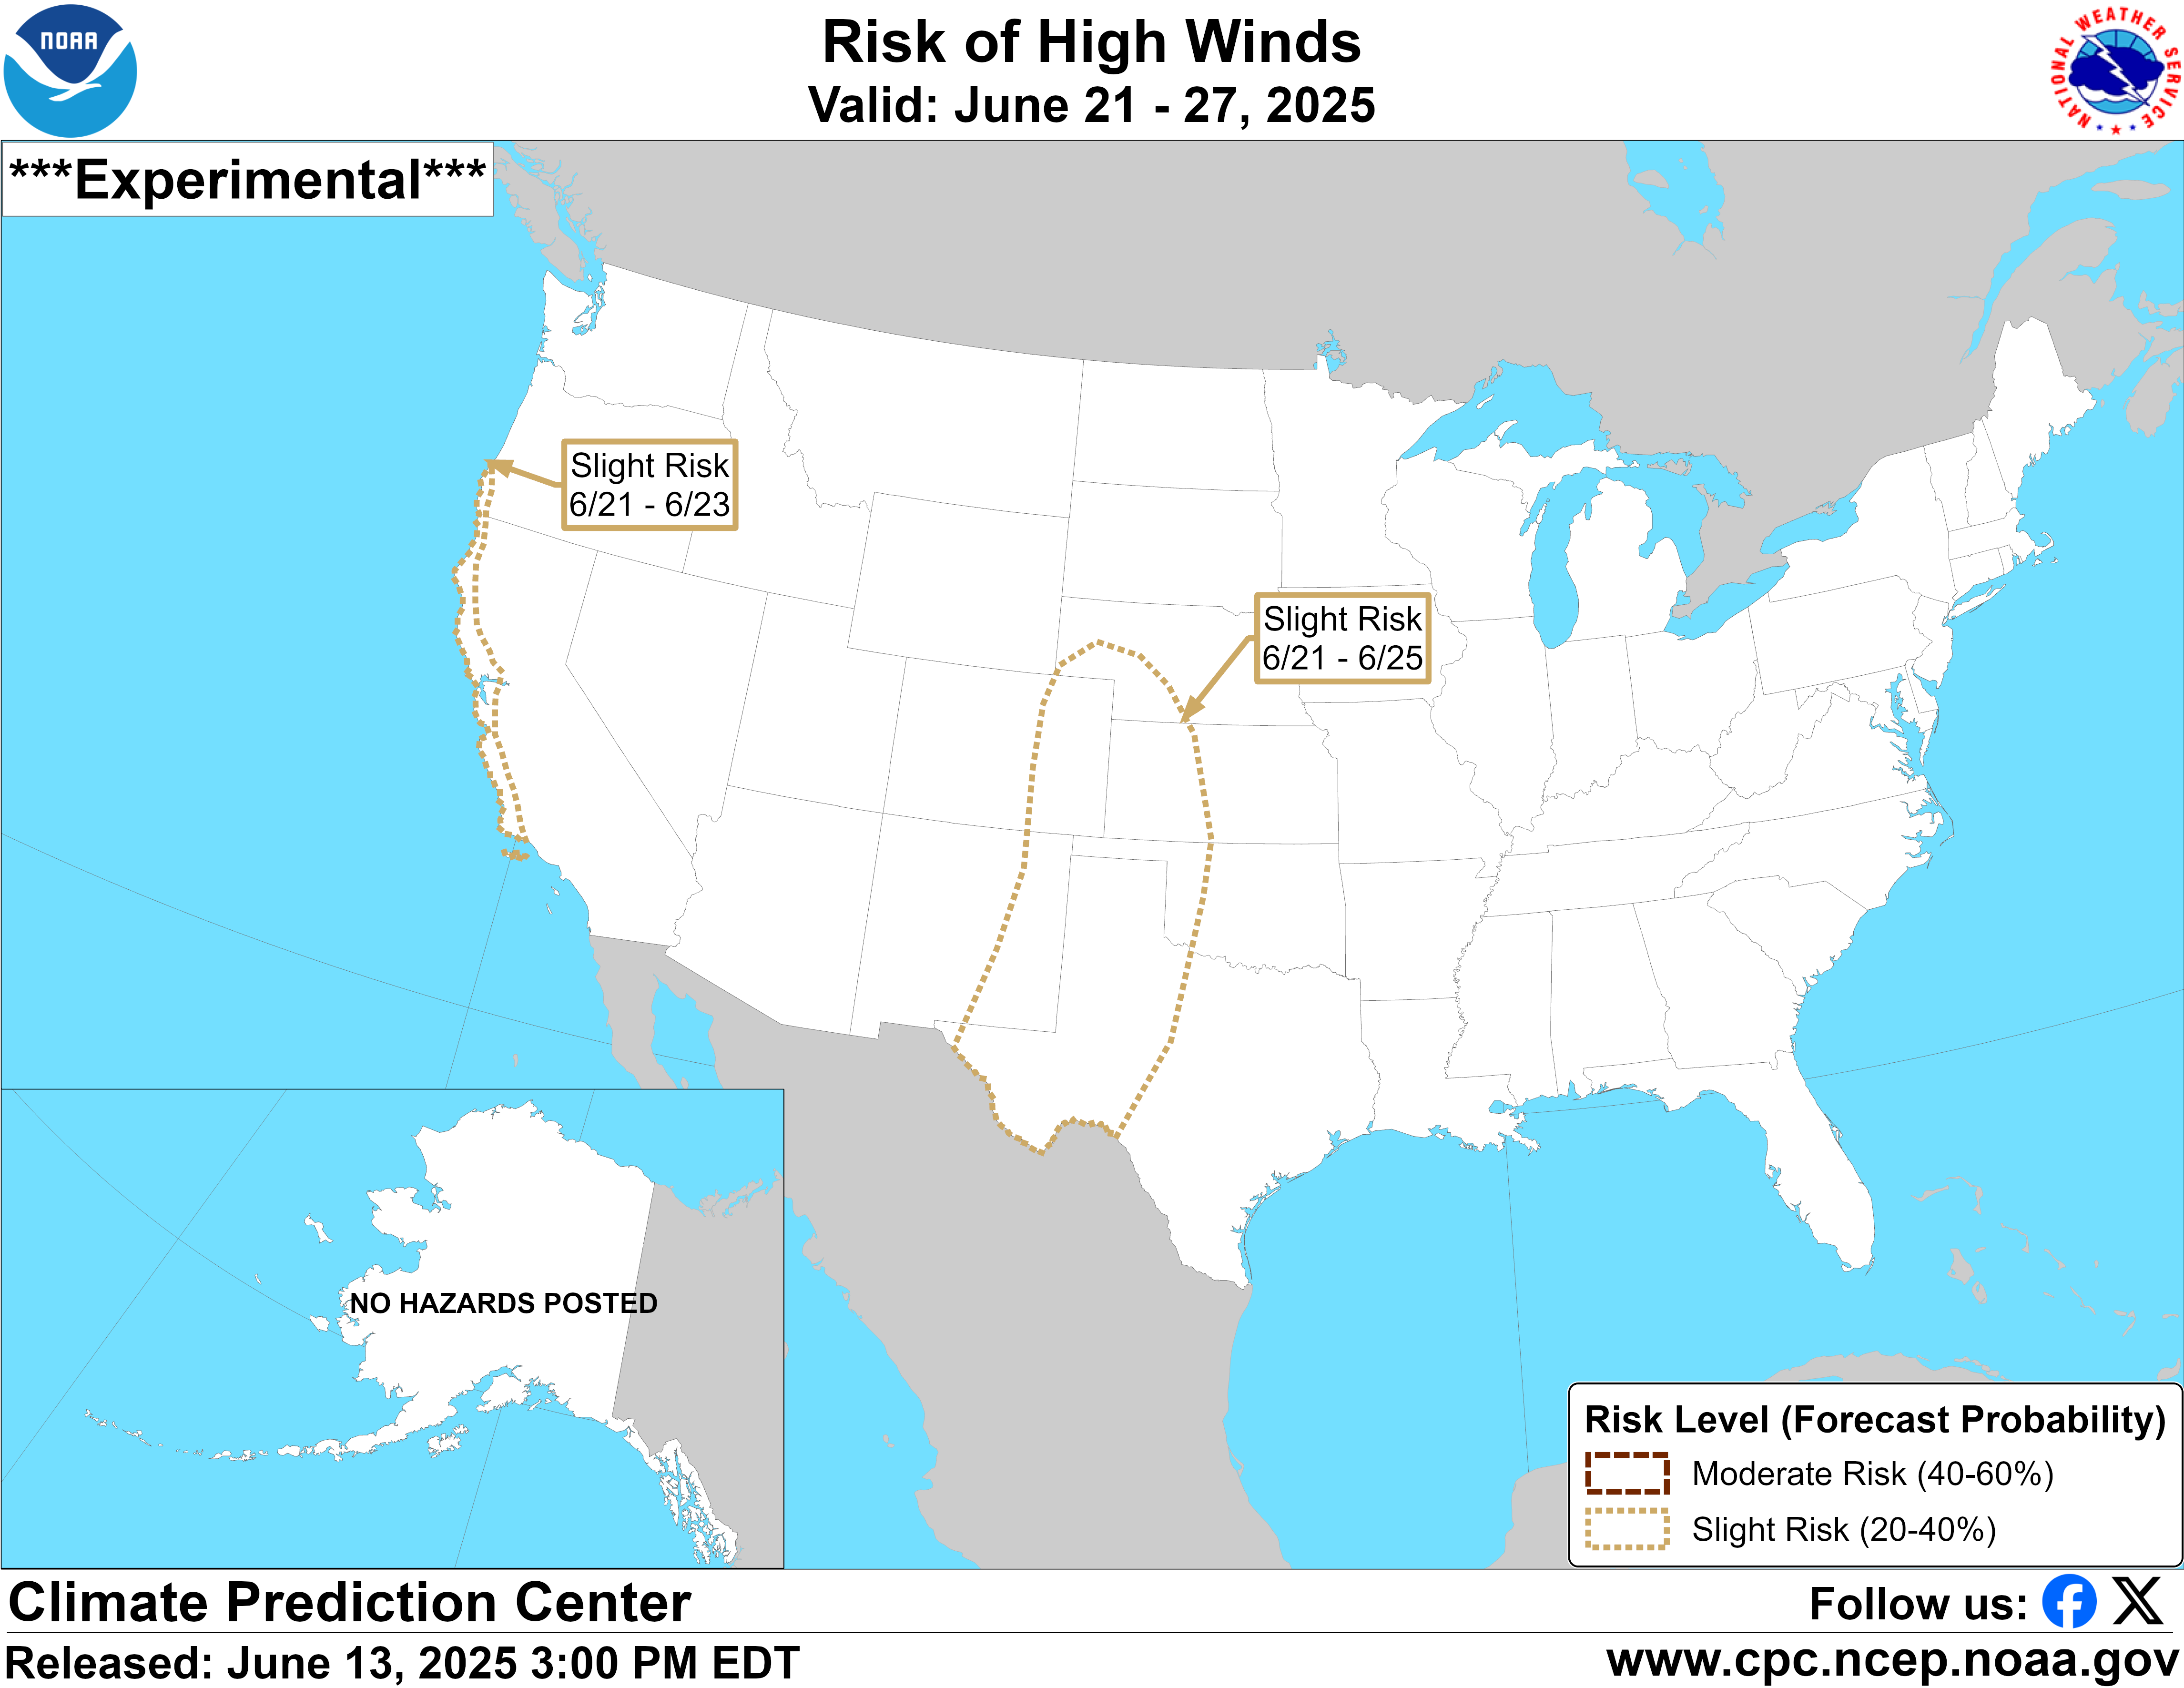
By metmike - March 8, 2020, 1:33 p.m.
Pattern change coming in week 2 features the Arctic releasing some of its cold southward.
By metmike - March 8, 2020, 1:49 p.m.
https://twitter.com/Climatologist49/status/1236349149374599168/photo/1

