Tuesday: The rate of increase has slowed down a bit the past 6 days vs the previous 6 days. Numbers are still increasing but considering that part of it is still from catching up on the testing, mitigation is definitely making a difference. Keep up the good work for a few more weeks. Things will be looking much better soon and well before then.
Monday: Still possible to see the rate go back up faster this week. Monday featured them dropping the Sunday number by 1,300.......very strange. Monday number was higher though the rate over the last 5 days has slowed down.
SUNDAY:
They made some big changes again to past data on Friday. This time decreasing 3-23 and increasing 3-24 by over 1,200.
The huge changes they have made to past data on a couple of occasions, makes me skeptical regarding how reliable this data is but if these numbers/this data is accurate, then the rate of increase IS slowing down.
Please scroll down to the bottom for the latest updates. The information above that was posted earlier in the month based on old data. We are updating and analyzing the latest data and adjusting projections several times a day. Today's data will be ancient history in a few days as we continue to track new cases(many that have been there and are actually old cases). So today's/this weeks numbers are NEW cases +OLD cases just now tested. With time, the number of OLD cases not tested yet, will drop and the daily numbers will be mostly NEW cases. This will give us a more clear/true picture of the spreading.
Best sites to get the most updated statistics on the Coronavirus!
On the US data below. I am updating it thru the day at the bottom based on the best information sites. I will look at the graph of it every day and use calculus/math to try to see signs of the peak here. The peak in the panic might be RIGHT NOW(in March) based on observations and speculation.
After the peak has passed, this will all seem more clear.
Shutting everything down now is a really good thing! It's helping to control the spread tremendously. Short term pain for longer term gain! The Coronavirus is worse than the flu for mainly older people(scroll down for more)......compromised immune systems and those with serious health problems..............mainly because much of that population is able to be protected from the flu every year with immunization shots. The threat to those not in that population is very, very small and the panicked fears are totally, completely and insanely unjustified.
If there were no flu vaccine's to protect so many people(especially the sick and old) the fatality and transmission rate would look very similar to the Coronavirus. We are 1,000 times more panicked and afraid of the Coronavirus compared to the flu because of the way that our news is delivered in todays age:
Coronavirus-how will history in 2060 see it?
Started by metmike - March 14, 2020, 11:57 p.m
https://www.marketforum.com/forum/topic/48938/
++++++++++++++++++++++++++++++++++++++++++++++++++++++++++++++++++++++++++++++++++++++
Global numbers below:
COVID19INFO.LIVE
Coronavirus COVID-19 Global Cases by the Center for Systems Science and Engineering (CSSE) at Johns Hopkins University (JHU)
https://www.arcgis.com/apps/opsdashboard/index.html#/bda7594740fd40299423467b48e9ecf6
Thanks Mike!
COVID-19 in US and Canada:
https://coronavirus.1point3acres.com/en
Note the graphs. When an inflection point is reached on the graph, it will be a strong indicator that we are peaking. I will try to comment daily on that graph(like we did in accurately seeing China's peak) and use math(inflection point in calculus) to interpret it.
Corona Virus
68 responses |
Started by kermit - Feb. 8, 2020, 11:30 a.m.
https://www.marketforum.com/forum/topic/47120/
Understanding the Virus with Math
5 responses |
Started by joj - March 11, 2020, 8:29 a.m.
https://www.marketforum.com/forum/topic/48764/
The data for each day continues to get updated through the day, so today, the 14th, only being half over looks less impressive now compared to what the total will end up being. We are still increasing at an accelerating rate which should be expected to continue for at least the next several days...........probably longer than that. My guess is that we will have peaked in less than a month.
YW buck!
Here's more:
*Crazy Coronavirus Compilation
Started by metmike - March 13, 2020, 12:13 p.m.
Here's another good source:
https://en.wikipedia.org/wiki/2019%E2%80%9320_coronavirus_pandemic
.jpg)
The goal of community mitigation, (1) delay outbreak peak (2) decompress peak burden on healthcare, known as flattening the curve (3) diminish overall cases and health impact.[271][272]
A key part of managing an infectious disease outbreak is trying to decrease the epidemic peak, known as flattening the epidemic curve.[271] This helps decrease the risk of health services being overwhelmed and providing more time for a vaccine and treatment to be developed.[271] Non-pharmaceutical interventions that may be taken to manage the outbreak include personal preventive measures (as described in the section above) such as hand hygiene, wearing face-masks and self-quarantine; community measures aimed at social distancing such as closing schools and cancelling mass gathering events; community engagement to encourage acceptance and participation in such interventions; as well as environmental measures such as cleaning of surfaces.
metmike: This is exactly what we are doing right now with gusto. With certainty, all the current draconian/extreme actions will be deceasing the eventual peak to a more manageable number vs just modest actions.
These are most of the Cornavirus threads:
Crazy Coronavirus Compilation
Started by metmike - March 13, 2020, 12:13 p.m.
https://www.marketforum.com/forum/topic/48881/
Let's go back and look at the number of daily new cases since 3-3-2020.
The first number is the increase compared to the previous day. Clearly, that number is soaring higher.
The 2nd number is the increase compared to the previous day's increase...........a key metric in determining when we will be seeing the inflection point. When this 2nd number is consistently not going higher and especially if the 2nd number can put in numerous days of actually being lower, then we might be topping out for the RATE of transmission.
New daily cases will still be going up when we start to see a deceleration.............but just not as fast. This happens first, before daily cases go down which is what we obviously want to see but seeing the RATE of increase, losing momentum will give us the first clue of it topping in the US.
Since the daily numbers are pretty volatile, we need numerous data points to have any confidence of a reliable signal. We are still going in the wrong direction right now, so this will probably not happen in the next week.
Let's try to update and analyze this daily, adding the new number each time, 3-15, 3-16, 3-17........and so on. Each day, ends at Midnight CDT.
https://coronavirus.1point3acres.com/en
3-3 21
3-4 31+10
3-5 75+46
3-6 99+24
3-7 116+17
3-8 121+5
3-9 179+58
3-10 289+110
3-11 247-42
3-12 423+176
3-13 600+177
3-14 700+100
3-15 117 and counting
In tracking this number closely, I have become aware that revisions of some previous days are being made.
The total number is 3,127. I am wild guessing that we will easily exceed 10,000 and could get to 20,000 by the end of the month. We need many more data points with the ramped up testing and reporting to get a better idea but the exponential increase right now, may be continuing(yesterday's +100, down from the previous day may be an outlier)
https://www.marketforum.com/forum/topic/48902/
Re: Re: looking at corona fatality rates.
By metmike - March 14, 2020, 4:42 p.m.
https://data.oecd.org/healthcare/influenza-vaccination-rates.htm
metmike: The geriatric population gets protected from the flu at the highest rate vs the younger people because of their higher % getting the flu shot.
We know that the flu kills them at a higher rate than younger people but the actual rate is distorted because 70% of the older people in the US get the flu shot.
If we only looked at the deaths from the flu in older people of those NOT protected by the flu shot( ``````around 30%) we would find that the flu is actually 2 to close to 3 times more fatal(in the non protected). In fact, the 70% of those elderly that get the flu shot is even higher for those that are sick and elderly and get the flu shot.......possibly, 90% of those that are sick and elderly get the flu shot.
That last fact is profound because it explains a big part of why the Coronavirus is killing the sick and elderly at a massively greater rate than the rest of the population
Since there is no vaccine or protection for the Cornonavirus, we are comparing deaths to old people from Coronavirus in the 100% unprotected population to deaths from the flu in those 65+ that come mainly from the 30% of those that are unprotected and many healthy but represent most of the total number(giving us a very distorted picture/representation of how deadly the flu is for the sick/old...........that are mostly protected).
Italy has the highest % of sick old farts of any country...............and this explains why their death rate is so much higher than other countries.
https://www.cdc.gov/flu/highrisk/65over.htm
metmike: That 70-85% rate would be even higher if not for this age bracket getting the flu shot at a much greater rate, especially those with health conditions and being old.
The Coronavirus is clobbering the sick and elderly like the flu virus would do............if there were no flu vaccine to provide a massive amount of protection.
Younger people get flu shots too and this also lessens flu deaths but not nearly as much as it does for the sick/elderly.
The Coronavirus is not killing younger people at an alarming rate. If it were not for the stats being completely dominated by the sick and elderly deaths, the alarm over the Coronavirus might be at least an order of magnitude less.
This bar graph makes it crystal clear:
https://www.buzzfeednews.com/article/lamvo/coronavirus-death-rates-age-charts-us-china
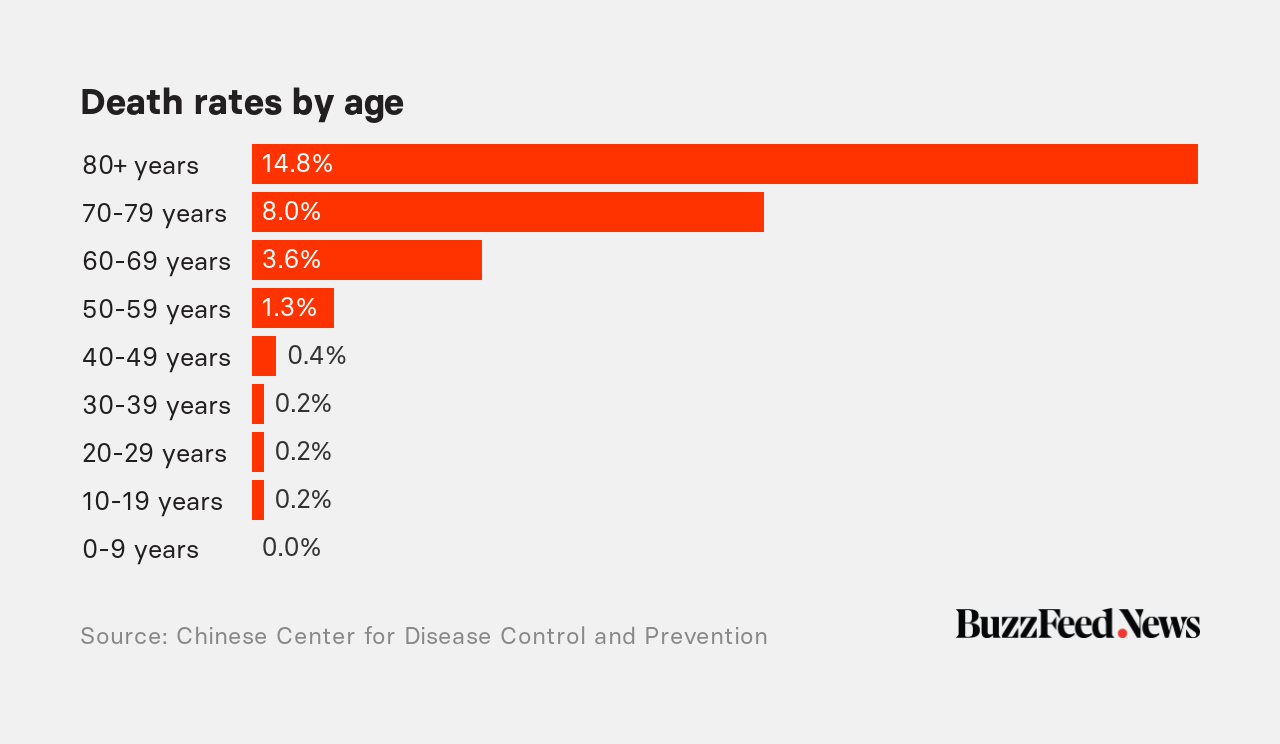
metmike: If we did away with flu shots and allowed the vast majority of sick/elderly that are now protected from the consequences of the full impact of the flu, that protected portion of people would experience a HUGE increase in deaths(for the old AND sick, at least 2-3 times, if not much more)............maybe not as great as that from the Coronavirus but certainly much closer to it. This explains much of the increased death rate......especially for a country like Italy with the most old/sick people of any country. Flu deaths without a flue vaccine would look very similar to the bar graph above.
Look how low the death rate is for people under 50!!
0.2% is 1 out of 500 for you folks under 40!
0.0% is NOBODY for you little geniuses under 10 years, that read MarketForum (-:
It's not that the Coronavirus is that much more deadly than the flu...............its that the sick and old people who are vulnerable to virus's like the flu are not protected like they are from the flu.
Once a vaccine is developed this will all go away. Once people realize what the real facts are(before the vaccine is ready)...........it will start getting much better.
Hi Mike
You maintain that Italy has a high rate of deaths because they have more older people
That is true but not the entire story
Italy got behind in trying to control the virus and their health care system became over whelmed
Dead people were not even collected from apartments as the number of deaths over whelmed the number of people who were willing to do the job
The hospitals had beds in the hallway such that over crowding became an issue, or incubator of disease
Finally doctors had to decide who got treatment and who did not, essentially deciding who lived or died
Not wanting to cause a panic but the USA could face the same situation as the USA has the least number of beds/1000 population, in the western world
On the good side the USA has the highest number of ICU beds
If the curve goes up slowly the health care system will cope
But it is also a very real possibility that the health care system will falter in the USA
Lets hope we get thru this with a minimum of daily increases
In Canada, we are behind your numbers and our health officials have no idea if we have enough ICU beds or hospital space.
Italy was/is a good example of what happens if the virus gets out of control
We also have a big decision about who gets tested
Our gov't sent out a world wide press release to not travel and if you are abroad to return home immediately as countries may shut down borders with no warning
Our province just reported the highest increase of any province in Canada, as of today.
In U.K the number of infections doubled in the past 24 hrs.
This is why we have no idea how fast the infection will increase
We have doctors refusing patient visits to the doctors office as some are setting up video or virtual visits
This may be the best data I've seen on the subject so far. clear and concise. Please keep it coming.
If we stay at or below 20k cases, for all intents and purpose, this will be a non-event... Unless you are one of the 20k.
metmike, thank you for the corona links in this thread
On Saturday afternoon, I posted the US stats to be 2499 cases, 55 deaths.
Today, Sunday afternoon, your posted website showed 3244 cases, 62 deaths.
And now, just a few hours later....3774 cases, 67 deaths
not good!
Gunter, YW
Not good is accurate.
Sunday's end of day update:
Let's go back and look at the number of daily new cases since 3-3-2020.
The first number is the increase compared to the previous day. Clearly, that number is soaring higher.
The 2nd number is the increase compared to the previous day's increase...........a key metric in determining when we will be seeing the inflection point. When this 2nd number is consistently not going higher and especially if the 2nd number can put in numerous days of actually being lower, then we might be topping out for the RATE of transmission.
New daily cases will still be going up when we start to see a deceleration.............but just not as fast. This happens first, before daily cases go down which is what we obviously want to see but seeing the RATE of increase, losing momentum will give us the first clue of it topping in the US.
Since the daily numbers are pretty volatile, we need numerous data points to have any confidence of a reliable signal. We are still going in the wrong direction right now, so this will probably not happen in the next week.
Let's try to update and analyze this daily, adding the new number each time, 3-15, 3-16, 3-17........and so on. Each day, ends at Midnight CDT.
https://coronavirus.1point3acres.com/en
3-3 21
3-4 31+10
3-5 75+46
3-6 99+24
3-7 116+17
3-8 121+5
3-9 179+58
3-10 290+111
3-11 247-43
3-12 427+180
3-13 567+144
3-14 718+146
3-15 803+85 total cases 3,808
In tracking this number closely, I have become aware that revisions of some previous days are being made.
The total number is 3,808. I am wild guessing that we could get to 20,000 before the end of the month. We need many more data points with the ramped up testing and reporting to get a better idea but the exponential increase right now, has slowed down/decelerated temporarily(it peaked on the 12th)
Sunday's smaller increase may have been an outlier because of what day of the week it was or for other reasons. Numerous additional data points are needed to have any legit interpretation of the data........other than the fact that the new cases are still increasing.
We could still see some huge increases ahead.
We should note that there are alot of people infected that are not a statistic because their symptoms were so mild that they didn't get tested or need to see a doctor. Some didn't even realize they had it.
edit: That wild guess of 20,000 before the end of the month could be much higher. It would not be impossible, if the numbers ramped up this week for us to hit 100,000 at the end of the month.
That sounds like a lot but 500 times that many have had the flu so far this season!!!!!!!!!!!!
https://www.cdc.gov/flu/about/burden/preliminary-in-season-estimates.htm
We are going nuts over something that will not harm us nearly, not even close to as much as the flu does every year.
Regardless of anything any of us(including me) thinks at the moment the most important thing.........by a very wide margin will be the data telling us whats going on for the rest of the month and beyond.
The observations of reality, recorded with numbers will be the most objective source we can use.
Those numbers are just starting to reflect the truth, which has been hidden from the lack of widespread testing, which will always be the case at the start of a pandemic.
You don't put a pandemic on your calendar for March of 2020 and have the money and resources available. It happens by surprise and you play catch up after it has progressed past your means(to test for it in this case). Testing should have been better in the beginning but the system was never designed for this............in 2020, 2015 or 2009 with the Swine Flu pandemic.
Here is the latest data:
Monday's update:
Let's try to update and analyze this daily, adding the new number each time, 3-15, 3-16, 3-17........and so on. Each day, ends at Midnight CDT.
https://coronavirus.1point3acres.com/en
3-3 21
3-4 31+10
3-5 75+46
3-6 99+24
3-7 116+17
3-8 121+5
3-9 179+58
3-10 290+111
3-11 247-43
3-12 426+179
3-13 567+141
3-14 718+151
3-15 809+91
3-16 944+135 total cases 4,725
There will be revisions of some previous days.
The total number is 4,725. I am wild guessing that we could get OVER 20,000 before the end of the month. We need many more data points with the ramped up testing and reporting to get a better idea but the exponential increase right now, has slowed down/decelerated temporarily(it peaked on the 12th)
Sunday's smaller increase may have been an outlier because of what day of the week it was or for other reasons. Numerous additional data points are needed to have any legit interpretation of the data........other than the fact that the new cases are still increasing.
We could still see some huge increases ahead.
We should note that there are alot of people infected that are not a statistic because their symptoms were so mild that they didn't get tested or need to see a doctor. Some didn't even realize they had it.
That wild guess of 20,000 before the end of the month could be much higher. It would not be impossible, if the numbers ramped up this week for us to hit 100,000 at the end of the month. It doesn't look like we will go that high but we will let the data tell us more.
That sounds like a lot but 500 times that many have had the flu so far this season!!!!!!!!!!!!
https://www.cdc.gov/flu/about/burden/preliminary-in-season-estimates.htm
We are going nuts over something that will not harm us as much as the flu does every year. Yes, its more contagious and much more deadly than the flu to old/sick people and shutting down non essential groups is a good thing.
Tuesdays update:
Let's go back and look at the number of daily new cases since 3-3-2020.
The first number is the increase compared to the previous day. Clearly, that number is soaring higher.
The 2nd number is the increase compared to the previous day's increase...........a key metric in determining when we will be seeing the inflection point. When this 2nd number is consistently not going higher and especially if the 2nd number can put in numerous days of actually being lower, then we might be topping out for the RATE of transmission.
New daily cases will still be going up when we start to see a deceleration.............but just not as fast. This happens first, before daily cases go down which is what we obviously want to see but seeing the RATE of increase, losing momentum will give us the first clue of it topping in the US.
Since the daily numbers are pretty volatile, we need numerous data points to have any confidence of a reliable signal. We are still going in the wrong direction right now, so this will probably not happen in the next week.
Let's try to update and analyze this daily, adding the new number each time, 3-15, 3-16, 3-17........and so on. Each day, ends at Midnight CDT.
https://coronavirus.1point3acres.com/en
3-3 21
3-4 31+10
3-5 75+46
3-6 99+24
3-7 116+17
3-8 121+5
3-9 179+58
3-10 290+111
3-11 247-43
3-12 424+177
3-13 530+106
3-14 723+193
3-15 711-12
3-16 1,068+357
3-17 1,753+685
Total cases 6,497
There will be revisions of some previous days. Actually, today the number peaked over 800 around 7pm, then they revised it downwards.............looks like they shifted/added 100 from today's count at that time, back to yesterday with the big revision upward for Monday also happening this evening.
It appears that the last 5 numbers are apt to see adjustments and are not final.
I am guessing that we will get OVER 40,000 before the end of the month now. We need many more data points with the ramped up testing and reporting to get a better idea but the exponential increase right now HAS NOT slowed down/decelerated.
Sunday's smaller increase may have been an outlier because of what day of the week it was or for other reasons. Numerous additional data points are needed to have any legit interpretation of the data........other than the fact that the new cases are still increasing.
We could still see some huge increases ahead. The Coronavirus is at least twice as contagious as the flu(NOBODY IS IMMUNIZED), so the spread before we imposed the draconian measures may have been very rapid and affected many people that will show up with positive tests the rest of the month.
We should note that there are alot of people infected that are not a statistic because their symptoms were so mild that they didn't get tested or need to see a doctor. Some didn't even realize they had it.
That revised higher guess of 40,000+ before the end of the month could go much higher. As mentioned previously, It would not be impossible, if the numbers ramped up this week for us to hit 100,000 at the end of the month. We will let the data tell us more.
That sounds like a lot but 50 times that many have had the flu so far this season!!!!!!!!!!!!
I messed up the math on that number.......... 500 times that number have had the flu.
100,000(Coronavirus cases on March 30) X 500 =50,000,000(flu cases)
https://www.cdc.gov/flu/about/burden/preliminary-in-season-estimates.htm
1:40 pm EDIT: Today is going to feature the biggest increase yet by far. This makes that 100,000 number seem more possible.
2:20pm. Todays huge number, as mentioned the last couple of days has alot to do with the "ramped up testing" many of these NEW numbers are actually OLD cases that have been out there but not detected. This is going to inflate the NEW numbers that will show up as one number but actually be NEW cases + OLD cases just now testing positive with the tests available. After we catch up this week, the opposite will happen. NEW cases will really be almost all NEW cases and the rate of increase/acceleration could reverse and make it look better.
7pm: We might hit 2,000 today.
12:40am: We were above 800 at 7pm but they revised the number lower shortly after that to 1,753.........strange. I would like to know whats going on. At the same time, yesterdays number was increased by over 100 late today. Strange. Don't know if I can contact somebody to ask them why this is happening.
metmike, thanks for mentioning the covid19info.live site. It is spectacular.
Just out of curiosity, I jotted down the US data during the last few hours.
yesterday evening.....4661 cases, 85 deaths
15 hours later (today in the morning) 5145 cases, 91 deaths
18 hours later....5702 cases, 94 deaths
24 hours later...6423 cases. 108 deaths
Of course, looking at the number of cases does not necessarily reflect the spreading of the disease. It probably has to do with the fact that more testing facilities are now in operation, and more people are being tested.
Thanks Gunter,
Yes, much of the increase is just from more testing of existing cases.
The number almost doubled today but the actual cases probably went up by much less than half of that. They were a combination of new cases +old cases being tested for the first time.
Wednesday's update:
Let's go back and look at the number of daily new cases since 3-3-2020.
The first number is the increase compared to the previous day. Clearly, that number is soaring higher.
The 2nd number is the increase compared to the previous day's increase...........a key metric in determining when we will be seeing the inflection point. When this 2nd number is consistently not going higher and especially if the 2nd number can put in numerous days of actually being lower, then we might be topping out for the RATE of transmission.
New daily cases will still be going up when we start to see a deceleration.............but just not as fast. This happens first, before daily cases go down which is what we obviously want to see but seeing the RATE of increase, losing momentum will give us the first clue of it topping in the US.
Since the daily numbers are pretty volatile, we need numerous data points to have any confidence of a reliable signal. We are still going in the wrong direction right now, so this will probably not happen in the next week.
Each day, ends at Midnight CDT.
https://coronavirus.1point3acres.com/en
3-3 21
3-4 31+10
3-5 75+46
3-6 99+24
3-7 116+17
3-8 121+5
3-9 179+58
3-10 290+111
3-11 247-43
3-12 425+178
3-13 528+103
3-14 732+204
3-15 710-22 % Increase in daily rate vs previous day this week(with increased testing)
3-16 976+266 +37%
3-17 1,816+880 +90%
3-18 2,947+1,131 +62%
Total cases 9,424
There will be revisions of some previous days.
I am guessing that we will get well OVER 60,000 before the end of the month now(with a new upside target of 200,000 possible-if the increased rate does not slow down).
. We need many more data points with the ramped up testing and reporting to get a better idea but the exponential increase right now HAS NOT slowed down/decelerated.
We could still see some huge increases ahead. The Coronavirus is at least twice as contagious as the flu(NOBODY IS IMMUNIZED), so the spread before we imposed the draconian measures may have been very rapid and affected many people that will show up with positive tests the rest of the month.
We should note that there are alot of people infected that are not a statistic because their symptoms were so mild that they didn't get tested or need to see a doctor. Some didn't even realize they had it.
That revised higher guess of 60,000+ before the end of the month could go much higher. The of increase this week, if sustained could result in 200,000+ at the end of the month. We will let the data tell us more.
That sounds like a lot but 250 times that many have had the flu so far this season!!!!!!!!!!!!
200,000(Coronavirus cases on March 30) X 250 =50,000,000(flu cases)
https://www.cdc.gov/flu/about/burden/preliminary-in-season-estimates.htm
10:40am: Still early but the number should be as high as Tuesday. Again, we are catching up to the numbers of cases with our testing, so initially, the acceleration higher is measuring the cases FROM LAST WEEK and PREVIOUSLY + the new cases FROM THIS WEEK. After we get caught up, then the numbers will mainly measure the new cases from the latest time frame.................and they should decelerate soon after that because those time frames will be affected by the draconian measures that WILL slow the spread.
1. We will know who has it, so they will be better isolated
2. People are not interacting in groups with each other like before...........understatement of our life.
3. People are taking other precautions.
4. This, with absolute certainty, will cause the spread to plunge and new cases to peak. It's just a matter of when the peak will be...........considering the shut down, after we catch up with the tests, it could come by the end of the month. We will see the peak in the data above with 100% certainty but will need numerous data points. When that happens..........the panic WILL END. FOR SURE THE PANIC WILL END BECAUSE THE SCARIEST UNKNOWN WILL BECOME KNOWN.
12:40pm: Headed towards yesterdays final number but could go higher. Again, the increase(first number) is important but the change increase/decrease(2nd number) is an advance indicator that will tell us when its getting better before the actual numbers go down.
338pm Just topped yesterdays number. Could hit over 2,000 today.
4:58pm- Over 2,500 today..........exponential increase continues........will up the guess to 60,000 by the end of the month and this makes the potential target of 100,000 mentioned this week look realistic.......with a chance to go over that.
6:10pm- Over 2,700 so far Wednesday, am going to boost the upside potential to 200,000 by the end of the month. To get above that, numbers by early next week will need to be up to 20,000/day and stay up there for the rest of the month. This can't be ruled out, even as the spread slows down but older cases are still getting tested for the first time.
10pm- No slow down in the increasing rate yet.
I started jotting down the US numbers 2 days ago.
Same time yesterday (24 hours ago), we had 5145 cases, and 91 deaths.
Today, it's 7324 cases, and 115 deaths.
the increase in case numbers may be due to increased testing, but the 26% increase in fatalities is real.
Thursday's update:
Let's go back and look at the number of daily new cases since 3-3-2020.
The first number is the increase compared to the previous day. Clearly, that number is soaring higher.
The 2nd number is the increase compared to the previous day's increase...........a key metric in determining when we will be seeing the inflection point. When this 2nd number is consistently not going higher and especially if the 2nd number can put in numerous days of actually being lower, then we might be topping out for the RATE of transmission.
New daily cases will still be going up when we start to see a deceleration.............but just not as fast. This happens first, before daily cases go down which is what we obviously want to see but seeing the RATE of increase, losing momentum will give us the first clue of it topping in the US.
Since the daily numbers are pretty volatile, we need numerous data points to have any confidence of a reliable signal. We are still going in the wrong direction right now, so this will probably not happen in the next week.
Each day, ends at Midnight CDT.
https://coronavirus.1point3acres.com/en
Date New Cases+/-change in new cases vs yesterday %change in new cases
3-3 21
3-4 31+10
3-5 75+46
3-6 99+24
3-7 116+17
3-8 121+5
3-9 179+58
3-10 290+111
3-11 247-43
3-12 425+178
3-13 528+103
3-14 732+204
3-15 710-22 % Increase in daily rate vs previous day this week(with increased testing-this number will go lower as first indicator of slow down)
3-16 976+266 +37%
3-17 1,816+880 +90%
3-18 2,947+1,131 +62%
3-19 4,939+1,992 +68%
Total cases 14,332
There will be revisions of some previous days.
I'll keep the upside target of 200,000 before the end of the month for today and realize that lower estimates previously were waaaay too low.
We need many more data points with the ramped up testing and reporting to get a better idea but the exponential increase right now HAS NOT slowed down/decelerated.
We could still see some huge increases ahead. The Coronavirus is at least twice as contagious as the flu(NOBODY IS IMMUNIZED), so the spread before we imposed the draconian measures may have been very rapid and affected many people that will show up with positive tests the rest of the month.
We should note that there are alot of people infected that are not a statistic because their symptoms were so mild that they didn't get tested or need to see a doctor. Some didn't even realize they had it.
The increase this week, if sustained could result in 200,000+ at the end of the month. We will let the data tell us more.
That sounds like a lot but 250 times that many have had the flu so far this season!!!!!!!!!!!!
200,000(Coronavirus cases on March 30) X 250 =50,000,000(flu cases)
https://www.cdc.gov/flu/about/burden/preliminary-in-season-estimates.htm
Noon: Still early on Thursday but the number should be at least as high as Wednesday. Again, we are catching up to the numbers of cases with our testing, so initially, the acceleration higher is measuring the cases FROM LAST WEEK and PREVIOUSLY + the new cases FROM THIS WEEK.
5pm: Still increasing fast as we catch up in the testing.
10pm: The rate this week has been fairly steep and steady.
After we get caught up, then the numbers will mainly measure the new cases from the latest time frame.................and they should decelerate soon after that because those time frames will start to be affected by the draconian measures that WILL slow the spread. When will that be? Not this week.
1. We will know who has it, so they will be better isolated
2. People are not interacting in groups with each other like before...........understatement of our life.
3. People are taking other precautions.
4. This, with absolute certainty, will cause the spread to plunge and new cases to peak. It's just a matter of when the peak will be...........considering the shut down, after we catch up with the tests, it could come by the end of the month. We will see the peak in the data above with 100% certainty but will need numerous data points. When that happens..........the panic WILL END. FOR SURE THE PANIC WILL END BECAUSE THE SCARIEST UNKNOWN WILL BECOME KNOWN.
Hi Mike
Just a quick question or two
When will we have everybody tested
I maintain that is impossible
Do we force everybody to take a test
2nd: How effective will testing be
I could test negative today and a week from now test positive due to coming in contact with a carrier that did not have their test until tomorrow
3rd: How do we track down all the homeless that don't care if they are tested. Illegals that don't dare be tested and identified as an illegal
The march break and crowded beaches showed us proof positive that many are not taking the virus seriously. How do you test somebody that doesn't want or care if they are tested
IMHO testing is merely a feel good thing to do, but mostly, just that, a feel good thing as if somebody is doing something
Not saying testing is all bad as the positive tests will be known. At least we will have some information, but not enough
Does the USA have 350 million test kits and then those that will show symptoms 3 weeks or more after the 1st test, will need more test kits
SATURDAYS UPDATE BELOW.
Saturday's rate of increase is below the T-W-Th rate of increase but we have alot of work to do before seeing the slowdown light at the end of the Coronavirus tunnel.
Let's go back and look at the number of daily new cases since 3-3-2020.
The first number is the increase compared to the previous day. Clearly, that number is soaring higher.
The 2nd number is the increase compared to the previous day's increase...........a key metric in determining when we will be seeing the inflection point. When this 2nd number is consistently not going higher and especially if the 2nd number can put in numerous days of actually being lower, then we might be topping out for the RATE of transmission.
New daily cases will still be going up when we start to see a deceleration.............but just not as fast. This happens first, before daily cases go down which is what we obviously want to see but seeing the RATE of increase, losing momentum will give us the first clue of it topping in the US.
Since the daily numbers are pretty volatile, we need numerous data points to have any confidence of a reliable signal. We are still going in the wrong direction right now, so this will probably not happen in the next week.
Each day, ends at Midnight CDT.
https://coronavirus.1point3acres.com/en
Date New Cases+/-change in new cases vs yesterday %change in new cases
3-3 21
3-4 31+10
3-5 75+46
3-6 99+24
3-7 116+17
3-8 121+5
3-9 179+58
3-10 290+111
3-11 247-43
3-12 425+178
3-13 528+103
3-14 732+204
3-15 710-22
% Increase in daily rate vs previous day this week(with increased testing-this number will go lower as first indicator of slow down)
3-16 975+265 +37%
3-17 1,731+756 +78%
3-18 2,806+1,075 +62%
3-19 4,901+2,095 +75%
3-20 5,617+716 +15%
3-21 7,154+1,537 +27%
Total cases 26,867
There will be revisions of some previous days.
I'll keep the upside target of 200,000 before the end of the month for today but if we are slowing down on the increasing rate, we might actually have to back down next week.
We need many more data points with the ramped up testing and reporting to get a better idea but the exponential increase right now COULD BE SLOWING DOWN. MAINLY FROM TESTING CATCHING UP.
We could still see some huge increases ahead. The Coronavirus is at least twice as contagious as the flu(NOBODY IS IMMUNIZED), so the spread before we imposed the draconian measures may have been very rapid and affected many people that will show up with positive tests the rest of the month.
We should note that there are alot of people infected that are not a statistic because their symptoms were so mild that they didn't get tested or need to see a doctor. Some didn't even realize they had it.
The increase this week, if sustained could result in 200,000+ at the end of the month. We will let the data tell us more.
That sounds like a lot but 250 times that many have had the flu so far this season!!!!!!!!!!!!
200,000(Coronavirus cases on March 30) X 250 =50,000,000(flu cases)
https://www.cdc.gov/flu/about/burden/preliminary-in-season-estimates.htm
After we get caught up, then the numbers will mainly measure the new cases from the latest time frame.................and they should decelerate soon after that because those time frames will start to be affected by the draconian measures that WILL slow the spread. When will that be? Not this week.
WE MIGHT START DECELERATING NEXT WEEK!
1. We will know who has it, so they will be better isolated
2. People are not interacting in groups with each other like before...........understatement of our life.
3. People are taking other precautions.
4. This, with absolute certainty, will cause the spread to plunge and new cases to peak. It's just a matter of when the peak will be...........considering the shut down, after we catch up with the tests, it could come by the end of the month. We will see the peak in the data above with 100% certainty but will need numerous data points. When that happens..........the panic WILL END. FOR SURE THE PANIC WILL END BECAUSE THE SCARIEST UNKNOWN WILL BECOME KNOWN.
++++++++++++++++++++++++++++++++++++++++++++++++++++++++++++++
SUNDAYS UPDATE BELOW.
Each day, ends at Midnight CDT.
https://coronavirus.1point3acres.com/en
 | Coronavirus Disease Live Update in US and Canada | 1Point3Acres Live updates of Coronavirus Disease 2019 (COVID-19) in U.S. and Canada coronavirus.1point3acres.com |
Date New Cases+/-change in new cases vs yesterday %change in new cases
3-3 21
3-4 31+10
3-5 75+46
3-6 99+24
3-7 116+17
3-8 121+5
3-9 179+58
3-10 290+111
3-11 247-43
3-12 425+178
3-13 528+103
3-14 732+204
3-15 710-22
% Increase in daily rate vs previous day this week(with increased testing-this number will go lower as first indicator of slow down)
3-16 974+264 +37%
3-17 1,271+297 +30% previous 1,731+756 +78%
3-18 1,865+594 +47% previous 2,807+1,076 +62%
3-19 6,296+4,431 +238% previous 4,901+2,094 +75%
3-20 5,479-817 -13% previous 5,619+716 +15%
3-21 7,330+1,851 +34% previous 7,182+1,563 +28%
3-22 8,311+981 +13%
Total cases 35,211
NEW COMMENT:
There were massive revisions made late today to the data for 3-17, 3-18, 3-19. If that stands with no reasonable explanation then we can't trust this data as being very reliable. Not sure how data from 6 days ago can be off by so much. I can see numbers going higher if they decided that long delayed test results coming back are counted as an infection from the day that the sample was taken but how did the number on 3-18 drop from 2,807 to 1,865???? Then, the number went up the next day from 4,901 to 6,296???
If this is how things are going to go, then what good is trying to use the trend of the last several days as a valid indicator if 5 days from now, you are going to make changes that could exceed 1,000 for those days which result in an entirely different signal based on the math computations???
My opinion has no basis in fact, but i think we see the daily # increase for another 4 weeks. The rate of increase will slow before that, but until the number of new cases starts to slow down, the gov will continue quarantine.
The effect this will have on the economy is tremendous.
As a side: I am self employed and this does not have a direct effect on my income. However my in laws own a bowling alley. It has been shut down by the governor. The effect of this on them is real and immediate.
That seems likely to me to bowyer.......thanks
TUESDAYS UPDATE BELOW.
New cases dropped by over 2,000....too early to call it a trend but it is a bit of a pleasant surprise.
Let's go back and look at the number of daily new cases since 3-3-2020.
The first number is the increase compared to the previous day. Clearly, that number is soaring higher.
The 2nd number is the increase compared to the previous day's increase...........a key metric in determining when we will be seeing the inflection point. When this 2nd number is consistently not going higher and especially if the 2nd number can put in numerous days of actually being lower, then we might be topping out for the RATE of transmission.
New daily cases will still be going up when we start to see a deceleration.............but just not as fast. This happens first, before daily cases go down which is what we obviously want to see but seeing the RATE of increase, losing momentum will give us the first clue of it topping in the US.
Since the daily numbers are pretty volatile, we need numerous data points to have any confidence of a reliable signal. We are still going in the wrong direction right now, so this will probably not happen in the next week.
Each day, ends at Midnight CDT.
https://coronavirus.1point3acres.com/en
Date New Cases+/-change in new cases vs yesterday %change in new cases
3-3 21
3-4 31+10
3-5 75+46
3-6 99+24
3-7 116+17
3-8 121+5
3-9 179+58
3-10 290+111
3-11 247-43
3-12 425+178
3-13 528+103
3-14 732+204
3-15 710-22
% Increase in daily rate vs previous day this week(with increased testing-this number will go lower as first indicator of slow down)
3-16 968+264 +37%
3-17 1,451+483 +50%
3-18 2,563+1,112 +77%
3-19 5,416+2853 +111%
3-20 5,484+68 +1%
3-21 7,159+1,675
+31%
3-22 8,336+1177 +16%
3-23 11,106+2,770 +33%
3-24 9,069 -2,037 -18%
Total cases 55,241
Tuesday:
New cases dropped over 2,000. We'll see what the rest of the week brings.
Let's Drop the upside target to 150,000 before the end of the month for today(edit: for some reason, I was thinking that March had 30 days) but if we are slowing down on the increasing rate, we will have to back down more.
We need many more data points with the ramped up testing and reporting to get a better idea but the exponential increase right now COULD BE SLOWING DOWN.
There were massive revisions made late Sunday to the data especially for 3-17, 3-18, 3-19. If that stands with no reasonable explanation then we can't trust this data as being very reliable. Not sure how data from 6 days ago can be off by so much. I can see numbers going higher if they decided that long delayed test results coming back are counted as an infection from the day that the sample was taken but how did the number on 3-18 drop from 2,807 to 1,865???? Then, the number went up the next day from 4,901 to 6,296???
If this is how things are going to go, then what good is trying to use the trend of the last several days as a valid indicator if 5 days from now, you are going to make changes that could exceed 1,000 for those days which result in an entirely different signal based on the math computations???
New on Monday: When I was tracking China for 4 weeks, with just one exception on 1 day(when they changed how they reported cases of being infected that included reporting more cases-and they explained it) there were none of these wild, gyrating daily changes that the US is reporting.especially yesterday.
This may be because we have 50 separate states reporting and something that I don't understand but yesterdays huge changes were so shocking/unexpected to somebody that has tracked data for 38 years that it's concerning.
It's pointless to track the data closely everyday because I obviously was mistaken in thinking that a stretch of several days with a trend would mean something...........that can be completely wiped out with numbers that are suddenly 1,000 or more up or down for all the days since 5 days prior.
We could still see some huge increases ahead. The Coronavirus is at least twice as contagious as the flu(NOBODY IS IMMUNIZED), so the spread before we imposed the draconian measures may have been very rapid and affected many people that will show up with positive tests the rest of the month.
We should note that there are alot of people infected that are not a statistic because their symptoms were so mild that they didn't get tested or need to see a doctor. Some didn't even realize they had it.
The increase this week, if sustained could result in 200,000+ at the end of the month. We will let the data tell us more.
That sounds like a lot but 250 times that many have had the flu so far this season!!!!!!!!!!!!
200,000(Coronavirus cases on March 30) X 250 =50,000,000(flu cases)
https://www.cdc.gov/flu/about/burden/preliminary-in-season-estimates.htm
After we get caught up, then the numbers will mainly measure the new cases from the latest time frame.................and they should decelerate soon after that because those time frames will start to be affected by the draconian measures that WILL slow the spread. When will that be? Not this week.
1. We will know more about who has it, so they will be better isolated
2. People are not interacting in groups with each other like before...........understatement of our life.
3. People are taking other precautions.
4. This, with absolute certainty, will cause the spread to plunge and new cases to peak. It's just a matter of when the peak will be...........considering the shut down, after we catch up with the tests, it could come by the end of the month. We will see the peak in the data above with 100% certainty but will need numerous data points. When that happens..........the panic WILL END. FOR SURE THE PANIC WILL END BECAUSE THE SCARIEST UNKNOWN WILL BECOME KNOWN.
WEDNESDAYS UPDATE BELOW.
New cases dropped by over 2,000 on TUESDAY....too early to call it a trend but it is a bit of a pleasant surprise.
Let's go back and look at the number of daily new cases since 3-3-2020.
The first number is the increase compared to the previous day. Clearly, that number is soaring higher.
The 2nd number is the increase compared to the previous day's increase...........a key metric in determining when we will be seeing the inflection point. When this 2nd number is consistently not going higher and especially if the 2nd number can put in numerous days of actually being lower, then we might be topping out for the RATE of transmission.
New daily cases will still be going up when we start to see a deceleration.............but just not as fast. This happens first, before daily cases go down which is what we obviously want to see but seeing the RATE of increase, losing momentum will give us the first clue of it topping in the US.
Since the daily numbers are pretty volatile, we need numerous data points to have any confidence of a reliable signal. We are still going in the wrong direction right now, so this will probably not happen in the next week.
Each day, ends at Midnight CDT.
https://coronavirus.1point3acres.com/en
Date New Cases+/-change in new cases vs yesterday %change in new cases
3-3 21
3-4 31+10
3-5 75+46
3-6 99+24
3-7 116+17
3-8 121+5
3-9 179+58
3-10 290+111
3-11 247-43
3-12 425+178
3-13 528+103
3-14 732+204
3-15 710-22
% Increase in daily rate vs previous day this week(with increased testing-this number will go lower as first indicator of slow down)
3-16 968+264 +37%
3-17 1,451+483 +50%
3-18 2,563+1,112 +77%
3-19 5,416+2853 +111%
3-20 5,484+68 +1%
3-21 7,159+1,675 +31%
3-22 8,336+1177 +16%
3-23 11,106+2,770 +33%
3-24 9,069 -2,037 -18%
3-25 13,873 +4,804 +53% That's a pretty big number
Total cases 69,219
Wednesday:
New cases dropped over 2,000 yesterday. We'll see what the rest of the week brings...........it brought a big number today.
Let's keep the upside target at 150,000 before the end of the month for today(edit: for some reason, I was thinking that March had 30 days). That number looks ok after Wednesdays jump back to higher numbers and no slow down, with 200,000 still possible.
We need many more data points with the ramped up testing and reporting to get a better idea but today's data tells us that we have NOT slowed down yet.
SATURDAYS UPDATE BELOW.
The first number is the increase compared to the previous day. Clearly, that number is soaring higher.
The 2nd number is the increase compared to the previous day's increase...........a key metric in determining when we will be seeing the inflection point. When this 2nd number is consistently not going higher and especially if the 2nd number can put in numerous days of actually being lower, then we might be topping out for the RATE of transmission.
New daily cases will still be going up when we start to see a deceleration.............but just not as fast. This happens first, before daily cases go down which is what we obviously want to see but seeing the RATE of increase, losing momentum will give us the first clue of it topping in the US.
Since the daily numbers are pretty volatile, we need numerous data points to have any confidence of a reliable signal. We are still going in the wrong direction right now, so this will probably not happen in the next week.
Each day, ends at Midnight CDT.
https://coronavirus.1point3acres.com/en
Date New Cases+/-change in new cases vs yesterday %change in new cases
3-3 21
3-4 31+10
3-5 75+46
3-6 99+24
3-7 116+17
3-8 121+5
3-9 179+58
3-10 290+111
3-11 247-43
3-12 425+178
3-13 528+103
3-14 732+204
3-15 710-22
% Increase in daily rate vs previous day this week(with increased testing-this number will go lower as first indicator of slow down)
3-16 968+264 +37%
3-17 1,451+483 +50%
3-18 2,566+1,112 +77%
3-19 5,424+2858 +111%
3-20 5,489+65 +1%
3-21 7,169+1,670 +30%
3-22 8,323+1154 +16%
3-23 9,728+1,406 +17% previous 11,045+2,711 +33%
3-24 10,492 +763 +8% previous 9,216 -2,029 -18%
3-25 13,935 +3,443 +33% previous 13,993 +4,777 +52%
3-26 16,809+2,874 +21%
3-27 18,881 +2,072 +12%
3-28 19,579 +698 +4%
Total cases 124,488
SATURDAY:
They made some big changes again to past data on Friday. This time decreasing 3-23 and increasing 3-24 by over 1,200.
3 days in a row with % of new case numbers slowing down. Too early to say we're turning the corner...........need several more days like this to confirm but this is what turning the corner will look like in its earliest stage and its possible it's starting to happen.
I'm putting this out there for your scrutiny.
Using Data gleaned from: https://www.worldometers.info/coronavirus/country/us/
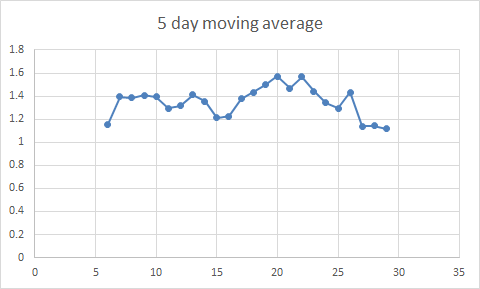
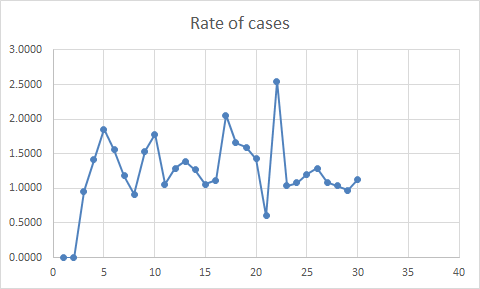
I created 2 charts of the rates of new cases. The ending point of each of these charts is march 28
The first chart is the daily rate.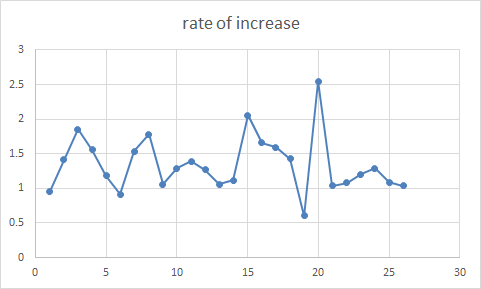
The second is a 5 day moving average, with the end point of March 28. 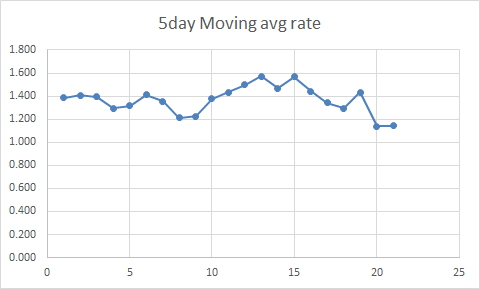
Cutworm's interpterion:
The last 6 points have showed a trending downturn in the rate of cases. Although we are still above 1.0 we need to get below 1on the 5 day moving avg. to know the inflection point may be past.
JMHO and I look forward to any comments.
cutworm,
These are wonderful graphs. I really, really like them. Can you continue to post updates with this.?
Looks encouraging Mike
We did have two days previous only to see increases follow
I wonder where the decreases came from
Did the govonors lock down work??
Or did this happen on a random basis
If govonors lock down worked or not
Let's hope this is good news
People want to get back to normal
Unfortunately Canada is lagging your numbers
Looks like we still have a problem, even on a per capita basis, we are behind you
Actually I have always been more worried about the financial damage to the economy
The Fed has gone insane, trying to fix a problem best left to fix itself
Thanks Mike for the kind words . I will try to post according to my work load. Unfortunately our 3 employees are scared (or they think unemployment comp is better) to come to work. So I'm trying to keep things moving.
Thanks much cutworm,
I will try to not judge your 3 employees because the extreme fear has completely gripped so many people but I thought the unemployment benefits were designed to help those that were laid off from work, not those that can work and choose to not come to work.
This is an example of those benefits backfiring.
I totally get people staying home all the time in the hotspots and for non essential trips everywhere. I get cancelling EVERYTHING that involves groups of people with more than 10(unless its high priority).
But in a county or areas with only isolated reports, why shut things down unnecessarily?
If you are going to justify doing that, then we might as well shut down the entire country for the rest of the year because there will continue to be reports of COVID-19 for the rest of 2020.
My son works for Toyota in Princeton IN just north of here. They make the Highlanders. They have been shut down for 2 weeks with him getting paid. They told him this last week that they will be shut down for another 3 weeks. He will get paid the first 2 but can use PTO time the last week.
A couple of weeks ago, they had 1 employee test positive.
At some point the cure becomes worse than the disease and in places with isolated to no cases, where there is no significant disease we should not apply the same patient killing cure.
If you had 100 people and 5 of them had life threatening, aggressive/advanced cancer, 20 had a milder form and 75 had no cancer or just signs of a benign, pre cancerous growth on their skin in 1 spot, would you treat all of them with intense radiation and chemo???
We need to stop treating the non sick people for a disease they don't have with a treatment that will kill them.
If not for the insane over weighted fear of COVID-19, this would be more clear. We hear that losing even 1 life unnecessarily is not worth it.
OK, so why is losing 40,000 lives every year to the flu ok?
Why is 40,000 lives lost to car accidents every year ok? We should ban cars because they kill far more people than the CV will.
There has to be rational actions based on the risk/rewards, without the emotions/fear and justification for those actions based on facts that include science/medicine and the health of our economy.
Awesome data from both MM and Cutworm. Best I've seen. Keep it coming.
MONDAYS UPDATE BELOW.
The first number is the increase compared to the previous day. Clearly, that number is soaring higher.
The 2nd number is the increase compared to the previous day's increase...........a key metric in determining when we will be seeing the inflection point. When this 2nd number is consistently not going higher and especially if the 2nd number can put in numerous days of actually being lower, then we might be topping out for the RATE of transmission.
New daily cases will still be going up when we start to see a deceleration.............but just not as fast. This happens first, before daily cases go down which is what we obviously want to see but seeing the RATE of increase, losing momentum will give us the first clue of it topping in the US.
Since the daily numbers are pretty volatile, we need numerous data points to have any confidence of a reliable signal. We are still going in the wrong direction right now, so this will probably not happen in the next week.
Each day, ends at Midnight CDT.
https://coronavirus.1point3acres.com/en
Date New Cases+/-change in new cases vs yesterday %change in new cases
3-3 21
3-4 31+10
3-5 75+46
3-6 99+24
3-7 116+17
3-8 121+5
3-9 179+58
3-10 290+111
3-11 247-43
3-12 425+178
3-13 528+103
3-14 732+204
3-15 710-22
% Increase in daily rate vs previous day this week(with increased testing-this number will go lower as first indicator of slow down)
3-16 968+264 +37%
3-17 1,451+483 +50%
3-18 2,566+1,112 +77%
3-19 5,424+2858 +111%
3-20 5,489+65 +1%
3-21 7,160+1,670 +30%
3-22 8,324+1164 +16%
3-23 9,721+1,397 +17% previous 11,045+2,711 +33%
3-24 10,492 +771 +8% previous 9,216 -2,029 -18%
3-25 13,927 +3,435 +33% previous 13,993 +4,777 +52%
3-26 16,779 +2,852 +21%
3-27 18,865 +2,086 +12%
3-28 19,746 +881 +4%
3-29 18,017 -1,729 -8% -odd update previous 19,324 -444 -2%
3-30 21,996 +3,979 +22%
Total cases 163,869
SUNDAY:
They made some big changes again to past data on Friday. This time decreasing 3-23 and increasing 3-24 by over 1,200.
4 days in a row with % of new case numbers slowing down. Too early to say FOR SURE that we're turning the corner...........need several more days like this to confirm but this is what turning the corner will look like in its earliest stage and its possible it's starting to happen.
The huge changes they have made to past data on a couple of occasions, makes me skeptical regarding how reliable this data is but if these numbers/this data is accurate, then the rate of increase IS slowing down.
Monday: Still possible to see the rate go back up faster this week.
Final comment: Odd that they dropped yesterdays already lower number by more than 1,300 but Monday was higher.
I'm putting this out there for your scrutiny.
Using Data gleaned from: https://www.worldometers.info/coronavirus/country/us/
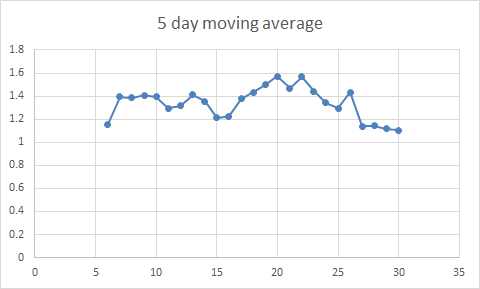
I created 2 charts of the rates of new cases. The ending point of each of these charts is march 29 The first chart is the daily rate.
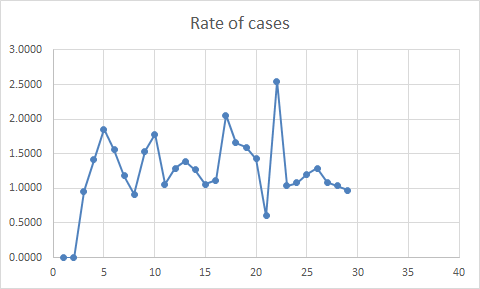
The second is a 5 day moving average, with the end point of March 29
Cutworm :We now have our first day with the rate being below 1(currently .09707) . Lets see if the 5 day can get below 1(currently at 1.118)
cutworm,
I should have noticed this yesterday but it looks like that graph and the data has some HUGE differences in the data from the source that I have been using.
The biggest one for example is March 21st. Your source shows a DROP to 4,825 for that day, then an almost doubling of the cases the next day to 9400!
My source shows a big increase to 7,160 on the 21st(when your sources shows the drop in new cases), then a small increase on the 22nd to 8,323(when your source shows the biggest increase/almost doubling)
As I've been noting, my source makes revisions every day to data going back a week. On 2 occasions, they made massive revisions to data from several days earlier. The revised numbers actually make more sense than the original ones so I'm inclined to believe them........have no choice but to use them but the chaotic nature and revisions have me concerned because it means that we can never trust todays data or that going back for several days, since that could be changed drastically up to 6 days from now.
Regardless, please continue with the graphs and i will try to figure out why the sources differ so much on some past data.
The signal for the past several days from both sources appears to be in the same direction, though my source is a bit more bearish the virus(good for us).
The 5 day moving average will be able to capture some of the discrepancies and wash them out a bit but if the last day in that moving average is a day with a huge discrepancy, the 2 sources will look much different.
Latest forecast for Ohio is peaking on 4/25 at just under 10,000 positive tests/day. We are at approx 2000 total as of 3/30.
Thanks buck,
I see that its a revision of the previous peak being in mid May that was just made 2 days earlier.
So what happened in the last 2 days for them to actually ramp up the rate to 10,000/day a month earlier in Ohio but keep that number of cases at 10,000?
The current rate of increase for the state of Ohio does not justify that. It could go up of course but that number seems to be based on an assumption of nobody taking any precautions and the spread going exponential with no checks.
I took my info from the recently added forecast page of the Ohio Dept of health cornovirus dashboard.
https://coronavirus.ohio.gov/wps/portal/gov/covid-19/home/dashboard/forecast-model/
Thanks much buck!
With regards to their models that are supposedly based on the latest data.
Last 4 days of daily data for Ohio
Fri- 268 new cases, forecast 221
Sat-267 new cases forecast 264
Sun-246 new cases forecast 315
Mon-282 new cases forecast 375
Forecast
Tue forecast 448
Wed forecast 533
Forecast
April 25 forecast 10,000
It's possible that the daily numbers could suddenly go back much higher(not sure why with mitigation that looks to be slowing the rate) but the latest data shows that their model is overforecasting.
They have programmed their model with a formula that is increasing the daily rates by around 19% for this short term period and to taper it off as we get into April, after we have ramped up to some huge numbers.
The last 3 days of data suggest they have plugged in their wild guess of daily increases as being much too high and this is resulting in a much too high forecast of 10,000/day by April 25.
If this was a commodity option with a strike price of 10,000/day that expired on April 25, I would be suggesting people sell as many 10,000/day calls as they can afford (-:
In other words, it ain't gonna happen.
TUESDAYS UPDATE BELOW.
The first number is the increase compared to the previous day. Clearly, that number is soaring higher.
The 2nd number is the increase compared to the previous day's increase...........a key metric in determining when we will be seeing the inflection point. When this 2nd number is consistently not going higher and especially if the 2nd number can put in numerous days of actually being lower, then we might be topping out for the RATE of transmission.
New daily cases will still be going up when we start to see a deceleration.............but just not as fast. This happens first, before daily cases go down which is what we obviously want to see but seeing the RATE of increase, losing momentum will give us the first clue of it topping in the US.
Since the daily numbers are pretty volatile, we need numerous data points to have any confidence of a reliable signal. We are still going in the wrong direction right now, so this will probably not happen in the next week.
Each day, ends at Midnight CDT.
https://coronavirus.1point3acres.com/en
Date New Cases+/-change in new cases vs yesterday %change in new cases
3-3 21
3-4 31+10
3-5 75+46
3-6 99+24
3-7 116+17
3-8 121+5
3-9 179+58
3-10 290+111
3-11 247-43
3-12 425+178
3-13 528+103
3-14 732+204
3-15 710-22
% Increase in daily rate vs previous day this week(with increased testing-this number will go lower as first indicator of slow down)
3-16 968+264 +37%
3-17 1,451+483 +50%
3-18 2,566+1,112 +77%
3-19 5,424+2858 +111%
3-20 5,490+65 +1%
3-21 7,160+1,670 +30%
3-22 8,324+1164 +16%
3-23 9,723+1,399 +17% previous 11,045+2,711 +33%
3-24 10,494 +771 +8% previous 9,216 -2,029 -18%
3-25 13,931 +3,437 +33% previous 13,993 +4,777 +52%
3-26 16,768 +2,839 +21%
3-27 18,888 +2,106 +12%
3-28 19,789 +1,001+4%
3-29 17,944 -1,845 -9% -odd update previous 19,324 -444 -2%
3-30 21,851 +3,907 +22%
3-31 25,412-11pm- +3,561 +16%
Total cases 189,791
SUNDAY:
They made some big changes again to past data on Friday. This time decreasing 3-23 and increasing 3-24 by over 1,200.
4 days in a row with % of new case numbers slowing down. Too early to say FOR SURE that we're turning the corner...........need several more days like this to confirm but this is what turning the corner will look like in its earliest stage and its possible it's starting to happen.
The huge changes they have made to past data on a couple of occasions, makes me skeptical regarding how reliable this data is but if these numbers/this data is accurate, then the rate of increase IS slowing down.
Monday: Still possible to see the rate go back up faster this week.
Final comment Monday: Odd that they dropped yesterdays already lower number by more than 1,300 but Monday was higher. Though the rate over the last 5 days has slowed down.
Tuesday: The rate of increase has slowed down a bit the past 6 days vs the previous 6 days. Numbers are still increasing but considering that part of it is still from catching up on the testing, mitigation is definitely making a difference. Keep up the good work for a few more weeks. Things will be looking much better soon.
Info For these charts gleaned from https://www.worldometers.info/coronavirus/country/us/
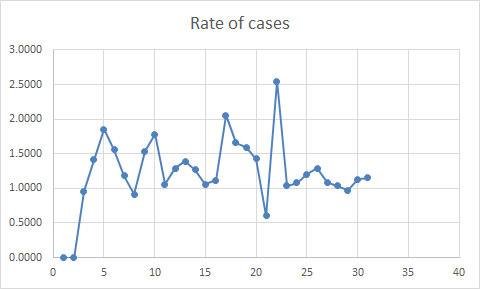
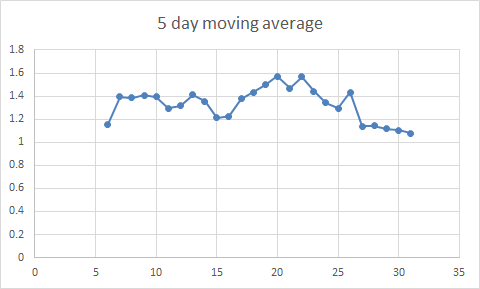
Cutworm: We still haven't broken1 which would be the inflection point. We have slowed the rate of increase from about 1.3-1.4 down to about 1.15ish
note: several things can affect the input data. We can only work with what we have.