| Date | Prior | Current | Rating | |
| Empire St Mfg M/M | Mar-20 | 12.9 | -21.5 | C- |
| Retail Sales M/M | Feb-20 | 0.30% | -0.50% | C- |
| Redbook W/W | 3/14/2020 | 6.00% | 8.50% | C+ |
| Industrial Production M/M | Feb-20 | -0.30% | 0.60% | C+ |
| Business Inventories M/M | Jan-20 | 0.10% | -0.10% | C |
| JOLTS (Job Openings) M/M | Jan-20 | 6.432M | 6.963M | C+ |
| Housing Maket Index M/M | Mar-20 | 74 | 72 | C |
| Housing StartsM/M | Feb-20 | 1.567M | 1.599M | C+ |
| Permits | Feb-20 | 1.551M | 1.464M | C- |
| Existing Home Sales | Feb-20 | 5.46M | 5.77M | C+ |
| Jobless Claims W/W | 3/14/2020 | 211K | 281K | C- |
| Philly FedM/M | Mar-20 | 36.7 | -12.7 | C- |
| Leading Indicators M/M | Feb-20 | 0.8 | 0.1 | C |
Excel copies nicely to this format, but still need a little work on alignment.
Anyway, I think any Metric from Feb or before should have an * as we know dynamic economic changes have recently taken place.
Notable in the last week was the 70k jump in Unemployment claims. I expect further increases. The severity will depend on further virus news.
Also notable was the drop in Empire State Mfg. A regional report, and far from the most significant MFG Metric, but likely along with Philly Fed, an indicator of things to come. Dallas MFG is largely tied to energy and should also take a hard hit in the next report. The rest? We'll see, but I am not optimistic.
Interesting that Redbook showed an increase in retail; Likely due to hoarding?
It's really difficult to form an overall conclusion with the current data we have so far.. Needless to say, strength in metrics, going forward, would be a pleasant but unlikely surprise. For now, I'll give the week a C- as we are likely seeing an economy in contraction. The question is what severity.
Snap shot of the excel as a test. 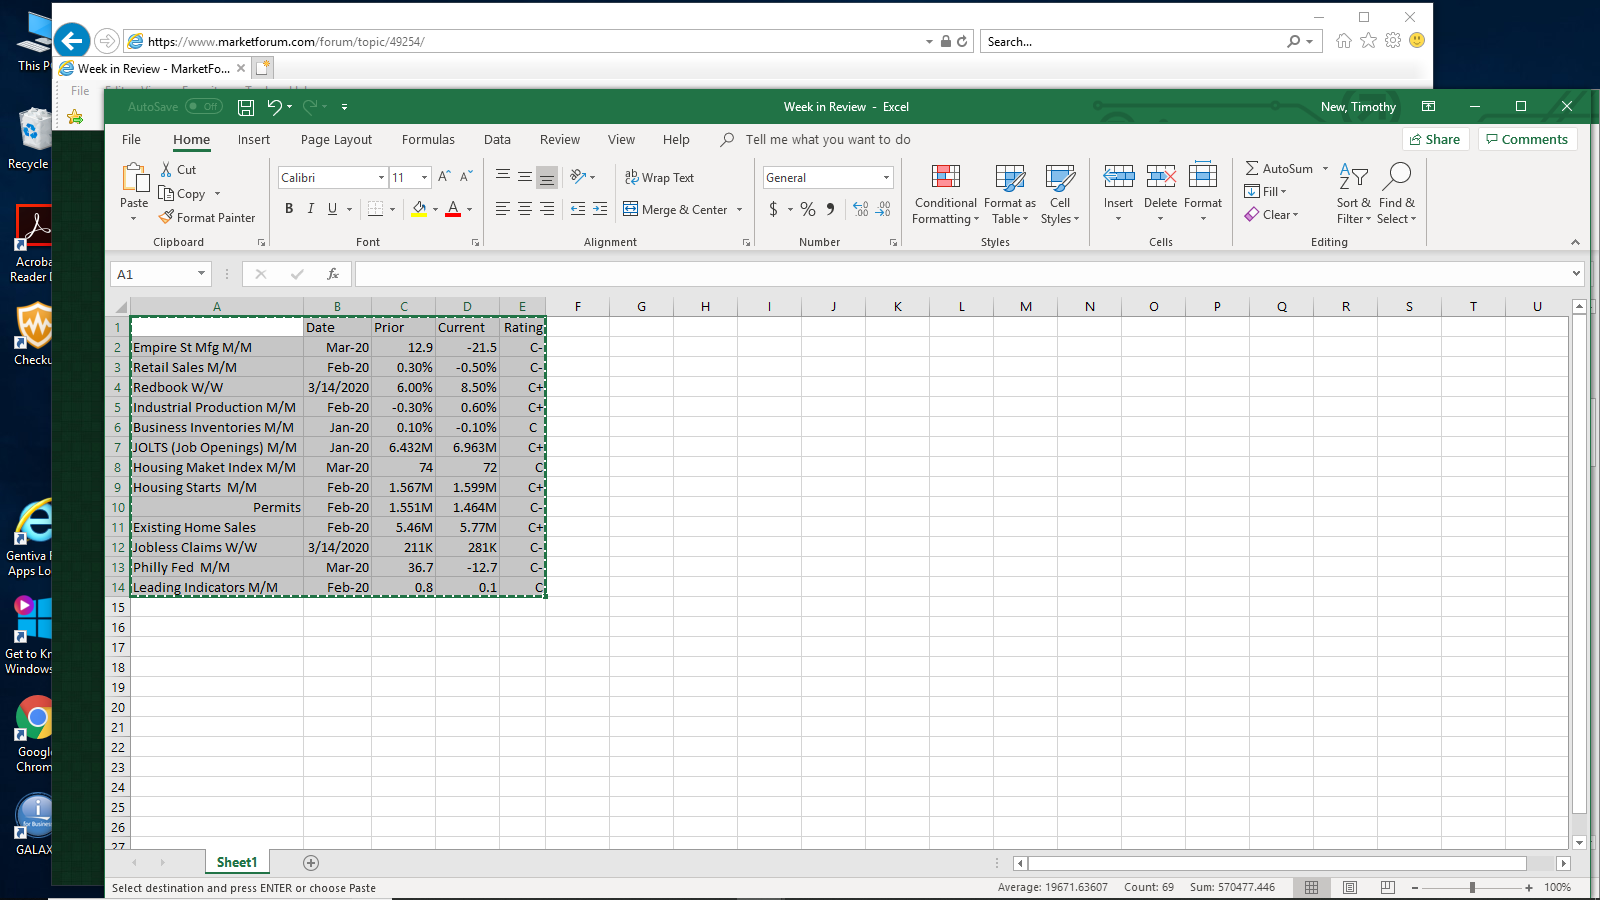
This is a wonderful, wonderful, wonderful contribution Tim!
Thanks so much!
Looking ahead, the numbers will measure an unprecedented situation and be unprecedentedly bad in the short run.
But I strongly believe will pick up quickly by this Summer.
I'm doing this as much for my benefit as anyone. I watch all these numbers, but charting and comparing adds a whole new level of grasping. I plan to continue at least until we return to some semblance of normalcy. After that, we'll see.
It promises to be an interesting journey.
One more test
| Date | Prior | Current | Rating | |
| Empire St Mfg M/M | Mar-20 | 12.9 | -21.5 | C- |
| Retail Sales M/M | Feb-20 | 0.30% | -0.50% | C- |
| Redbook W/W | 3/14/2020 | 6.00% | 8.50% | C+ |
| Industrial Production M/M | Feb-20 | -0.30% | 0.60% | C+ |
| Business Inventories M/M | Jan-20 | 0.10% | -0.10% | C |
| JOLTS (Job Openings) M/M | Jan-20 | 6.432M | 6.963M | C+ |
| Housing Maket Index M/M | Mar-20 | 74 | 72 | C |
| Housing StartsM/M | Feb-20 | 1.567M | 1.599M | C+ |
| Permits | Feb-20 | 1.551M | 1.464M | C- |
| Existing Home Sales | Feb-20 | 5.46M | 5.77M | |
| Jobless Claims W/W | 3/14/2020 | 211K | 281K | C- |
| Philly FedM/M | Mar-20 | 36.7 | -12.7 | C- |
| Leading Indicators M/M | Feb-20 | 0.8 | 0.1 | C |
Much nicer presentation. Align all cels horizontally centered.