KEY EVENTS TO WATCH FOR:
Friday, May 1, 2020
9:45 AM ET. April US Manufacturing PMI
PMI, Mfg (previous 48.5)
10:00 AM ET. March Construction Spending - Construction Put in Place
New Construction (previous -1.3%)
Residential Construction
10:00 AM ET. April ISM Manufacturing Report on Business
Manufacturing PMI (previous 49.1)
Prices Idx (previous 37.4)
Employment Idx (previous 43.8)
Inventories (previous 46.9)
New Orders Idx (previous 42.2)
Production Idx (previous 47.7)
4:00 PM ET. April Domestic Auto Industry Sales
The STOCK INDEXES? http://quotes.ino.com/ex?changes/?c=indexes
The Dow closed sharply lower on Thursday as investors weighed mixed corporate earnings and a report that the federal government was considering retaliating against China for its handling of the coronavirus. The low-range close that sets the stage for a steady to lower opening when Friday's night session begins trading. Stochastics and the RSI are overbought, diverging and are turning neutral to bearish signaling that a short-term top might be in or is near. Closes below the 20-day moving average crossing at 23,407.53 would confirm that a short-term top has been posted. If the Dow extends the rally off March's low, the 62% retracement level of the February-March-decline crossing at 25,199.76 is the next upside target. First resistance is Wednesday's high crossing at 24,764.77. Second resistance is the 62% retracement level of the February-March-decline crossing at 25,199.76. First support is the 20-day moving average crossing at 23,407.53. Second support is April's low crossing at 20,735.02.
The June NASDAQ 100 closed lower on Thursday as it consolidates some of the rally off March's low. The low-range close sets the stage for a steady to lower opening when Friday's night session begins trading. Stochastics and the RSI are overbought but remain neutral to bullish signaling that sideways to higher prices are possible near-term. If June extends the rally off March's low, the 87% retracement level of the February-March-decline crossing at 9384.61 is the next upside target. Closes below the 20-day moving average crossing at 8479.42 would signal that a short-term top has been posted. First resistance is today's high crossing at 9144.75. Second resistance is the 87% retracement level of the January-March-decline crossing at 9384.61. First support is the 20-day moving average crossing at 8479.42. Second support is the April 7th low crossing at 7948.00.
The June S&P 500 closed lower due to profit taking on Thursday as it consolidates some of the rally off March's low. The low-range close sets the stage for a steady to lower opening when Friday's night session begins trading. Stochastics and the RSI are overbought but remain neutral to bullish signaling that sideways to higher prices are possible near-term. If March extends the rally off March's low, the 75% retracement level of the February-March-decline crossing at 3085.85 is the next upside target. Closes below the 20-day moving average crossing at 2770.90 would confirm that a short-term top has been posted. First resistance is Wednesday's high crossing at 2957.70. Second resistance is the 75% retracement level of the February-March-decline crossing at 3085.85. First support is the 20-day moving average crossing at 2770.90. Second support is April's low crossing at 2448.00.
INTEREST RATES? http://quotes.ino.com/ex?changes/?c=interest ""
June T-bonds closed down 29/32's at 180-15.
June T-bonds closed lower on Thursday while extending this month's trading range.The low-range close sets the stage for a steady to lower opening when Friday's night session begins trading. Stochastics and the RSI are diverging and are turning neutral to bearish signaling that sideways to lower prices are possible near-term. Closes below the April 14th low crossing at 177-14 would confirm that a short-term top has been posted while opening the door for a possible test of the 50-day moving average crossing at 176-28. If June renews the rally off March's low, March's high crossing at 191-22. First resistance is last-Wednesday's high crossing at 183-02. Second resistance is the March 12th high crossing at 184-07. First support is the April 14th low crossing at 177-14. Second support is the 50-day moving average crossing at 176-28.
June T-notes closed down 35-points at 138.275.
June T-notes closed lower on Thursday while extending this month's trading range. The low-range close sets the stage for a steady to lower opening when Friday's night session begins trading. Stochastics and the RSI are neutral to bearish signaling that sideways to lower prices are possible near-term. Closes below the April 7th low crossing at 137.160 would confirm that a short-term top has been posted. If June extends the rally off March's low, March's high crossing at 140.240 is the next upside target. First resistance is last-Tuesday's high crossing at 139.220. Second resistance is March's high crossing at 140.240. First support is the April 7th low crossing at 137.160. Second support is the 50-day moving average crossing at 137.048.
ENERGY MARKETS? http://quotes.ino.com/ex?changes/?c=energy ""
June crude oil closed higher on Thursday on news that major oil companies have announced voluntary crude production cuts. The high-range close sets the stage for a steady to higher opening when Friday's night session begins. Stochastics and the RSI are turning neutral to bullish signaling that sideways to higher prices are possible near-term. If June renews this year's decline, zero is the next downside target. Closes above the 20-day moving average crossing at $22.80 are needed to confirm that a short-term low has been posted. First resistance is the 20-day moving average crossing at $22.80. Second resistance is the 50-day moving average crossing at $30.83.First support is last-Tuesday's low crossing at $6.50. Second support is zero.
June heating oil closed higher on Thursday as it consolidated some of this year's decline. The high-range close sets the stage for a steady to higher opening when Friday's night trading session begins. Stochastics and the RSI are turning neutral to bullish signaling that a low might be in or is near. Closes above the 20-day moving average crossing at $92.31 are needed to confirm that a short-term low has been posted. If June extends this year's decline, the October 2001 low on the monthly continuation chart crossing at $49.30 is the next downside target. First resistance is the 20-day moving average crossing at $92.31. Second resistance is the reaction high crossing at $116.02. First support is Tuesday's low crossing at $67.24. Second support is the October 2001 low on the monthly continuation chart crossing at $49.30.
June unleaded gas closed higher on Thursday. The mid-range close sets the stage for a steady to higher opening when Friday's night session begins trading. Stochastics and the RSI are bullish signaling that sideways to higher prices are possible near-term. Closes above the reaction high crossing at 82.72 would confirm that a short-term low has been posted. Closes below March's low crossing at 51.89 would renew this year's decline. First resistance is the 25% retracement level of the January-March-decline crossing at 88.30. Second resistance is the 38% retracement level of the January-March-decline decline crossing at 107.64. First support is March's low crossing at 51.89. Second support is monthly support crossing at 32.40.
June Henry natural gas closed higher on Thursday. The high-range close sets the stage for a steady to higher opening when Friday's night session begins trading. Stochastics and the RSI are neutral signaling that sideways trading is possible near-term. If June renews the rally off April's low, the 50% retracement level of the 2019-2020 decline crossing at 2.154 is the next upside target. If June extends the decline off last-Wednesday's high, the April 14th low crossing at 1.705 is the next downside target. First resistance is last-Wednesday's high crossing at 2.100. Second resistance is the 50% retracement level of the 2019-2020 decline crossing at 2.154. First support is the April 14th low crossing at 1.705. Second support is April's low crossing at 1.649.
CURRENCIES? http://quotes.ino.com/ex?changes/?c=currencies ""
The June Dollar closed sharply lower on Thursday and below the 50-day moving average crossing at 99.32 confirming that a short-term top has been posted. The low-range close sets the stage for a steady to lower opening when Friday's night session begins trading. Stochastics and the RSI are bearish signaling that sideways to lower prices are possible near-term. If June extends today's decline the 62% retracement level of March's rally crossing at 98.14 is the next downside target. Closes above the 10-day moving average crossing at 100.03 would temper the near-term bearish outlook. First resistance is the April 6th high crossing at 101.03. Second resistance is March's high crossing at 103.96. First support is April's low crossing at 98.81. Second support is the March 27thlow crossing at 98.34. Third support is the 62% retracement level of March's rally crossing at 98.14.
The June Euro closed sharply higher on Thursday as it extends the rally off last-Friday's low. The high-range close sets the stage for a steady to higher opening when Friday's night session begins trading. Stochastics and the RSI are neutral to bullish signaling that sideways to higher prices are possible near-term. Closes above the 50-day moving average crossing at 109.95 are needed to confirm that a short-term low has been posted. If June resumes the decline off the March 27th high, March's low crossing at 106.71 is the next downside target. First resistance is the April 15th high crossing at 110.07. Second resistance is the March 27th high crossing at 111.88. First support is last-Friday's low crossing at 107.39. Second support is March's low crossing at 106.71.
The June British Pound closed higher on Thursday. The high-range close sets the stage for a steady to higher opening when Friday's night session begins trading. Stochastics and the RSI have turned neutral to bullish signaling that sideways to higher prices are possible near-term. Today's close above the 50-day moving average crossing at 1.2477 confirms that a short-term low has been posted. If June resumes the decline off the April-14th high crossing at 1.2653, the April 7th low crossing at 1.2174 is the next downside target. First resistance is the 62% retracement level of the December-March-decline crossing at 1.2758. Second resistance is the 75% retracement level of the December-March-decline crossing at 1.3042. First support is the April 7th low crossing at 1.2174. Second support is March's low crossing at 1.1438.
The June Swiss Franc closed higher on Thursday.The high-range close sets the stage for a steady to higher opening when Friday's night session begins trading. Stochastics and the RSI are turning neutral to bullish signaling that sideways to higher prices are possible near-term. Closes above the 50-day moving average crossing at 1.0400 are needed to confirm that a short-term low has been posted. If June extends the decline off the March 30th high, March's low crossing at 1.0138 is the next downside target.First resistance April's high crossing at 1.0443. Second resistance is the March 30th high crossing at 1.0566. First support is last-Friday's low crossing at 1.0216. Second support is March's low crossing at 1.0138.
The June Canadian Dollar closed lower on Thursday.The low-range close sets the stage for a steady to lower opening when Friday's night session begins trading. Stochastics and the RSI are neutral to bullish signaling that sideways to higher prices are possible near-term. If June extends the rally off March's low, the 50% retracement level of the January-March-decline crossing at 72.73 is the next upside target. Closes below last-Tuesday's low crossing at 70.12 would confirm that a short-term top has been posted. First resistance is the 50-day moving average crossing at 72.00. Second resistance is the 50% retracement level of the January-March-decline crossing at 72.73. First support is April's low crossing at $70.12. Second support is the March 31st low crossing at 69.73. Third support is March's low crossing at 68.20.
The June Japanese Yen closed lower on Thursday. The low-range close sets the stage for a steady to lower opening when Friday’s night session begins trading. Stochastics and the RSI are overbought but are turning neutral to bearish signaling that sideways to lower prices are possible near-term. Closes below April's low crossing at 0.0916 would confirm that a short-term top has been posted. If June extends the rally off March's low, long-term resistance crossing at 0.0942 is the next upside target. First resistance is long-term resistance crossing at 0.0942. Second resistance is March's high crossing at 0.0992. First support is April's low crossing at 0.0916. Second support is March's low crossing at 0.0900.
PRECIOUS METALS? http://quotes.ino.com/ex?changes/?c=metals ""
June gold closed lower on Thursday. The low-range close sets the stage for a steady to lower opening when Friday's night session begins trading. Stochastics and the RSI are neutral to bearish signaling that sideways to lower prices are possible near-term. Closes below last-Tuesday's low crossing at $1666.20 would confirm that a short-term top has been posted while opening the door for additional weakness near-term. If April renews the rally off March's low, the October-2012 high on the monthly continuation chart crossing at $1798.10 is the next upside target. First resistance is April's high crossing at $1788.80. Second resistance is the October-2012 high on the monthly continuation chart crossing at $1798.10. First support is last-Tuesday's low crossing at $1666.20. Second support is the 50-day moving average crossing at $1652.90.
July silver posted a key reversal down as it closed lower on Thursday. The low-range close set the stage for a steady to lower opening when Friday's night session begins trading. Stochastics and the RSI are neutral to bearish signaling that sideways to lower prices are possible near-term. Closes below last-Tuesday's low crossing at 14.715 would confirm that a short-term top has been posted. If July resumes the rally off March's low, the 75% retracement level of the February-March-decline crossing at 17.237 is the next upside target. First resistance is the 62% retracement level of the February-March-decline crossing at 16.252. Second resistance is the 75% retracement level of the February-March-decline decline crossing at 17.237 is the next upside target. First support is last-Tuesday's low crossing at 14.715. Second support is the April 1st low crossing at 13.935.
July copper closed lower on Thursday as it consolidates some of the rally off March's low. The low-range close sets the stage for a steady to lower opening when Friday's night session begins trading. Stochastics and the RSI are neutral to bullish signaling that sideways to higher prices are possible near-term. If July extends the rally off March's low, the 50% retracement level of the January-March-decline crossing at 243.80 is the next upside target. Closes below last-Tuesday's low crossing at 221.70 would confirm that a short-term top has been posted. First resistance is today's high crossing at 239.50. Second resistance is the 50% retracement level of the January-March-decline crossing at 243.80. First support is last-Tuesday's low crossing at 221.70. Second support is March's low crossing at 197.95.
GRAINS? http://quotes.ino.com/ex?changes/?c=grains "
July Corn closed up $0.04 3/4-cents at 3.19 1/4.
July corn closed higher due to short covering on Thursday. The high-range close sets the stage for a steady to higher opening when Friday's night sessions begins trading. Stochastics and the RSI are turning neutral to bullish signaling that sideways to higher prices are possible near-term. Closes above the 20-day moving average crossing at $3.27 1/4 are needed to confirm that a short-term low has been posted. If July renews this year's decline, psychological support crossing at $3.00 is the next downside target. First resistance is the 20-day moving average crossing at 3.27 1/4. Second resistance is the 38% retracement level of the January-March-decline crossing at $3.45 3/4. First support is last-Tuesday's low crossing at $3.09. Second support is psychological support crossing at $3.00.
July wheat closed up $0.07-cents at $5.23 1/2.
July wheat closed higher on Thursday as it consolidated some of the decline off last-Monday's high. The high-range close sets the stage for a steady to higher opening when Friday's night session begins trading. Stochastics and the RSI are oversold, diverging and are turning neutral to bullish signaling that a short-term low might be in or is near. Closes above the 20-day moving average crossing at $5.40 1/4 would signal that a short-term low has been posted. If July extends the decline off March's low, the 87% retracement level of March's rally crossing at $5.04 1/4. First resistance is April's high crossing at $5.64 1/2. Second resistance is March's high crossing at $5.71 1/2. First support is today's low crossing at $5.06 3/4. Second support is the 87% retracement level of March's rally crossing at $5.04 1/4.
July Kansas City Wheat closed up $0.11-cents at $4.88.
July Kansas City wheat closed higher on Thursday as it consolidated some of the decline off last-Monday's high. The high-range close sets the stage for a steady to higher opening when Friday night session begins trading. Stochastics and the RSI are turning neutral to bullish signaling that sideways to higher prices are possible near-term. Closes above the 10-day moving average crossing at $4.89 1/4 are needed to temper the near-term bearish outlook. Closes below the 50-day moving average crossing at $4.75 1/4 would confirm that a short-term top has been posted. If July resumes the rally off March's low, January's high crossing at $5.19 is the next upside target.First resistance is April's high crossing at $5.14. Second resistance is January's high crossing at $5.19. First support is the 50-day moving average crossing at $4.75 1/4. Second support is April's low crossing at $4.67 3/4.
July Minneapolis wheat closed up $0.08-cents at $5.15 1/2.
July Minneapolis wheat posted a key reversal up as it closed higher on Thursday as it consolidated some of this year's decline. The high-range close sets the stage for a steady to higher opening when Friday's night session begins trading. Stochastics and the RSI are oversold but remain neutral to bearish signaling that sideways to lower prices are possible near-term. If July extends this year's decline, psychological support crossing at $5.00 is the next downside target. Closes above the 50-day moving average crossing at $5.30 3/4 are needed to confirm that a short-term low has been posted. First resistance is the 20-day moving average crossing at $5.25. Second resistance is the 50-day moving average crossing at 5.30 3/4. First support is today's low crossing at $5.04. Second support is psychological support crossing at $5.00.
SOYBEAN COMPLEX? http://quotes.ino.com/ex?changes/?c=grains "
July soybeans closed up $0.18-cents at $8.55 1/2.
July soybeans closed sharply higher on Thursday. The high-range close sets the stage for a steady to higher opening when Friday's night session begins trading. Stochastics and the RSI are turning neutral to bullish signaling that sideways to higher prices are possible near-term. Closes above the 50-day moving average crossing at $8.70 1/4 are needed to confirm that a short-term low has been posted. If July resumes this year's decline, psychological support crossing at $8.00 is the next downside target. First resistance is today's high crossing at $8.56. Second resistance is the 50-day moving average crossing at $8.70 1/4. First support is last-Tuesday's low crossing at $8.18 1/2. Second support is psychological support crossing at $8.00.
July soybean meal closed up $6.80 at $295.40.
July soybean meal closed higher on Thursday. The high-range close sets the stage for a steady to higher opening when Friday's night session begins trading. Stochastics and the RSI are turning neutral to bullish signaling that sideways to higher prices are possible near-term. If July extends today's rally, the 50-day moving average crossing at $303.40 is the next upside target. Closes above the 50-day moving average crossing at $303.40 are needed to confirm that a short-term low has been posted. If July resumes the decline off March's high, monthly support crossing at $283.10 is the next downside target. First resistance is today's high crossing at $295.70. Second is the 50-day moving average crossing at $303.40. First support is Wednesday's low crossing at $285.60. Second support is monthly support crossing at $283.10.
July soybean oil closed up 40-pts. At 26.57.
July soybean oil closed higher on Thursday. The high-range close sets the stage for a steady to higher opening when Friday's night session begins trading. Closes above the 20-day moving average crossing at 26.61 would temper the near-term bearish outlook. Stochastics and the RSI have turned neutral to bullish signaling that sideways to higher prices are possible near-term. If July renews this month's decline, March's low crossing at 25.02 is the next downside target. First resistance is the 20-day moving average crossing at 26.61. Second resistance is the 50-day moving average crossing at 27.44. First support is Monday's low crossing at 25.09. Second support is March's low crossing at 25.02.
LIVESTOCKhttp://quotes.ino.com/exchanges/?c=livestock
June hogs closed up $3.43 at $58.95.
June hogs closed sharply higher on Thursday as it extends the rally off April's low. The high-range close sets the stage for a steady to higher opening when Friday's night session begins trading. Stochastics and the RSI remain neutral to bullish signaling that sideways to higher prices are possible near-term. If June extends the aforementioned rally the 38% retracement level of the 2019-2020 decline crossing at $62.16 is the next upside target. Closes below the 20-day moving average crossing at $49.77 would confirm that a short-term top has been posted. First resistance is Tuesday's high crossing at $60.78. Second resistance is the 38% retracement level of the 2019-2020 decline crossing at $62.16. First support is the 20-day moving average crossing at $49.77. Second support is April's low crossing at $41.50.
June cattle closed up $1.67 at $85.95.
June cattle closed higher on Thursday as it continues to form a symmetrical Triangle. The high-range close sets the stage for a steady to higher opening on Friday. Stochastics and the RSI are neutral to bullish signaling that sideways to higher prices are possible near-term. Closes above the reaction high crossing at $88.13 are needed to confirm that a short-term low has been posted. If June resumes this year's decline, monthly support crossing at $69.29 is the next downside target. First resistance is the reaction high crossing at $88.13. Second resistance is the 50-day moving average crossing at $91.89. First support is April's low crossing at $76.60. Second support is monthly support crossing at $69.29.
May Feeder cattle closed down $1.45-cents at $117.10.
May Feeder cattle closed lower on Thursday. The low-range close sets the stage for a steady to lower opening when Friday's session begins trading. Stochastics and the RSI are turning neutral to bearish signaling that sideways to lower prices are possible near-term. If May resumes this year's decline, monthly support crossing at $95.50 is the next downside target. Closes above the reaction high crossing at $120.85 would signal that a short-term low has been posted. First resistance is the reaction high crossing at $120.85. Second resistance is the 50-day moving average crossing at $122.57. First support is April's low crossing at $103.62. Second support is monthly support crossing at $95.50.
FOOD & FIBERhttp://quotes.ino.com/ex changes/?c=food
July coffee closed higher on Thursday as it consolidates some of the decline off March's high. The high-range close sets the stage for a steady to higher opening on Friday. Stochastics and the RSI are oversold but remain neutral to bearish signaling that sideways to lower prices are possible near-term. If July extends this month's decline, March's low crossing at 10.31 is the next downside target. Closes above the 20-day moving average crossing at 11.48 would signal that a low has been posted.
July cocoa closed higher on Thursday. The high-range close sets the stage for a steady to higher opening on Friday. Stochastics and the RSI are neutral to bullish signaling that sideways to higher prices are possible near-term. Closes above the 50-day moving average crossing at 24.27 would open the door for a larger-degree rally into early-May. Closes below Monday's low crossing at 23.09 would temper the near-term friendly outlook.
July sugar closed higher on Thursday above the 20-day moving average crossing at 10.17 signaling the short-term low has been posted. The high-range close set the stage for a steady to higher opening on Friday. Stochastics and the RSI are turning neutral to bullish signaling that sideways to higher prices are possible. If July extends this week's rally, the 50-day moving average crossing at 11.48 is the next upside target. If July extends the decline off February's high, monthly support crossing at 8.36 is the next downside target.
July cotton closed higher on Thursday. The mid-range close sets the stage for a steady to higher opening on Friday. Stochastics and the RSI are neutral to bullish signaling that sideways to higher prices are possible near-term. Closes above the 50-day moving average crossing at 57.38 would open the door for additional gains near-term. Closes below the 20-day moving average crossing at 54.05 would temper the near-term friendly outlook.
Thanks tallpine!
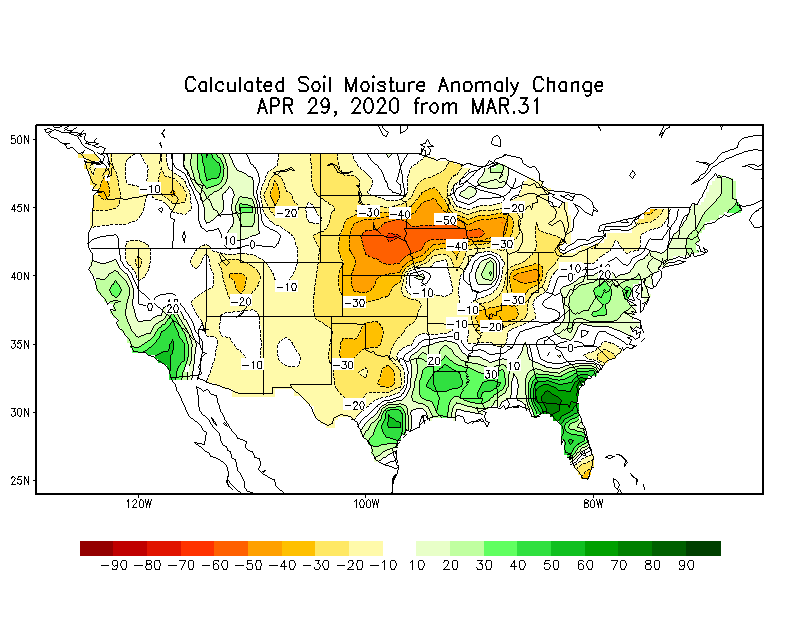
The weather is turning much drier...............if dry weather continues in May it will be BULLISH!
I think that the continued drying over the last month and dry forecasts might have turned dry weather bullish now. Pretty cold in the East with an outside chance for a freeze in early MAY in the Eastern belt.
1st map is change over the last month.
2nd map is updated drought monitor..........some drought now in the Plains and U Midwest for the first time this year.
Bottom maps are the updated forecast. In the last day, we took out all the rains that were there earlier this week.
April 23: LOOKY_LOOKY! For the first time this year, its gotten dry enough for a few (small)areas in the Upper Midwest/Western Cornbelt to report slight drought.
April 30: Drought increased a bit......Plains and U.Midwest.
The maps below are updated on Thursdays.
https://droughtmonitor.unl.edu/

National Weather Service 6-10 day, 8-14 day outlooks.
Updated daily just after 2pm Central.
Temperature Probability
 Precipitation Probability

| the 8-14 day outlooks ArchivesAnalogsLines-Only FormatGIS Data | |
Temperature Probability | |
 | |